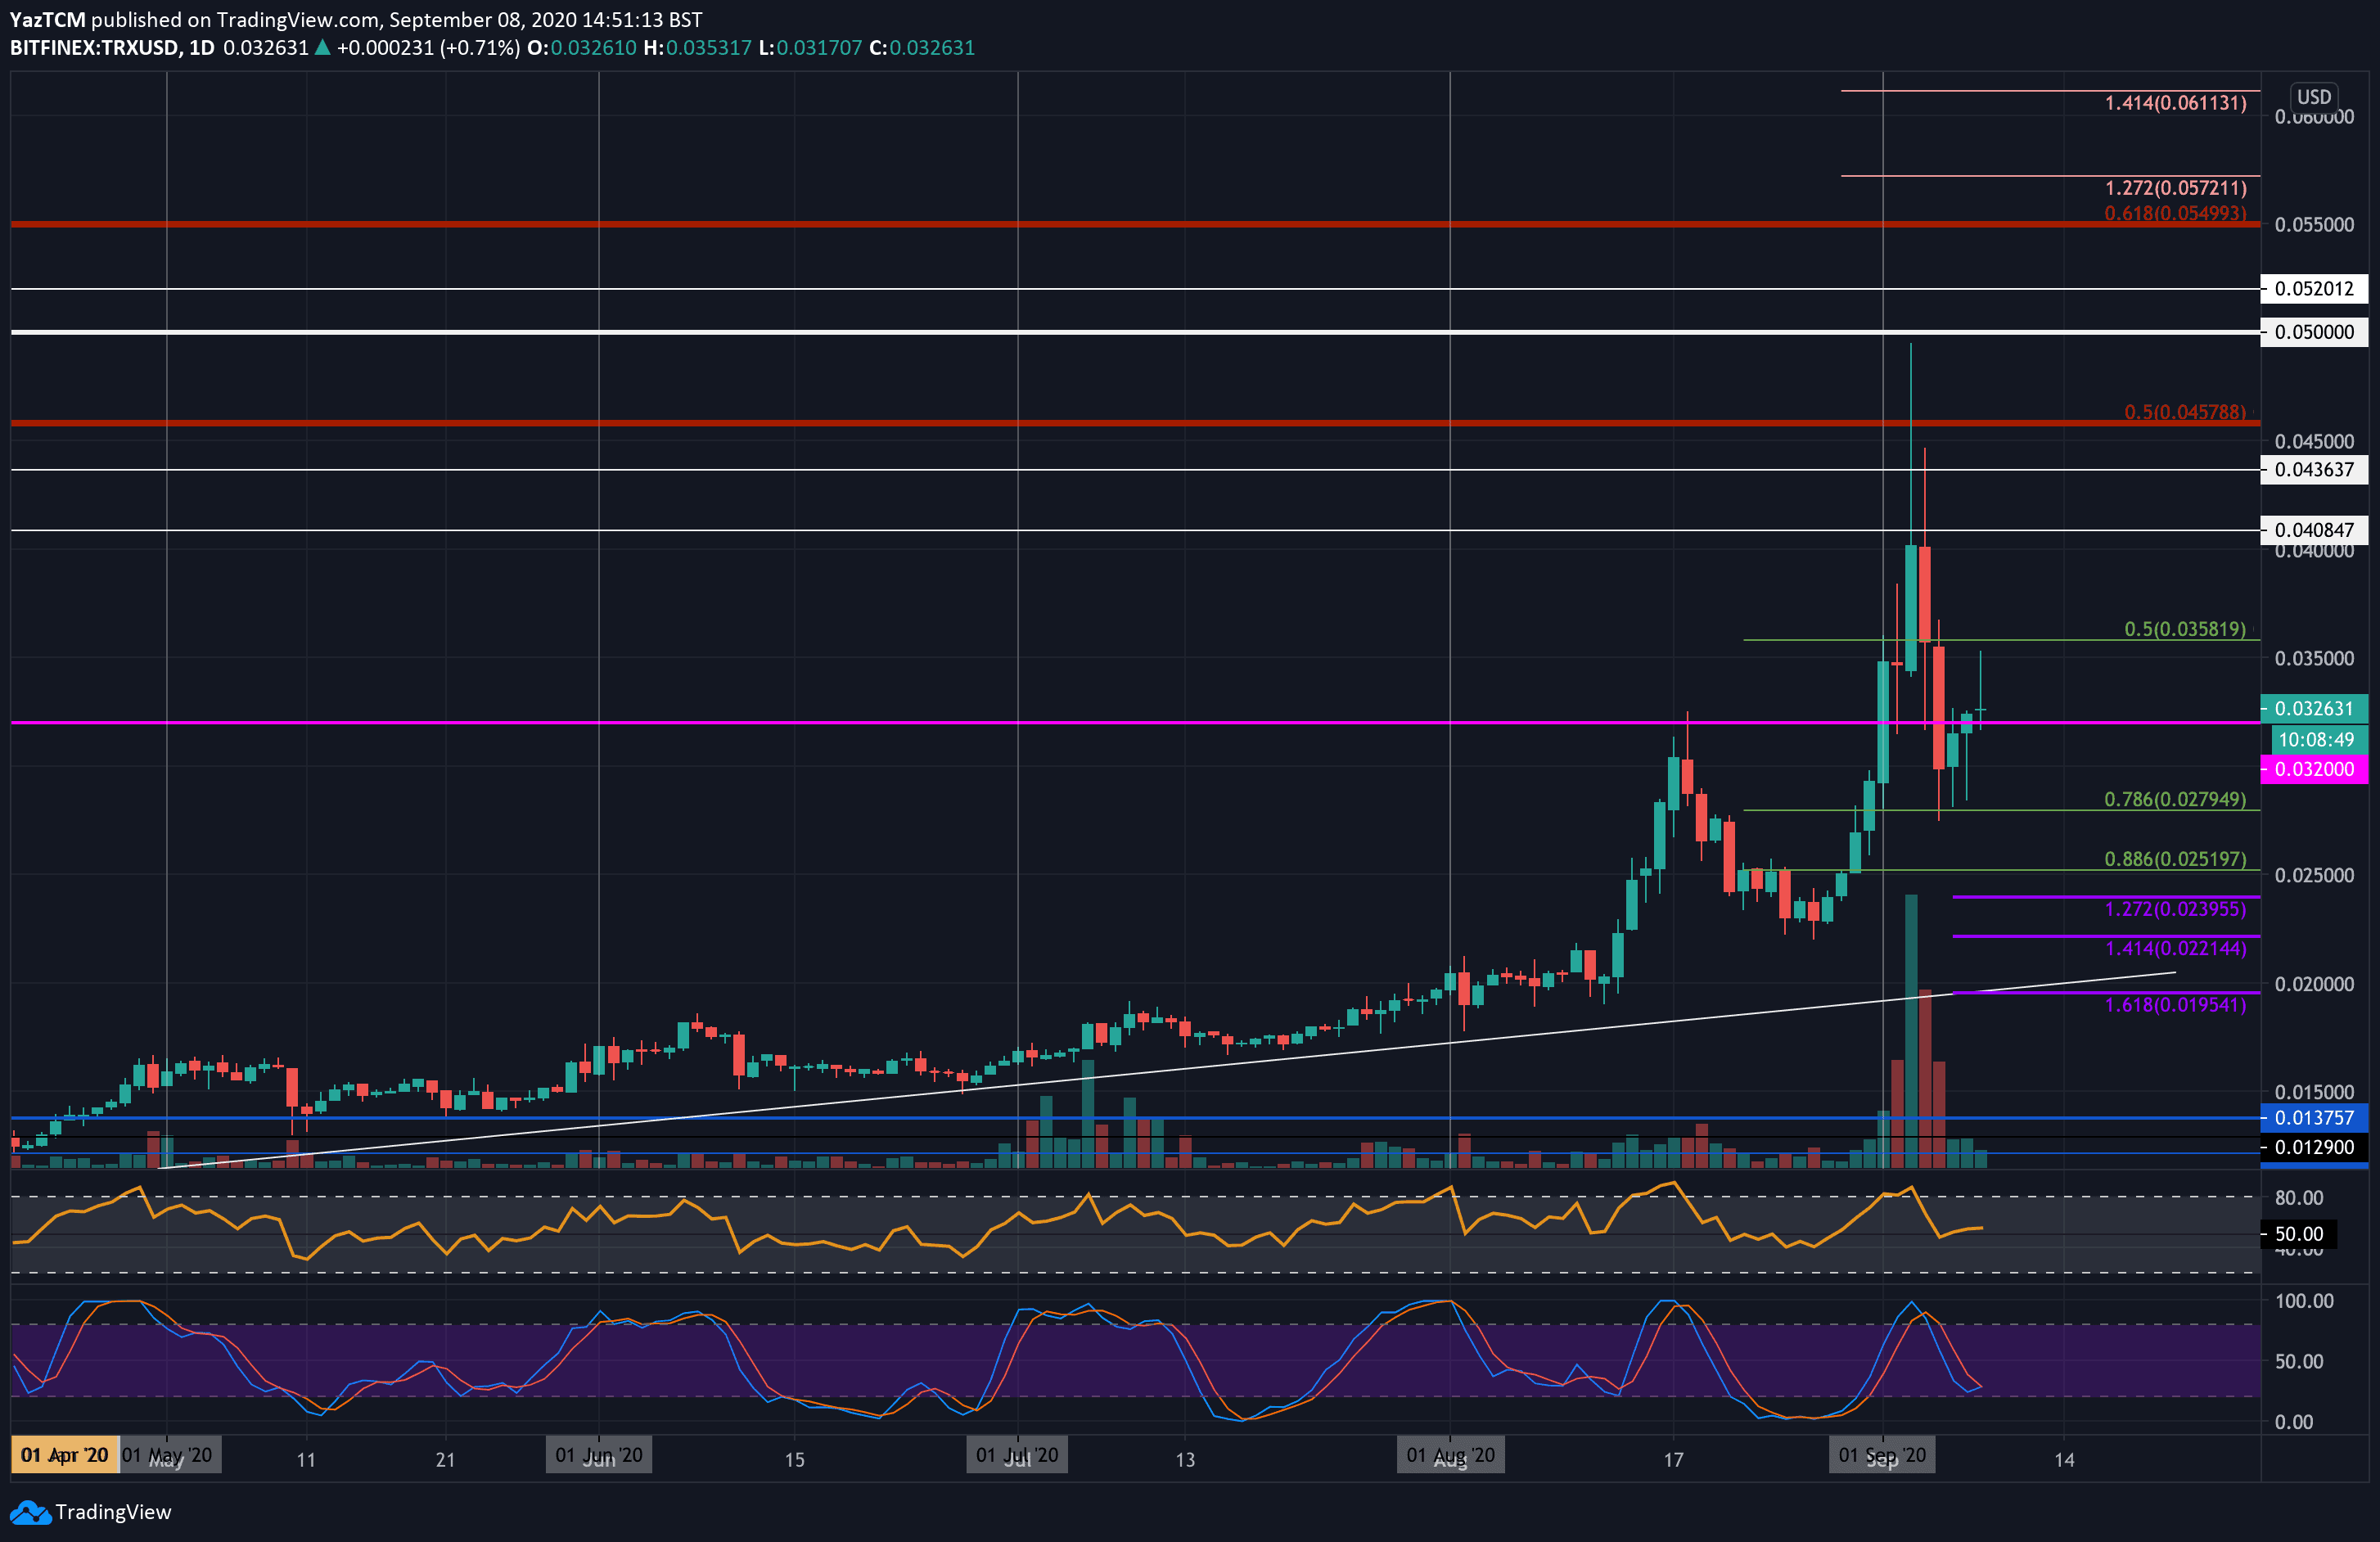
TRX/USD Daily Chart. Source: TradingView
Key Support Levels: $0.032, $0.03, $0.028
Key Resistance Levels: $0.035, $0.04, $0.0436.
TRX was pushing higher toward the end of August and managed to surge near the $0.05 level in September. However, it was unable to close a daily candle above $0.04 and it started to head lower.
During the Bitcoin price drop, TRX spiked as low as $0.28 (.786 Fib Retracement). The bulls managed to recover to end the daily candle above the $0.3 support. The buyers have since allowed TRX to rebound as it hit $0.035 today.
Looking ahead, if the bulls can continue beyond $0.035, the first level of strong resistance lies at $0.04. This is followed by resistance at $0.0408, $0.0436, and $0.0457 (bearish .5 Fib Retracement). Added resistance lies at $0.05 and $0.052.
On the other side, support lies at $0.032, $0.03, and $0.028 (.786 Fib Retracement). Beneath this, added support is found at $0.0251 (.886 Fib Retracement), $0.024, and $0.022.
The Stochastic RSI is primed for a bullish crossover signal that should help to send TRX higher.
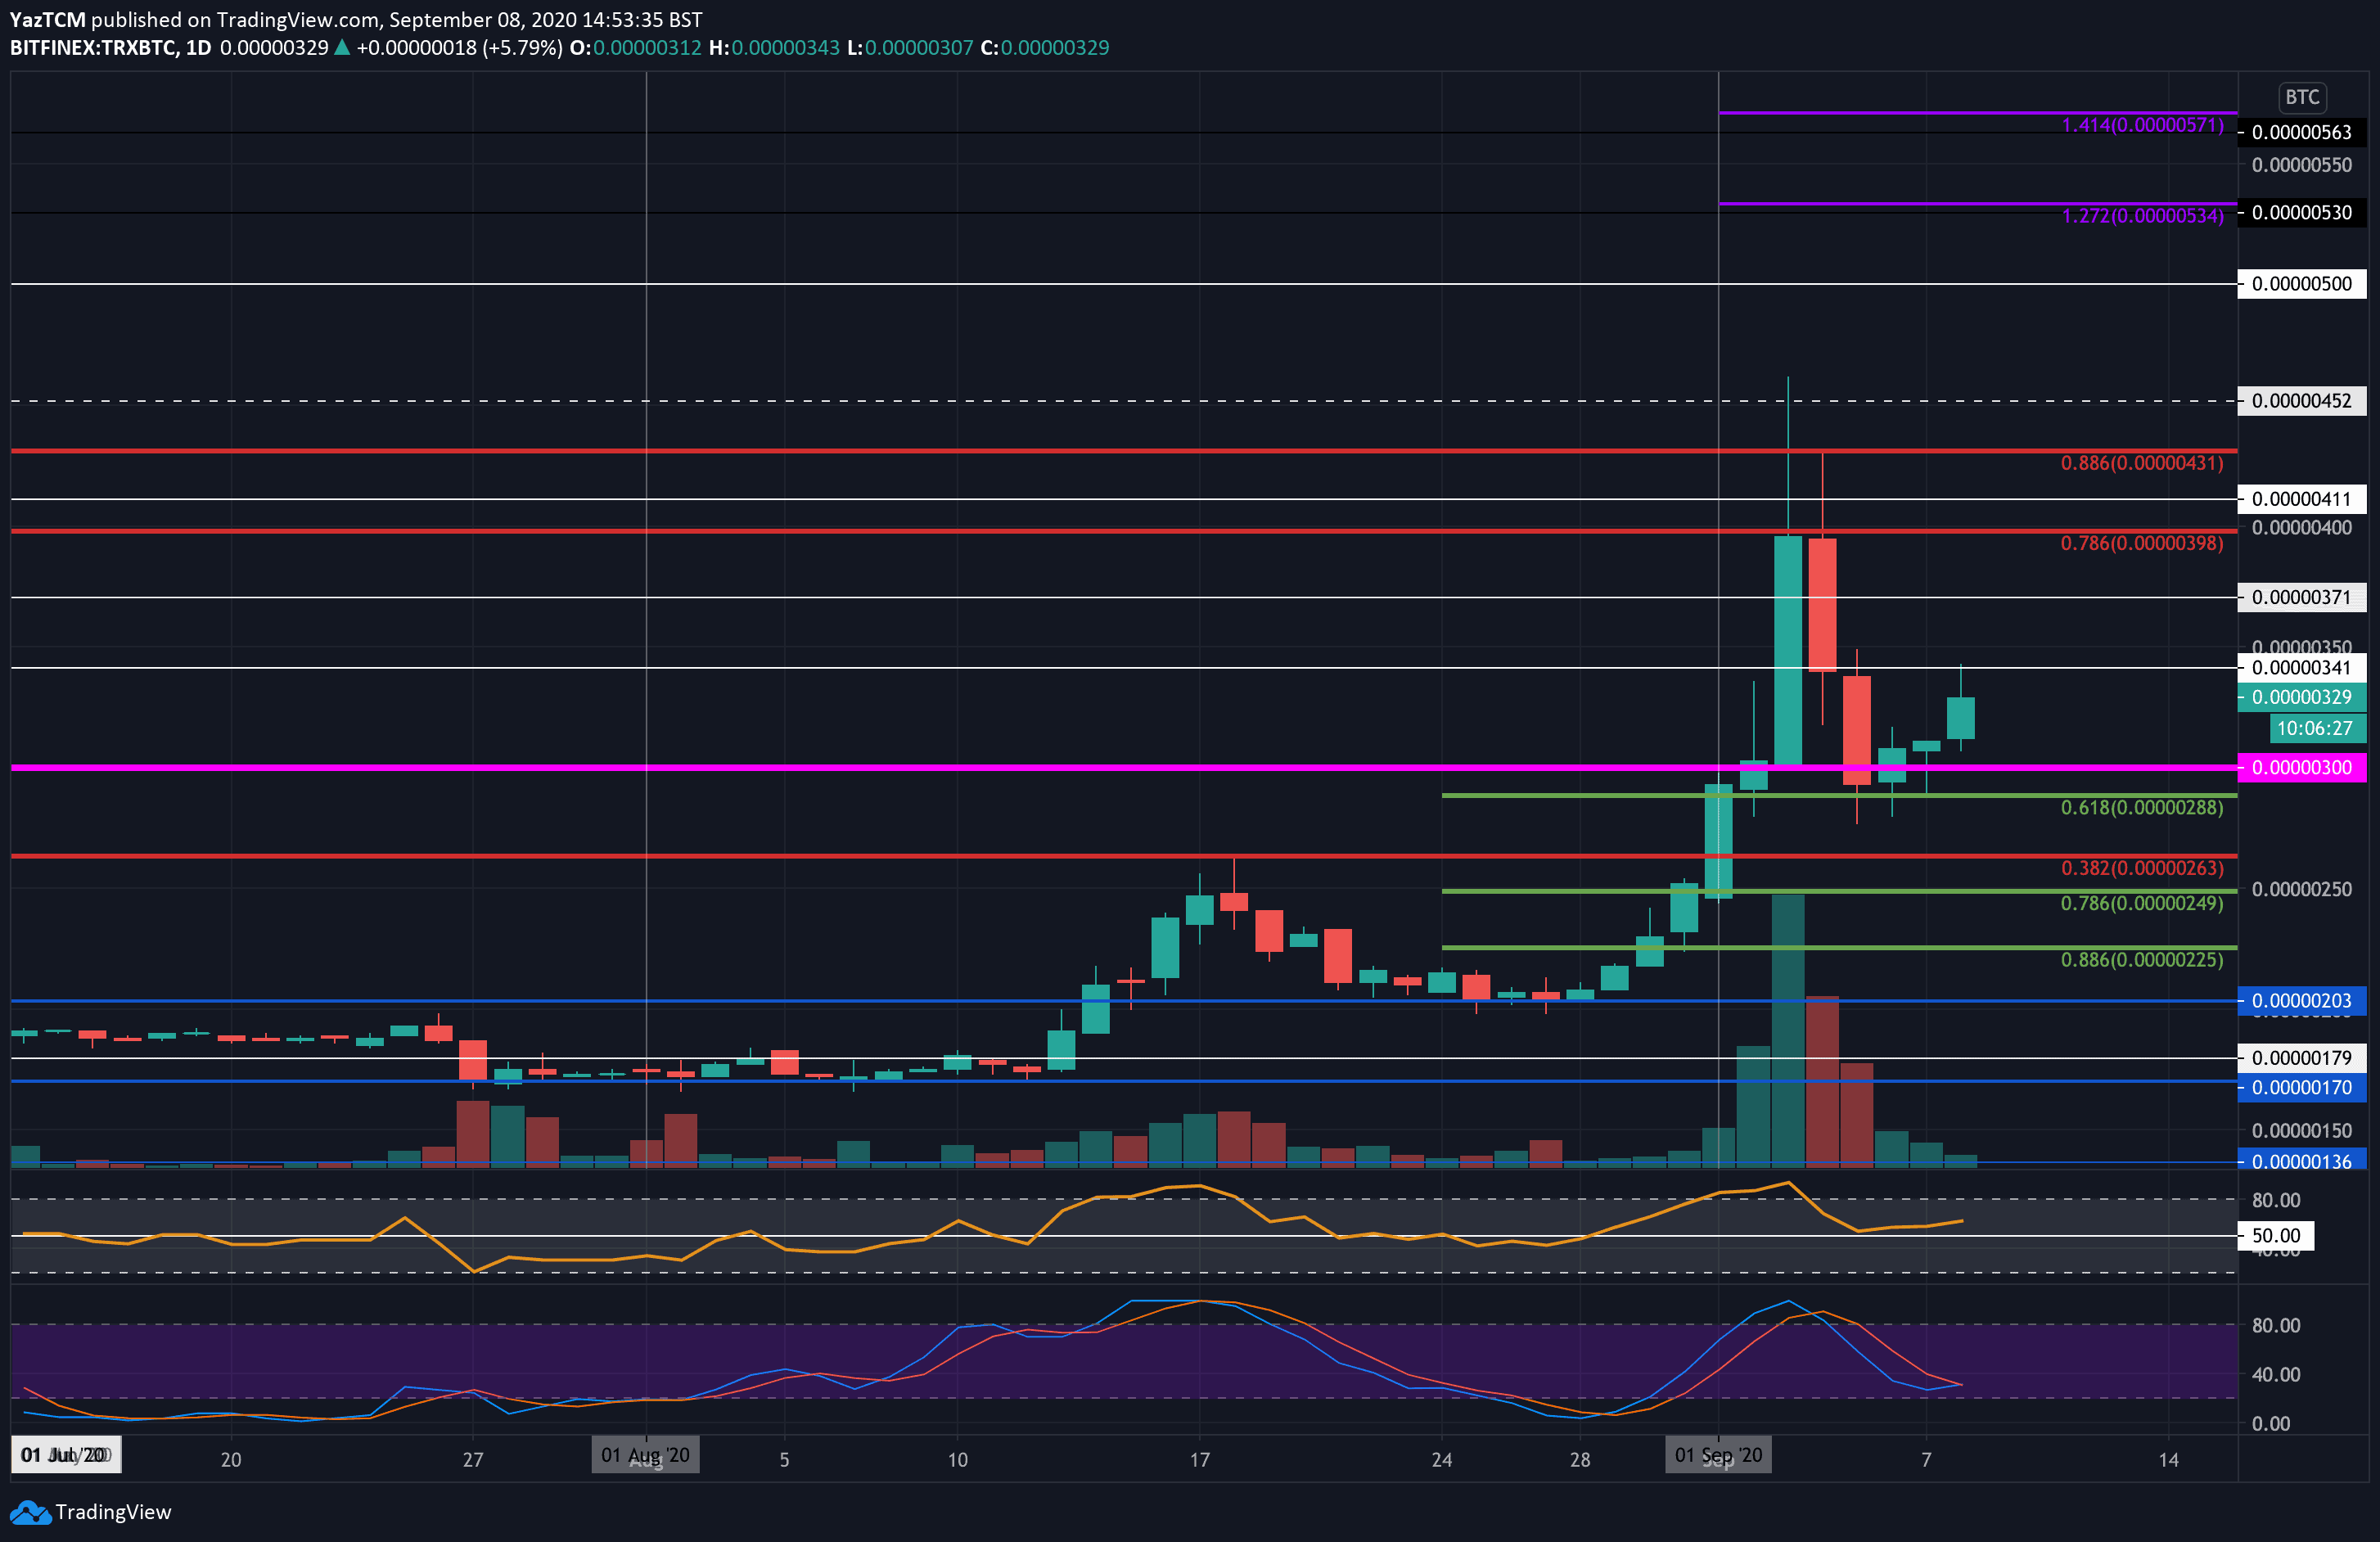
Key Support Levels: 300 SAT, 288 SAT, 250 SAT
Key Resistance Levels: 340 SAT, 370 SAT, 400 SAT.
TRX managed to surge into the resistance at 400 SAT (bearish .786 Fib Retracement) during the first few days of September. From there, it headed lower but managed to find support at 288 SAT (.618 Fib Retracement).
The coin has since bounced higher as it broke above 300 SAT to reach as high as 340 SAT today.
Looking ahead, once the bulls break 340 SAT, resistance lies at 370 SAT, 400 SAT (bearish .786 Fib Retracement), 411 SAT, and 431 SAT (bearish .886 Fib Retracement). This is followed by added resistance at 450 SAT and 500 SAT.
On the other side, support lies at 300 SAT. This is followed by support at 288 SAT, 250 SAT (.786 Fib Retracement), and 225 SAT (.886 Fib Retracement).
The bulls remain in control of the market momentum as the RSI bounces from the mid-line, and the Stochastic RSI is also primed for a bullish crossover signal.