TRX had gained 150% (Binance) during the past seven weeks. The reason for that massive move could be related to the BitTorrent upcoming ICO, which can be purchased using TRX and is based on Tron’s blockchain. The ICO is planned to start its sell on Binance Launchpad tomorrow, January 28, at 17:00.
Usually this could turn into a classic “sell the news” event, however, the bullish momentum of Tron seems unstoppable. Tron had just crossed the $2 billion market-cap mark in the 7th place of the largest cryptocurrencies by market cap.
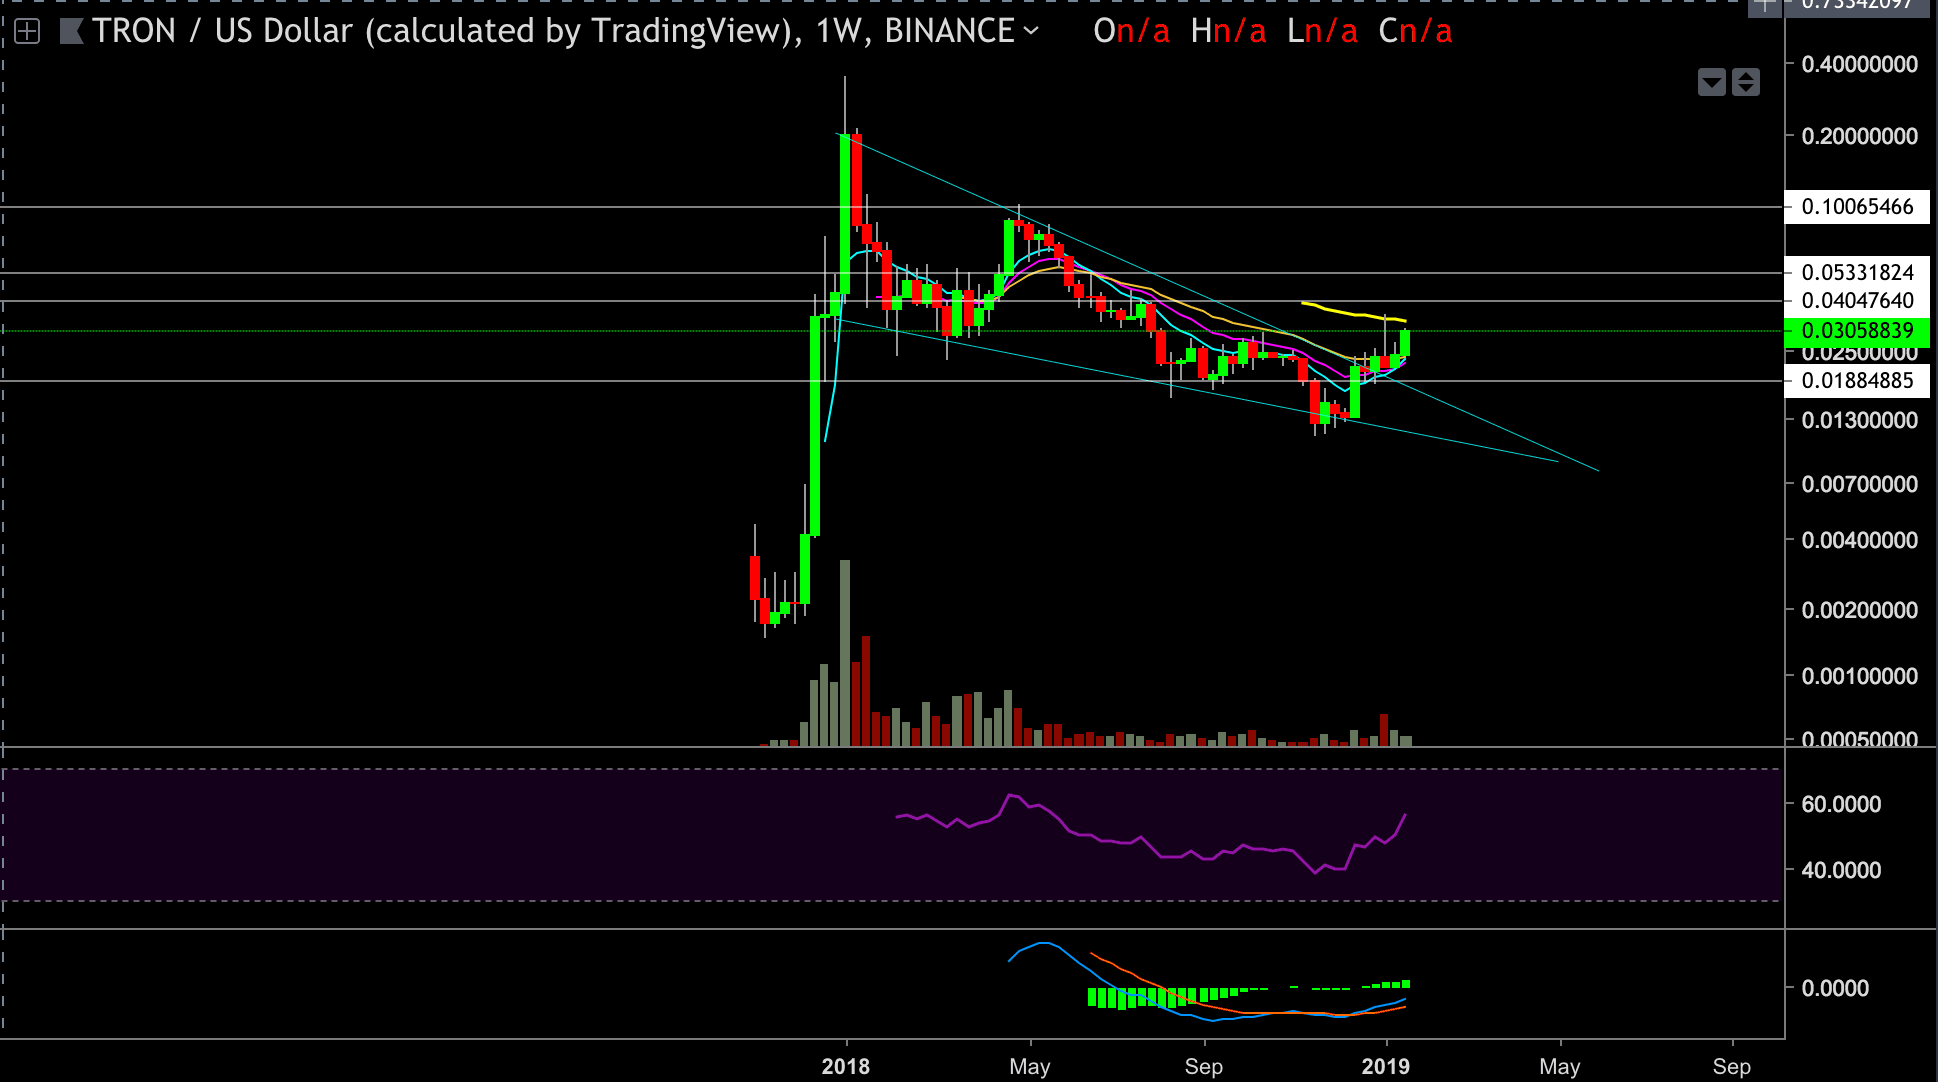
Let’s start with a quick overview of the TRX-USD weekly chat, where we can notice the bullish flag or descending trend-line that was broken up. The bullish breach above the upper trend-line is quite tempting, although it lacks some trading volume.
Tron has lost 96% of its value in the lowest point, before gaining some back, but overall is still down 91% from its all-time high price of $0.328.
Notice that the weekly chart is climbing toward the 55 EMA (yellow line) last time TRX touched that line, it got rejected quite heavily.
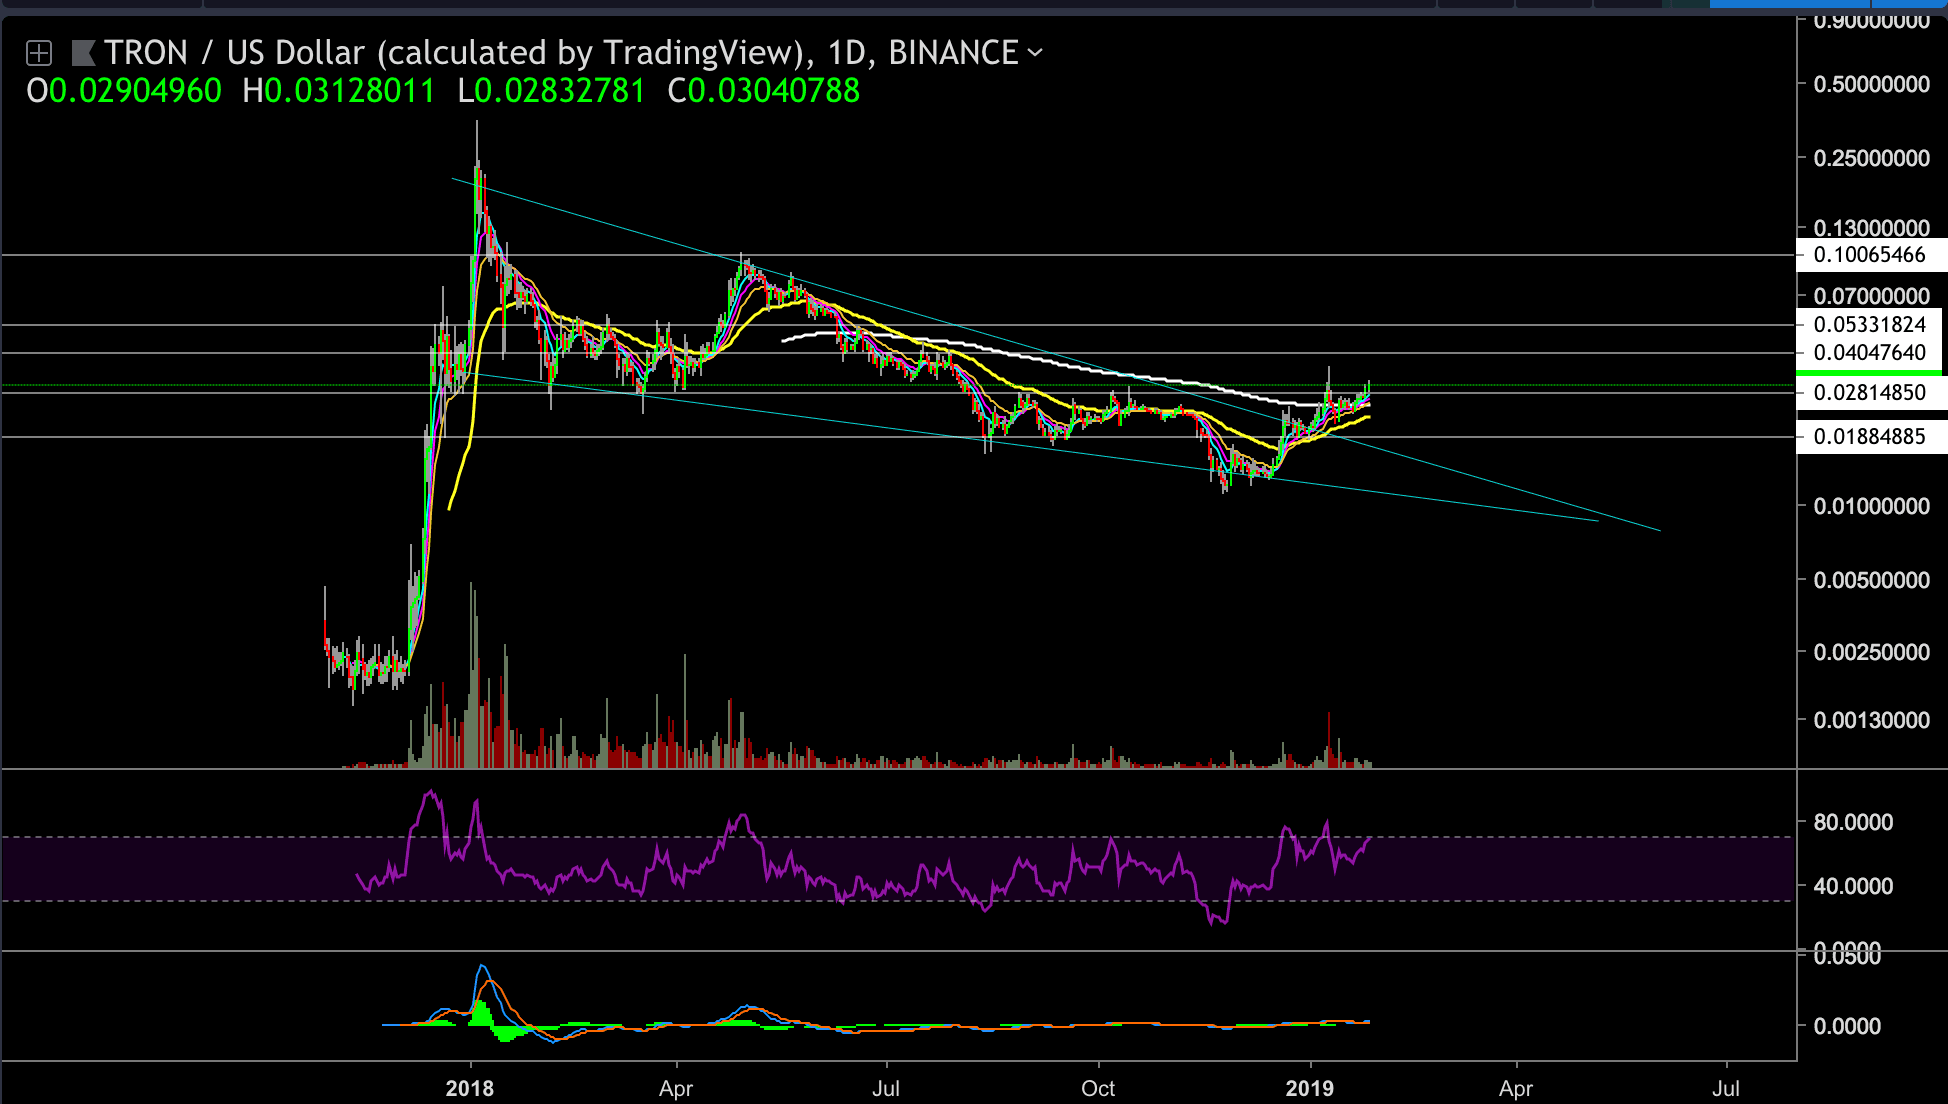
Looking at the TRX-USD Daily chart
- it is currently trading around the $0.03 price level.
- TRX chart is on its way to create the fourth higher-high since the breakout and is getting supported by all the EMA lines.
- If TRX continues this trend, we could soon see a Golden Cross over: When 55 EMA crosses above 200 EMA (the yellow above the white line) taking place on the daily chart which is a sign of strength.
- The daily RSI is approaching the overbought area (above 70) and show strength as well
- Following the breaking out of the flag formation and the possible coming-up news, TRX price could continue its bullish manner with first targets at $0.0358 and $0.0415 or higher, at the $0.0519 resistance level, which is 77% above TRX current price. This scenario must get support from a bullish Bitcoin move in order to take place and a breakout of the $0.028 support level (marketed by the white arrows on the following chart).
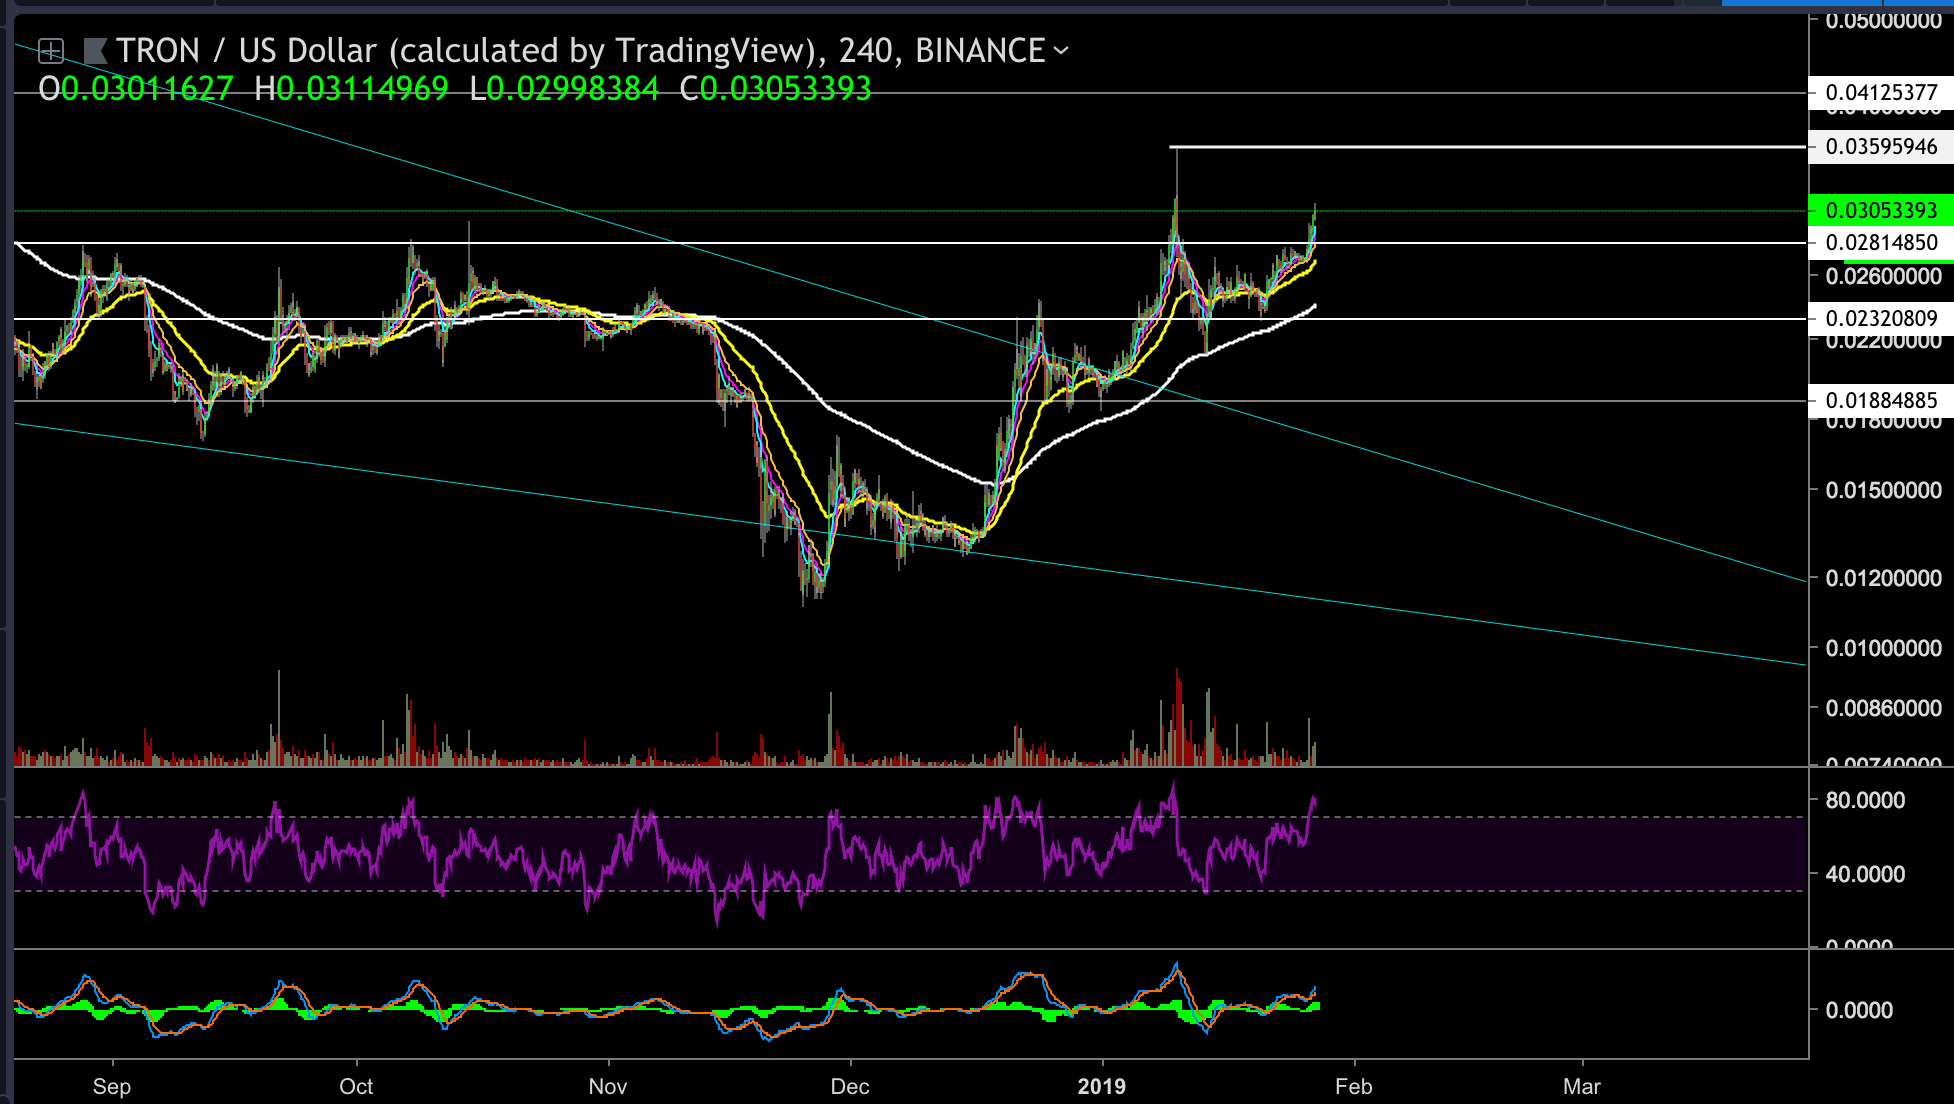
Looking at the 4-hour TRX-BTC chart
- From a closer perspective of the 4 hours chart, TRX is nicely holding above the $0.028 support level and is most likely to continue higher to retest the $0.0358 resistance level which was formed by the last long shooting star candle (marked on the following chart)
- On the other side, if TRX price breaks down, below the $0.028 support level, it might decline toward the $0.0233 support level or, in the more bearish scenario, the $0.019 support level.
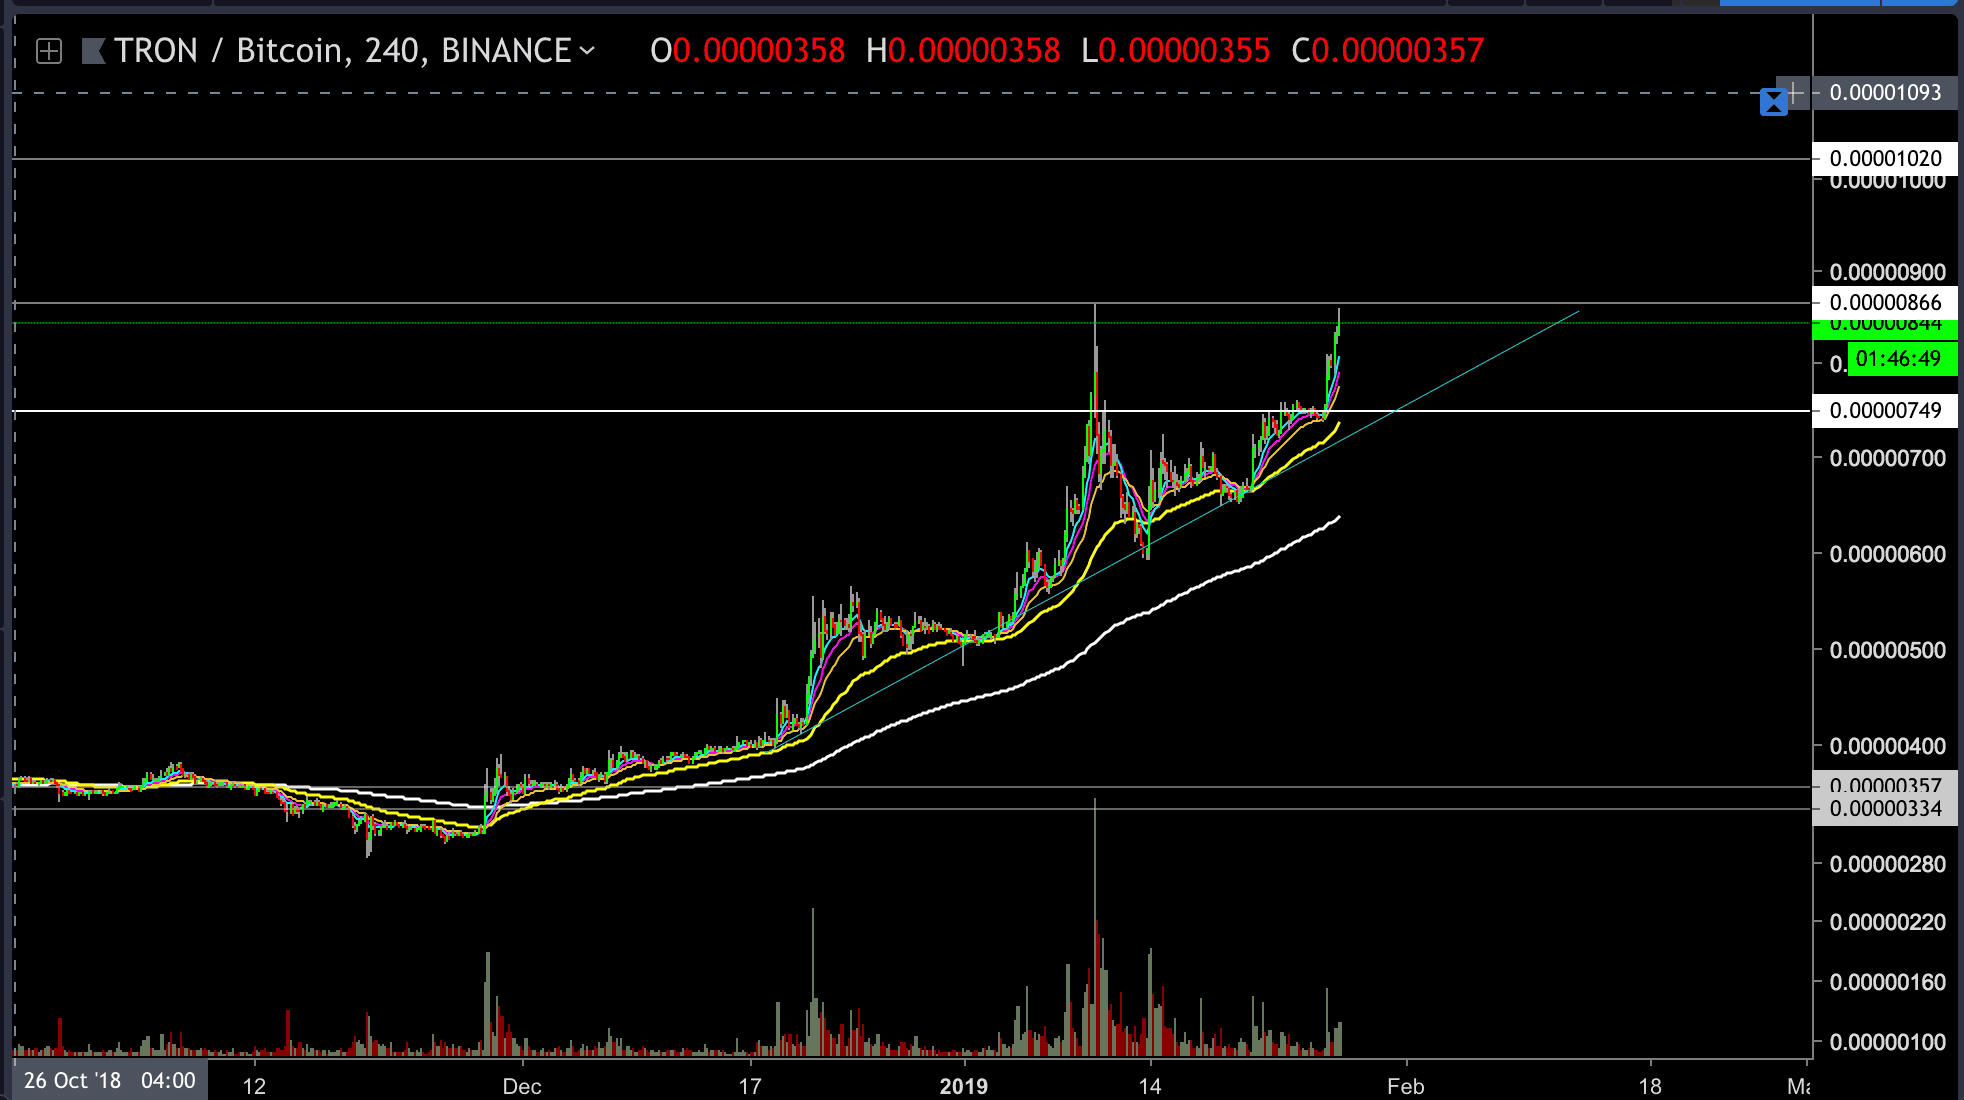
Looking at The 4-hour TRX-BTC chart
- Price is on its way to re-test the resistance level of 867 SAT. There, it might get rejected on its first attempt to break up. In that case, TRX could retest the 0.746 SAT support level where the 55 EMA is currently awaiting
- From the bullish side, in case the above resistance level gets breached on the first try then the next target could be found at the 1024 SAT.