Tron has seen a 7.35% price surge over the past 24 hours of trading, allowing the cryptocurrency to climb to a high of around $0.039. The price surge comes after Justin Sun, the CEO of Tron, tweeted that he has a big announcement upcoming on June 3rd;
Justin Sun had stated that the reveal would be “big win” for the entire blockchain community which has many users speculating as to what the announcement could be. Although unconfirmed, some have suggested it could be the upcoming BitTorrent Fiel System (BTFS) protocol which will allow users to receive and host storage with other individuals.
Tron is now ranked in the 11th place amongst the top cryptocurrencies by market cap as it presently holds a $2.60 billion market cap. Tron is now only sitting $30 million behind the 10th place position holder, Stellar (XLM).
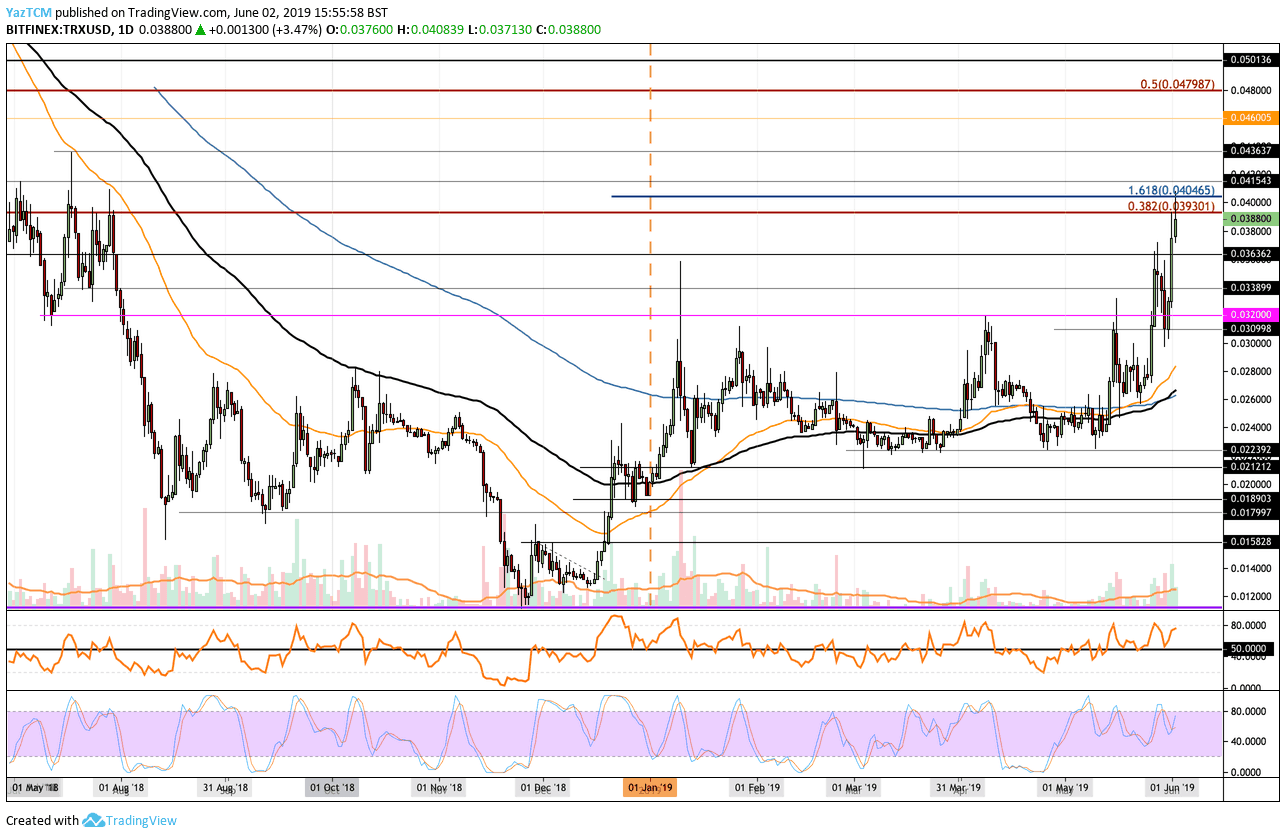
Looking at the TRX/USD 1-Day Chart:
- Against the US Dollar, Tron has now managed to create a fresh 2019 high above $0.036 and has even reached the $0.040 level before falling slightly. This has now created a new 11 month high for the cryptocurrency. We can see that Tron has now reached a resistance level of a long term bearish .382 Fibonacci Retracement around $0.03930.
- From above: The nearest level of resistance lies between $0.03930 and $0.04040. Above $0.041, higher resistance lies at $0.04363, $0.046, and $0.048. If the bulls climb above $0.048, higher resistance is then located at $0.050.
- From below: The nearest level of support lies at $0.038. Beneath this, further support lies at $0.03636, $0.03390 and $0.032. Below, further support lies at $0.03099, $0.030, and $0.028.
- The trading volume has recently surged higher after the interest sparked following Sun’s tweet.
- The RSI has also recently rebounded from the 50 level to show that the bulls remain in control of the market momentum.
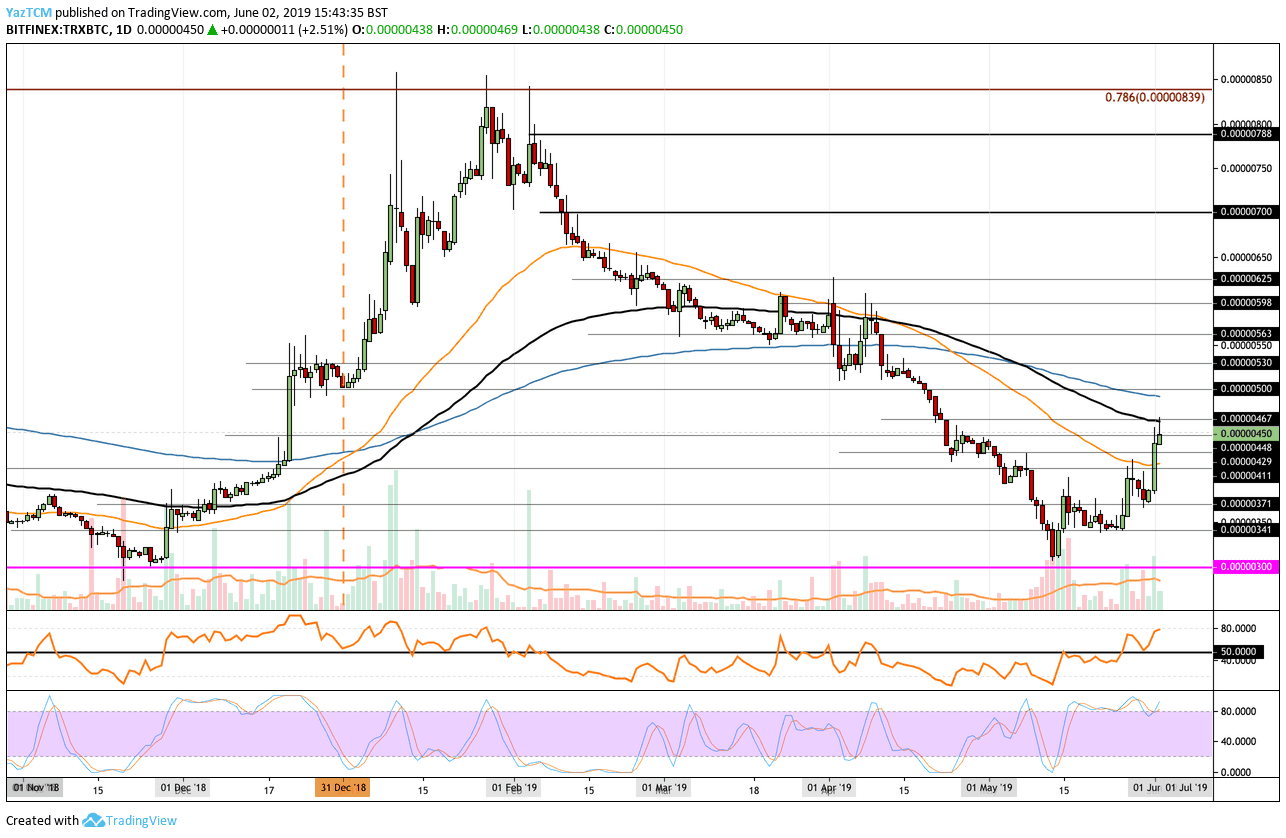
Looking at the TRX/BTC 1-Day Chart:
- Against Bitcoin, Tron has recently rebounded around the 310 SAT level to reach the 450 SAT level. We can see that TRX/BTC had risen into resistance around the 100-days EMA before falling slightly.
- From above: The nearest level of resistance now lies around 470 SAT where lies the 100-days EMA. Higher resistance lies at 500 SAT, 530 SAT, 563 SAT, and 625 SAT. IF the bulls continue higher, further resistance lies at 700 SAT, 750 SAT and 788 SAT.
- From below: The nearest level of support now lies at 430 SAT. Beneath this, support lies at 411 SAT and 400 SAT. Below, further support lies at 371 SAT, 341 SAT, and 310 SAT.
- The Stochastic RSI is currently trading in overbought conditions which could lead a correction soon.
SPECIAL OFFER (Sponsored)
Binance Free $600 (CryptoPotato Exclusive): Use this link to register new account and receive $600 exclusive welcome offer on Binance (
full details).
LIMITED OFFER 2024 for CryptoPotato readers at Bybit: Use this link to register and open a $500 BTC-USDT position on Bybit Exchange for free!
Disclaimer: Information found on CryptoPotato is those of writers quoted. It does not represent the opinions of CryptoPotato on whether to buy, sell, or hold any investments. You are advised to conduct your own research before making any investment decisions. Use provided information at your own risk. See Disclaimer for more information.
Cryptocurrency charts by TradingView.