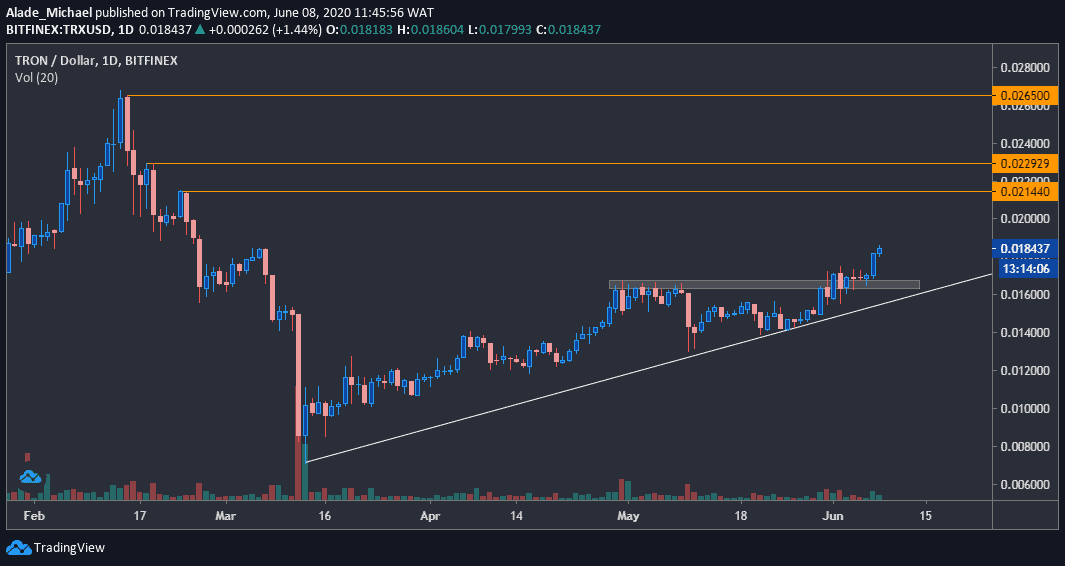
Key Resistance Levels: $0.0214, $0.0227, $0.0265
Key Support Levels: $0.0167, $0.014, $0.012
Following Tron’s recovery from the $0.008 low in March, the price reached a two-month high of $0.0162 and consolidated for ten days before correcting down to the white ascending line, where it regained momentum in May.
After that, Tron struggled under the $0.017 level for days before it finally saw a breakthrough to $0.018 following an 8% increase amidst yesterday’s drops in the entire crypto space.
It’s worth noting, however, that the increase comes immediately after Justin Sun took it to Twitter to announce the upcoming launch of TRON 4.0 that’s scheduled to take place on July 7th. Among other things, the new protocol will reportedly be the first where zk-SNARKs will be implemented on a blockchain, powered by smart contracts.
Today, the 16th largest cryptocurrency by market cap gained 6.78% to where it is currently facing March’s resistance at around $0.01849 level. If it successfully surpasses this level, more positive moves can be anticipated towards the previous monthly resistance in the next couple of weeks.
Above $0.0185, the next significant move should be expected towards the first orange-marked lines at $0.0214 in the coming days. The next to watch after this resistance is $0.0227, followed by $0.0265, printed as the yearly high in February.
If the price is to pull back, the level to consider is $0.017, but the major area for a rebound is located at the grey demand zone of $0.0168, around the white ascending trend line. The psychological support to watch below this area is $0.014 and $0.012.
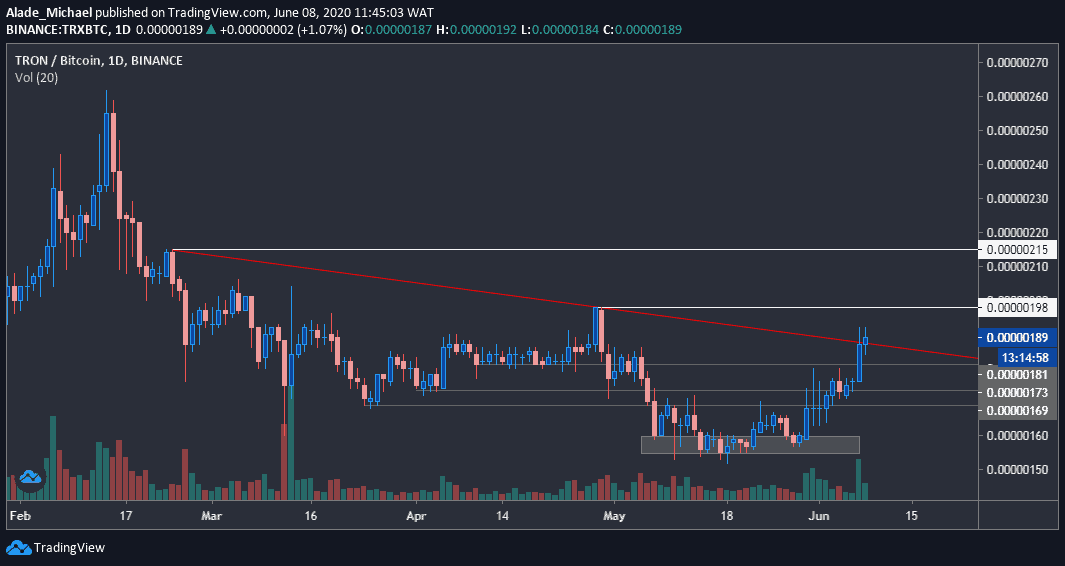
Key Resistance Levels: 198 SAT, 215 SAT
Key Support Levels: 170 SAT, 150 SAT
Against Bitcoin, Tron gained almost 30% in 10 days to reach 192 SAT yesterday after establishing base support around 150 SAT in May. Meanwhile, this price increase was followed by a slight break above the red trend line, serving as diagonal resistance over the past three months now.
To consider this breakout valid for mid-term bullishness, TRX needs to push well above this red line, especially above the psychological level of 200 SAT. Looking at the bigger picture, it is setting a strong bullish tone on the daily chart, but it may provide a small discount to the grey lines before the volatility expands upward.
The price touched 192 SAT earlier today but now dropped to where it is currently changing hands around the 190 SAT level following a 6% increase over the last 24-hours.
The first resistance to keep in mind is the white horizontal line of 198 SAT if the price increases above the red regression line. Resistance after this can be located at 215 SAT before advancing higher to the February’s high of 260 SAT on a mid-term perspective.
Towards the downsides, Tron is holding a lot of supports. The critical level to keep in mind is 170 SAT in case of a drop. As said above, the base support is located at around 150 SAT – the grey demand area on the chart.
Tron is considered bullish in the short-term following the latest increase in trading volume and volatility.