By Shayan
Bitcoin’s recent price movement indicates a struggle between sellers and buyers around the significant $35K resistance area, resulting in consolidation with slight volatility. However, a bullish breakout at this level holds the potential for a substantial uptrend.
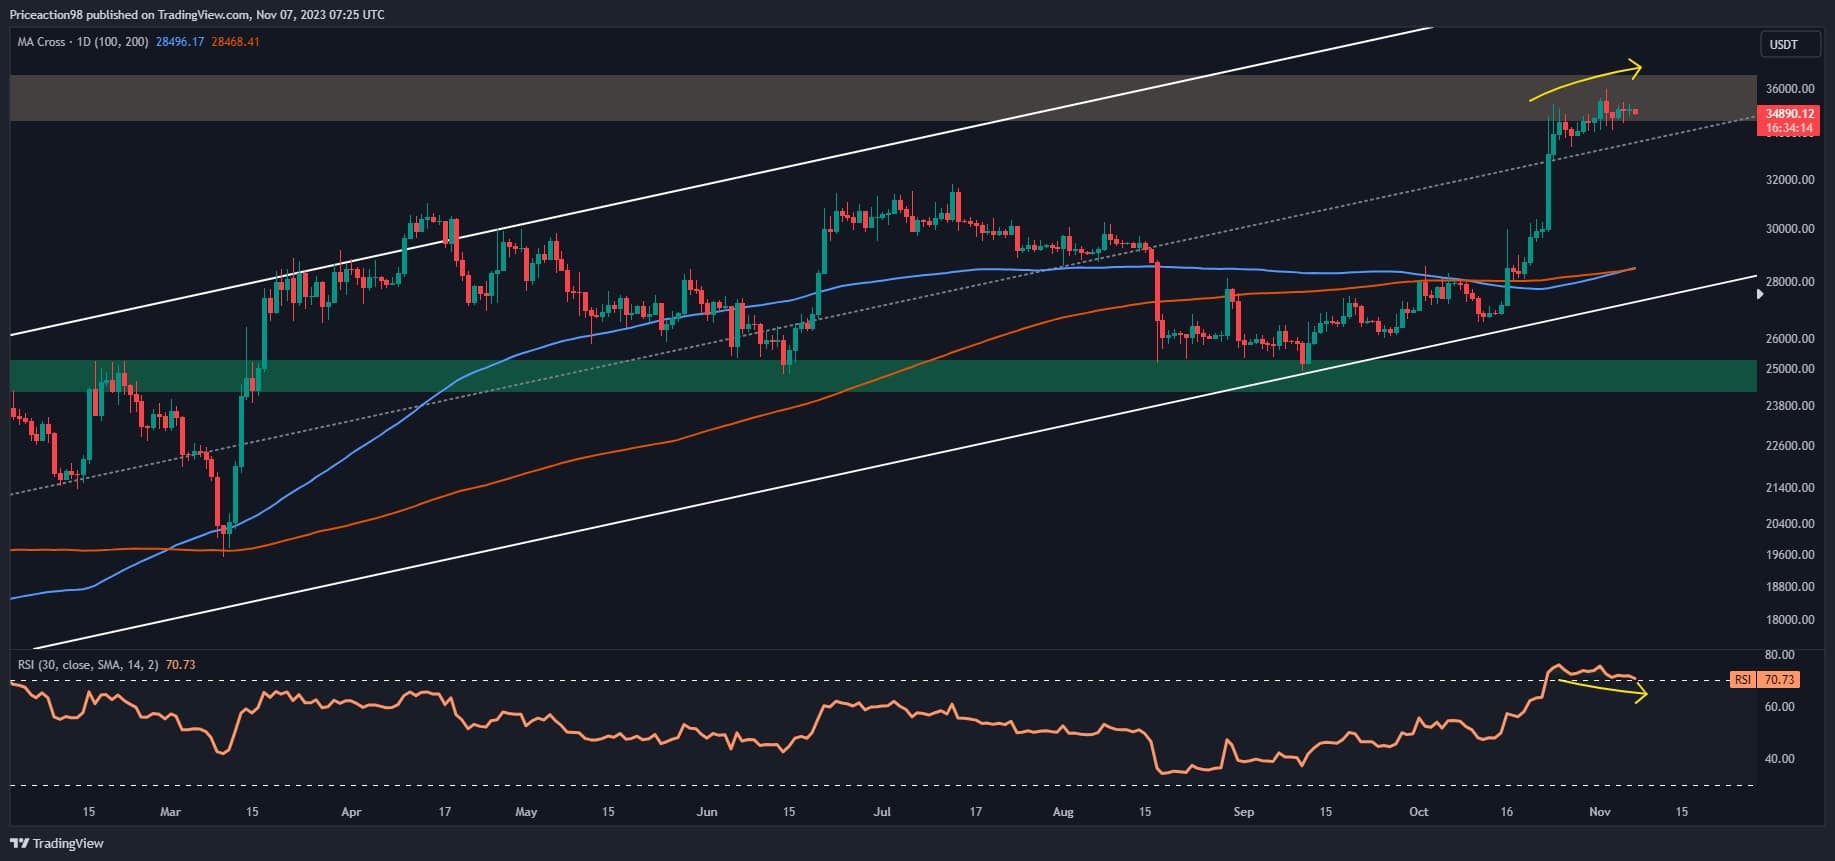
Upon analyzing the daily chart, Bitcoin has maintained a noticeable uptrend since the beginning of 2023, trending in an ascending channel pattern. The price recently reached the critical resistance at $35K, showcasing prevailing buying pressure and suggesting a potential bullish market.
However, encountering strong selling pressure at this resistance zone led to a period of sideways consolidation. The bearish divergence between the RSI indicator and the price confirms seller presence, indicating a decrease in bullish momentum. If buyers successfully secure this pivotal level, it could pave the way for a positive mid-term trend, potentially targeting higher resistance zones.
However, considering the bearish divergence, a consolidation correction phase with minor retracements remains likely. In this scenario, the middle boundary of the ascending channel would be the initial support for buyers.
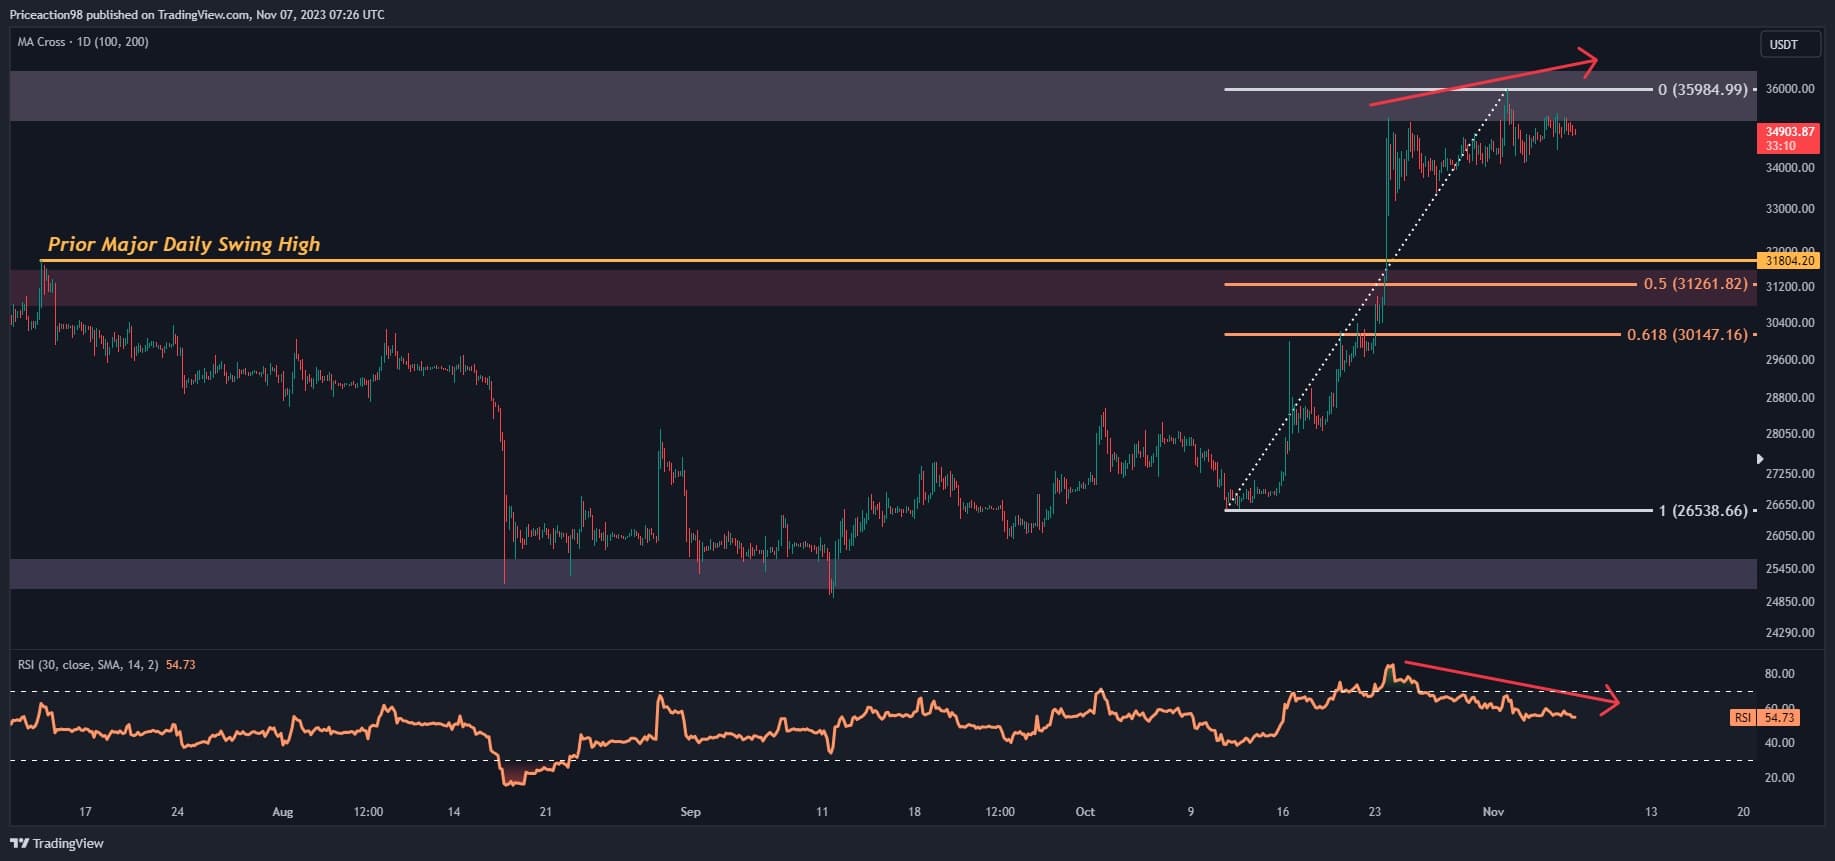
On the 4-hour chart, Bitcoin has surpassed its previous significant daily swing high at approximately $31,800, sustaining a strong upward momentum. The price aimed to overcome the decisive resistance at $35K, emphasizing the prevailing market demand. However, upon reaching this resistance, the price faced rejection, leading to sideways consolidation.
Nevertheless, existing supply and selling pressure has momentarily slowed down the upward movement, triggering a corrective phase. On the other hand, the emergence of a bearish divergence between the price and the RSI indicator also indicates the possibility of a short-term retracement.
If sellers outpace buyers, key support levels for Bitcoin would be the 0.5 Fibonacci retracement level at $31,200 and the previous swing high at $31,800. Conversely, if demand surpasses supply, an imminent breakout leading to a robust price surge becomes likely.
By Shayan
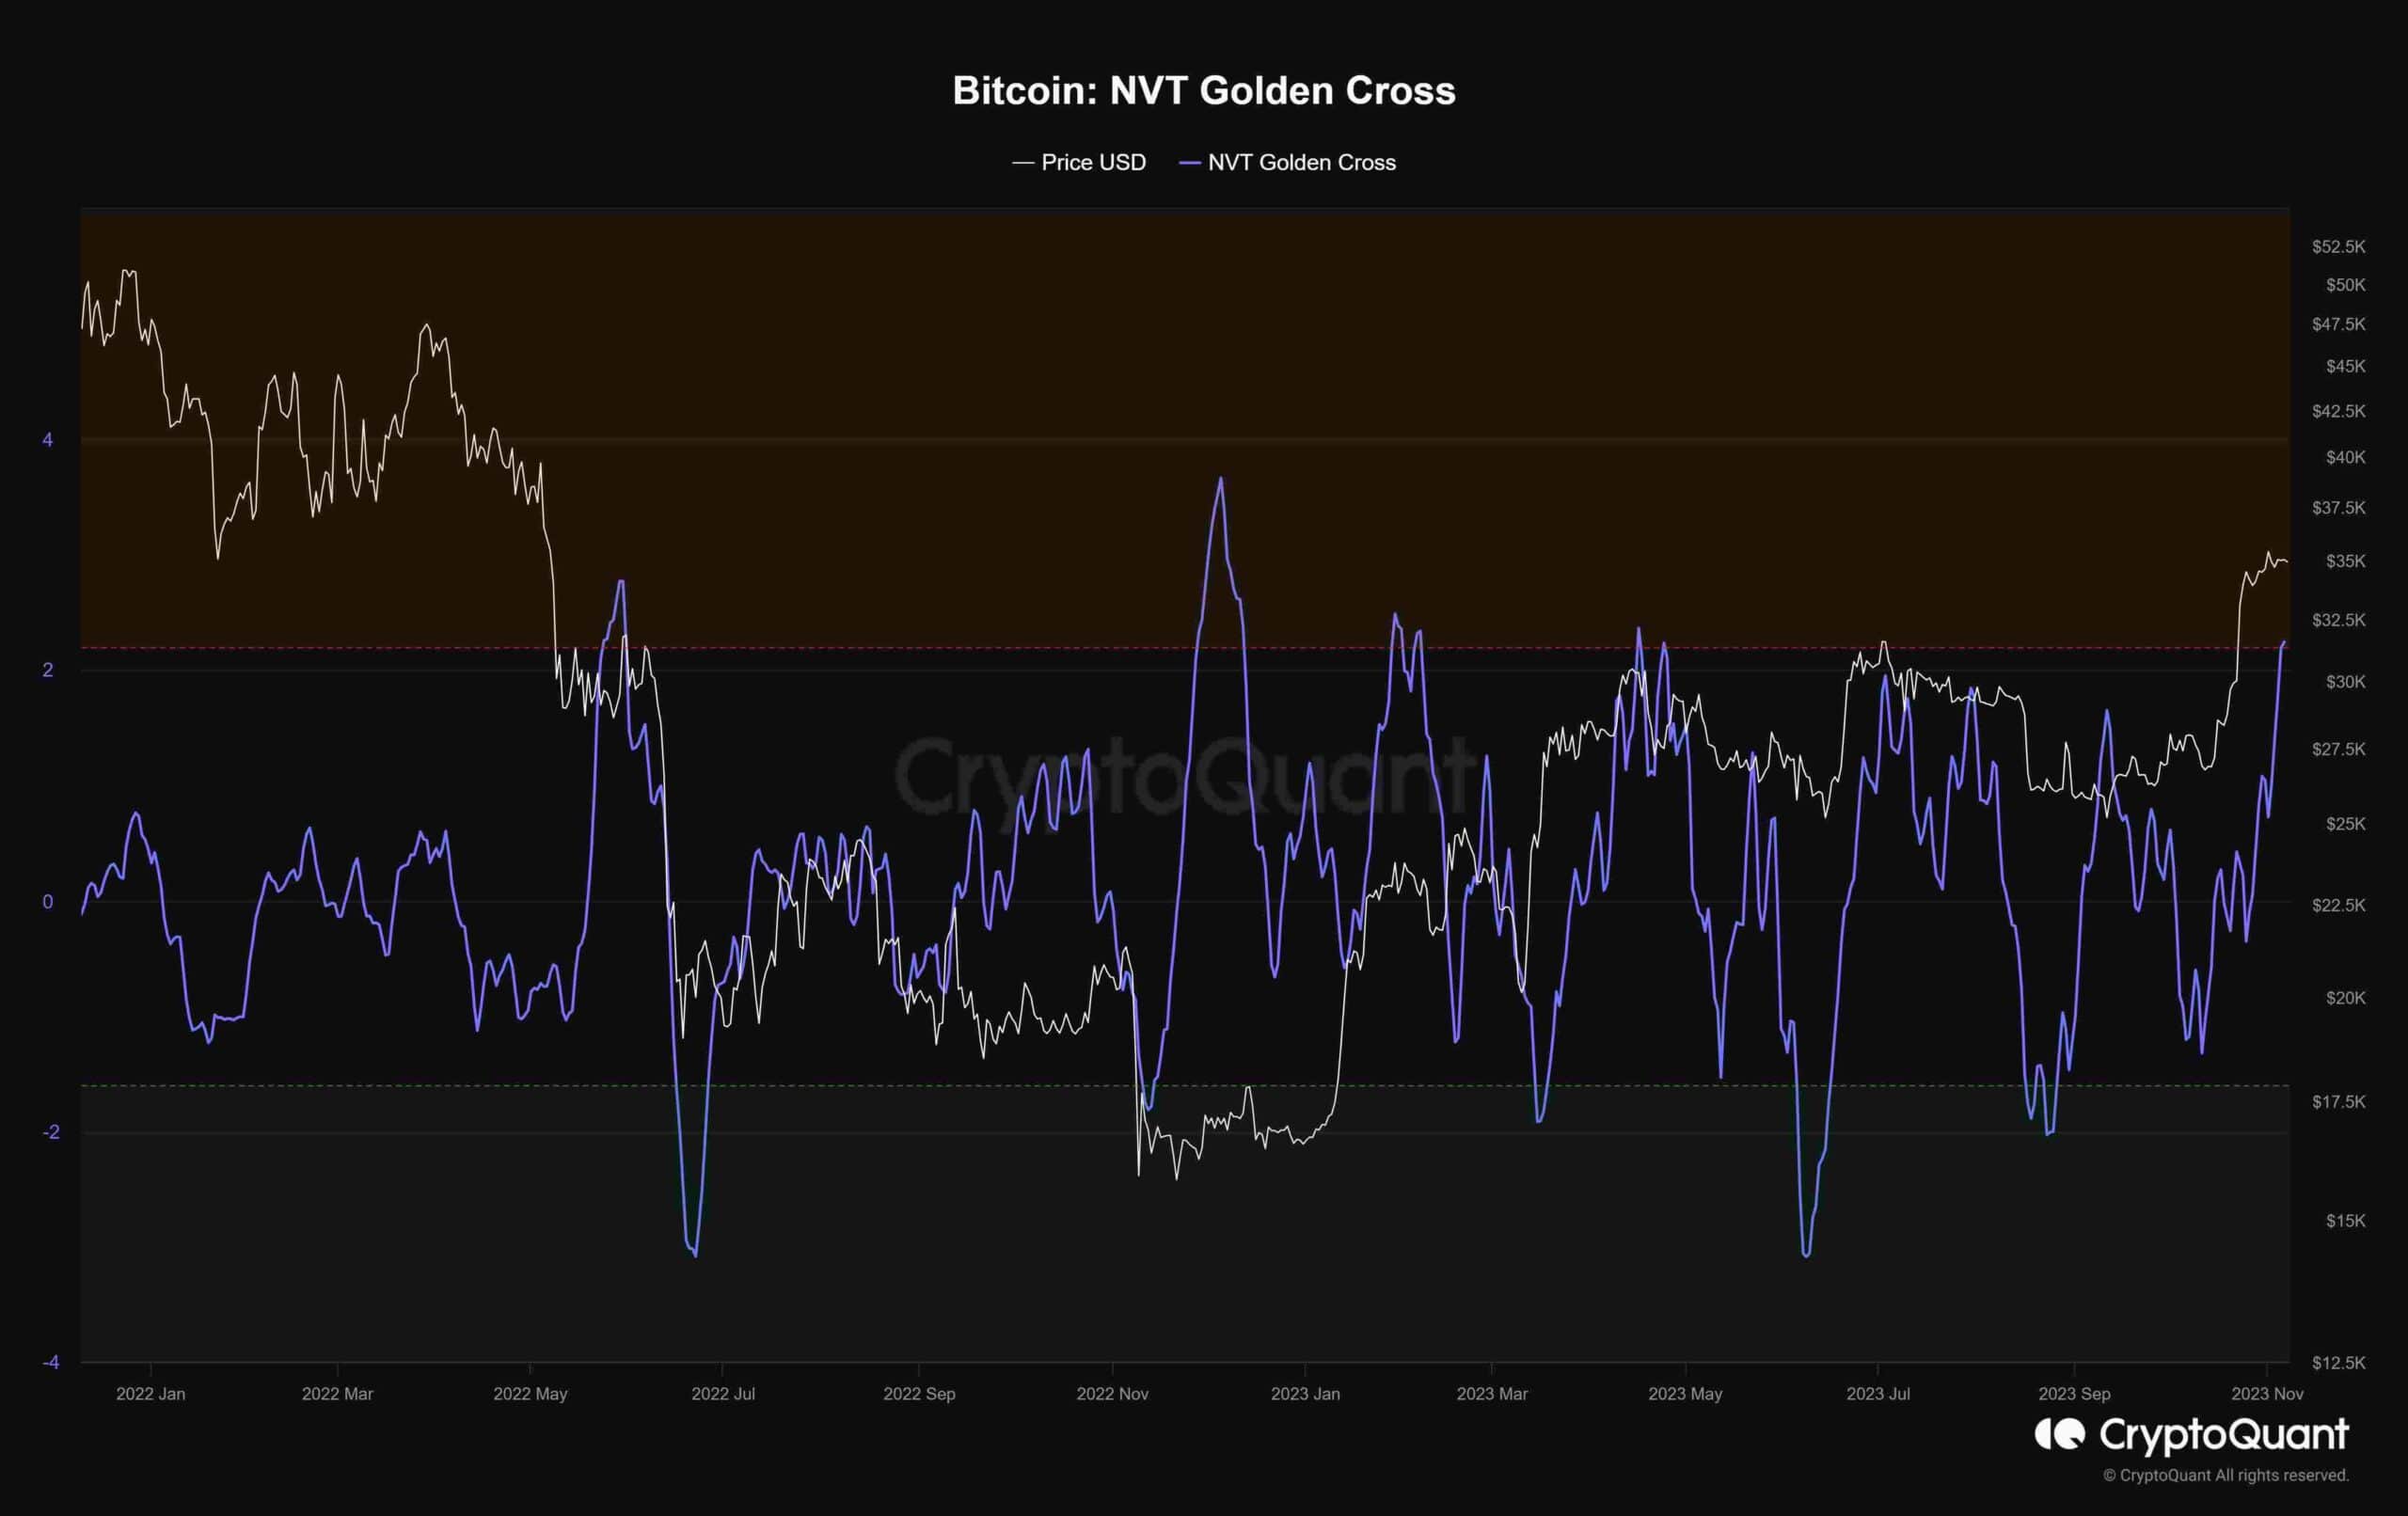
The NVT (Network Value to Transaction) golden cross metric serves as a crucial indicator, calculated by dividing a coin’s market capitalization by the total BTC Onchain Transaction Volume (USD). When the market capitalization significantly exceeds the on-chain BTC transactions, it suggests overvaluation (2.2), and conversely, if it is considerably lower, it implies undervaluation (-1.6).
Presently, the indicator stands at 2.245, indicating that the current BTC market capitalization is in an overvalued state. However, historical trends have shown that during recovery phases, BTC prices often rise alongside increasing market capitalization, leading to further price boosts and a transition to a bull market.
Given this pattern, it seems more reasonable to consider the potential shift to a bull market in the future rather than interpreting the overheating signal from the NVT golden cross indicator as a reason to worry.
Furthermore, it is crucial to focus on accumulation signals when the indicator dips below -1.6, signifying oversold conditions. Historical data has demonstrated that the NVT golden cross indicator’s oversold areas have presented excellent buying opportunities during recovery and bull markets.