It has been quite some time since Bitcoin formed a great daily candle in either direction. The market is going through a steady range phase with extremely low volatility. However, many technical indicators signal that a potentially significant move is approaching for this cryptocurrency.
By Shayan
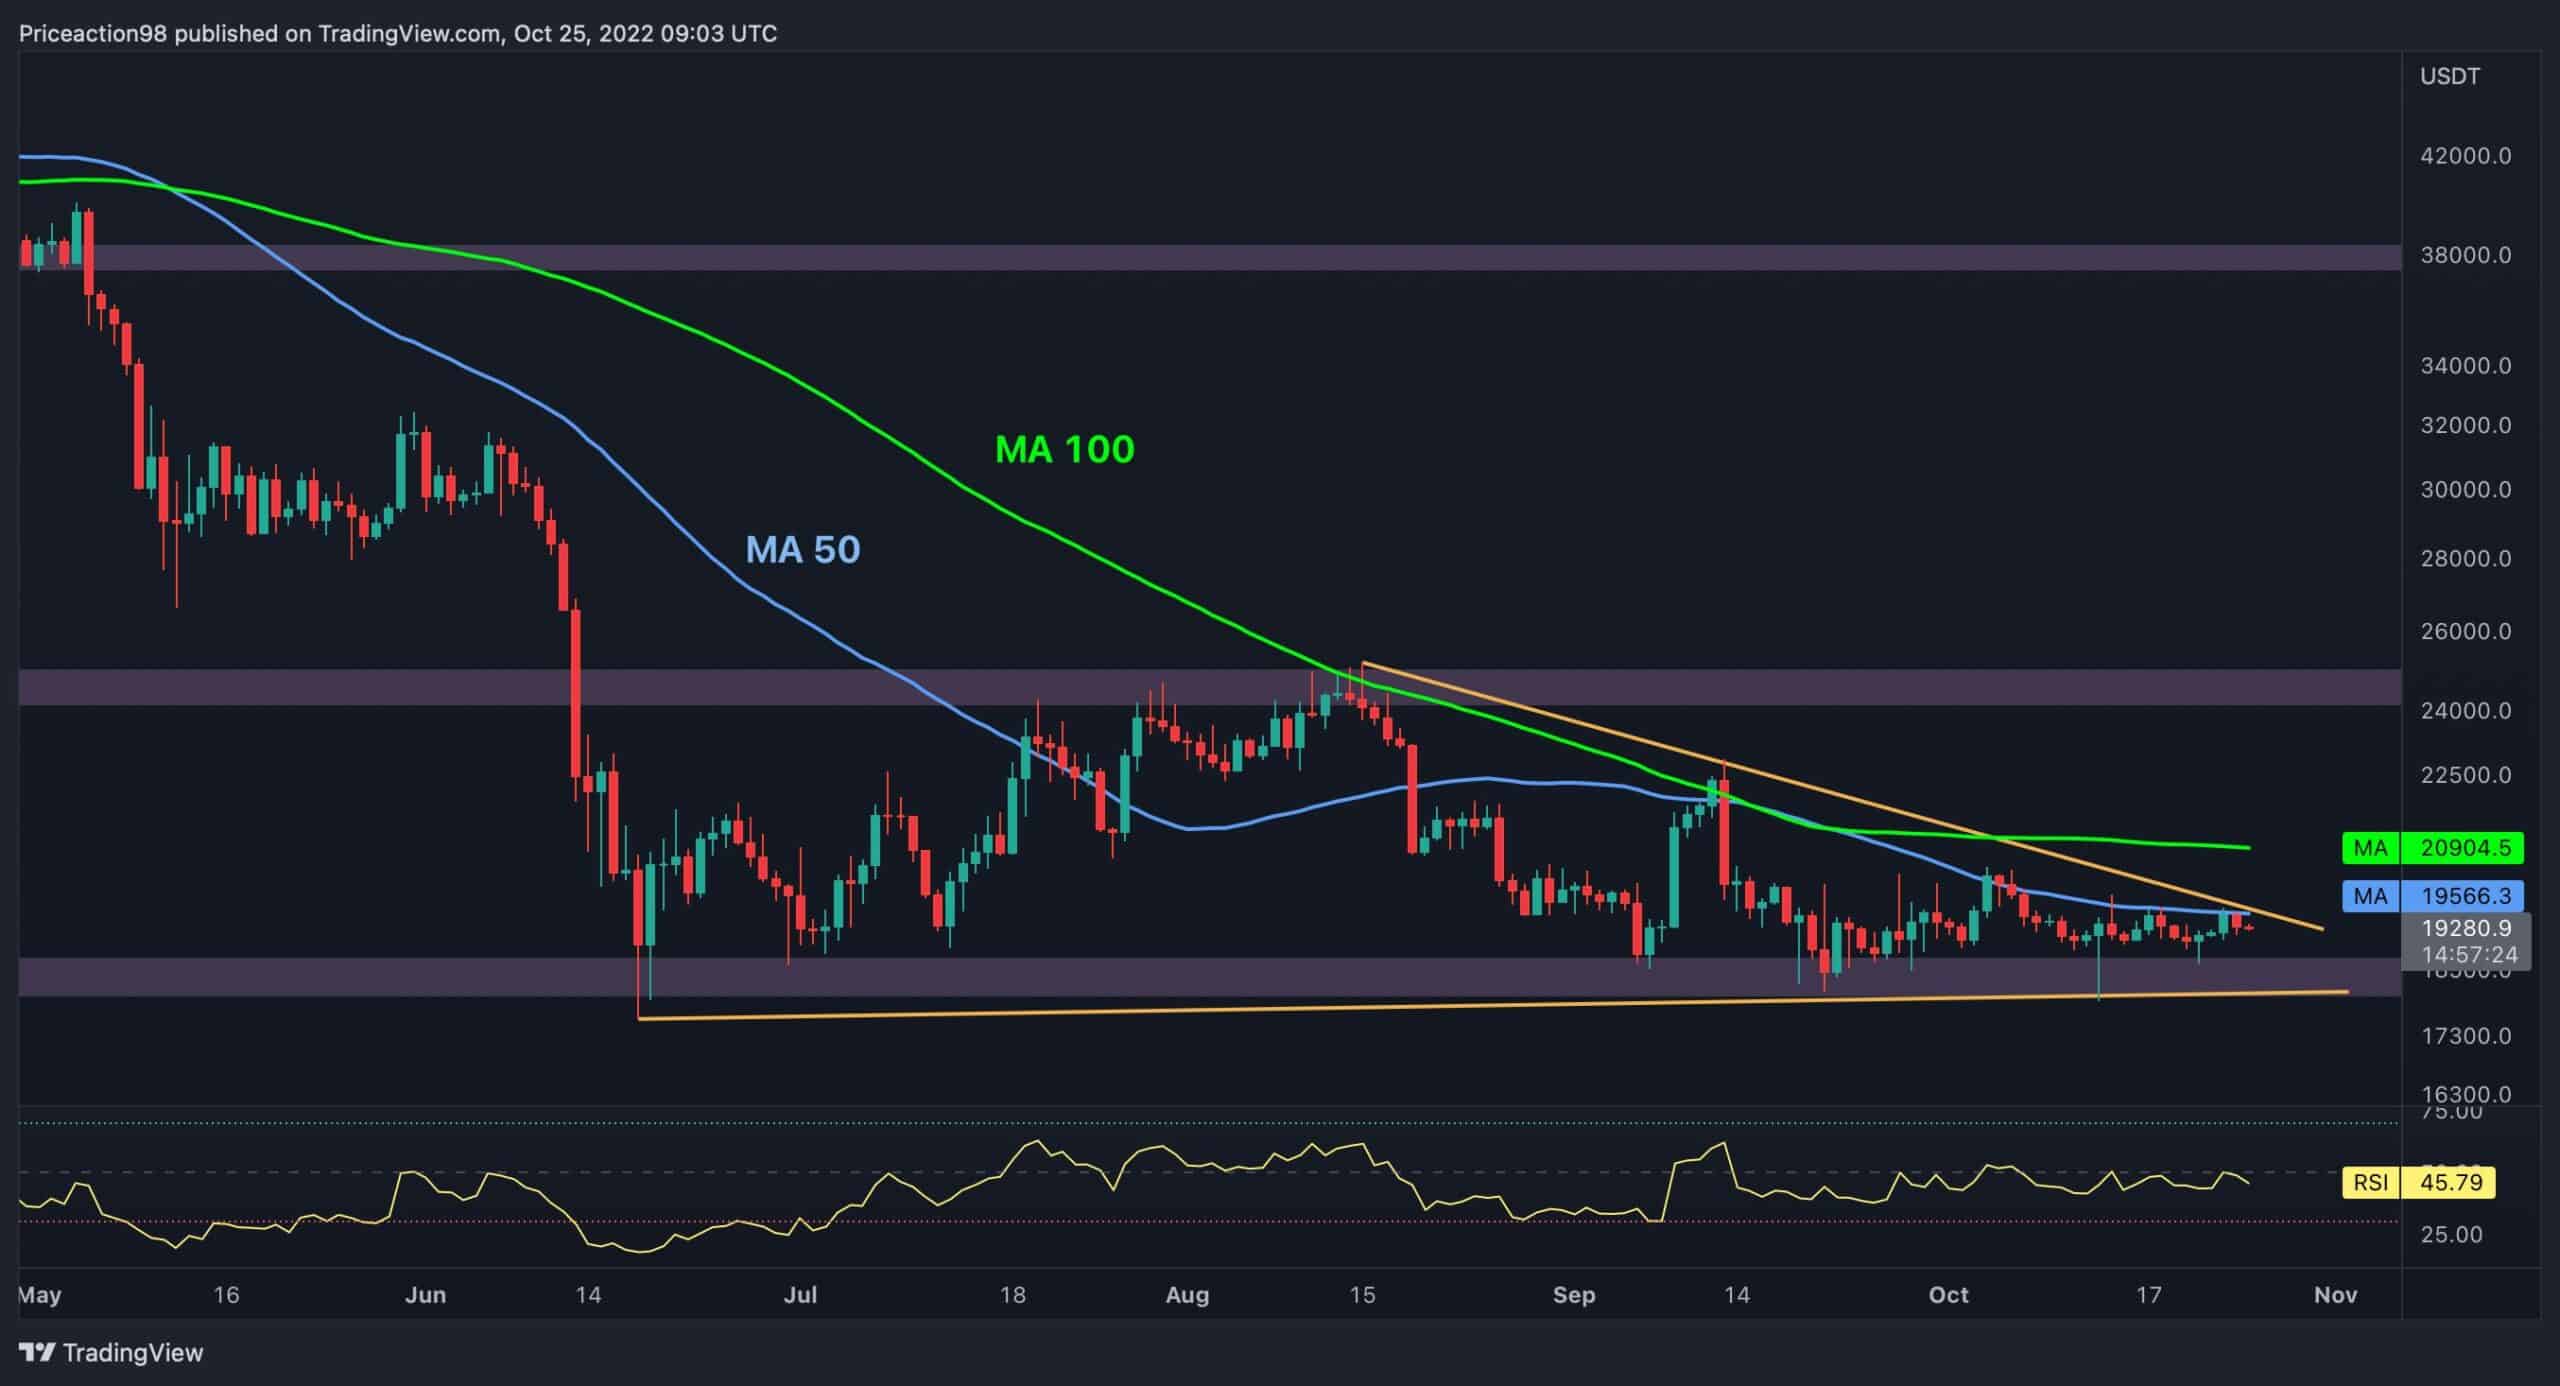
Bitcoin’s price action has been offering extremely low volatility and uncertainty for the last several months. Meanwhile, the price has formed a triangle pattern within the daily timeframe.
The price presently faces two critical resistances; the 50-day moving average and the triangle’s upper boundary, which aligns at the $19.5K level. The cryptocurrency must surpass these two crucial resistances in order to regain investors’ trust and print a bullish expansion move toward the $25K significant resistance.
Contrarily, if Bitcoin gets rejected at this level, the $16K support region may be inevitable.
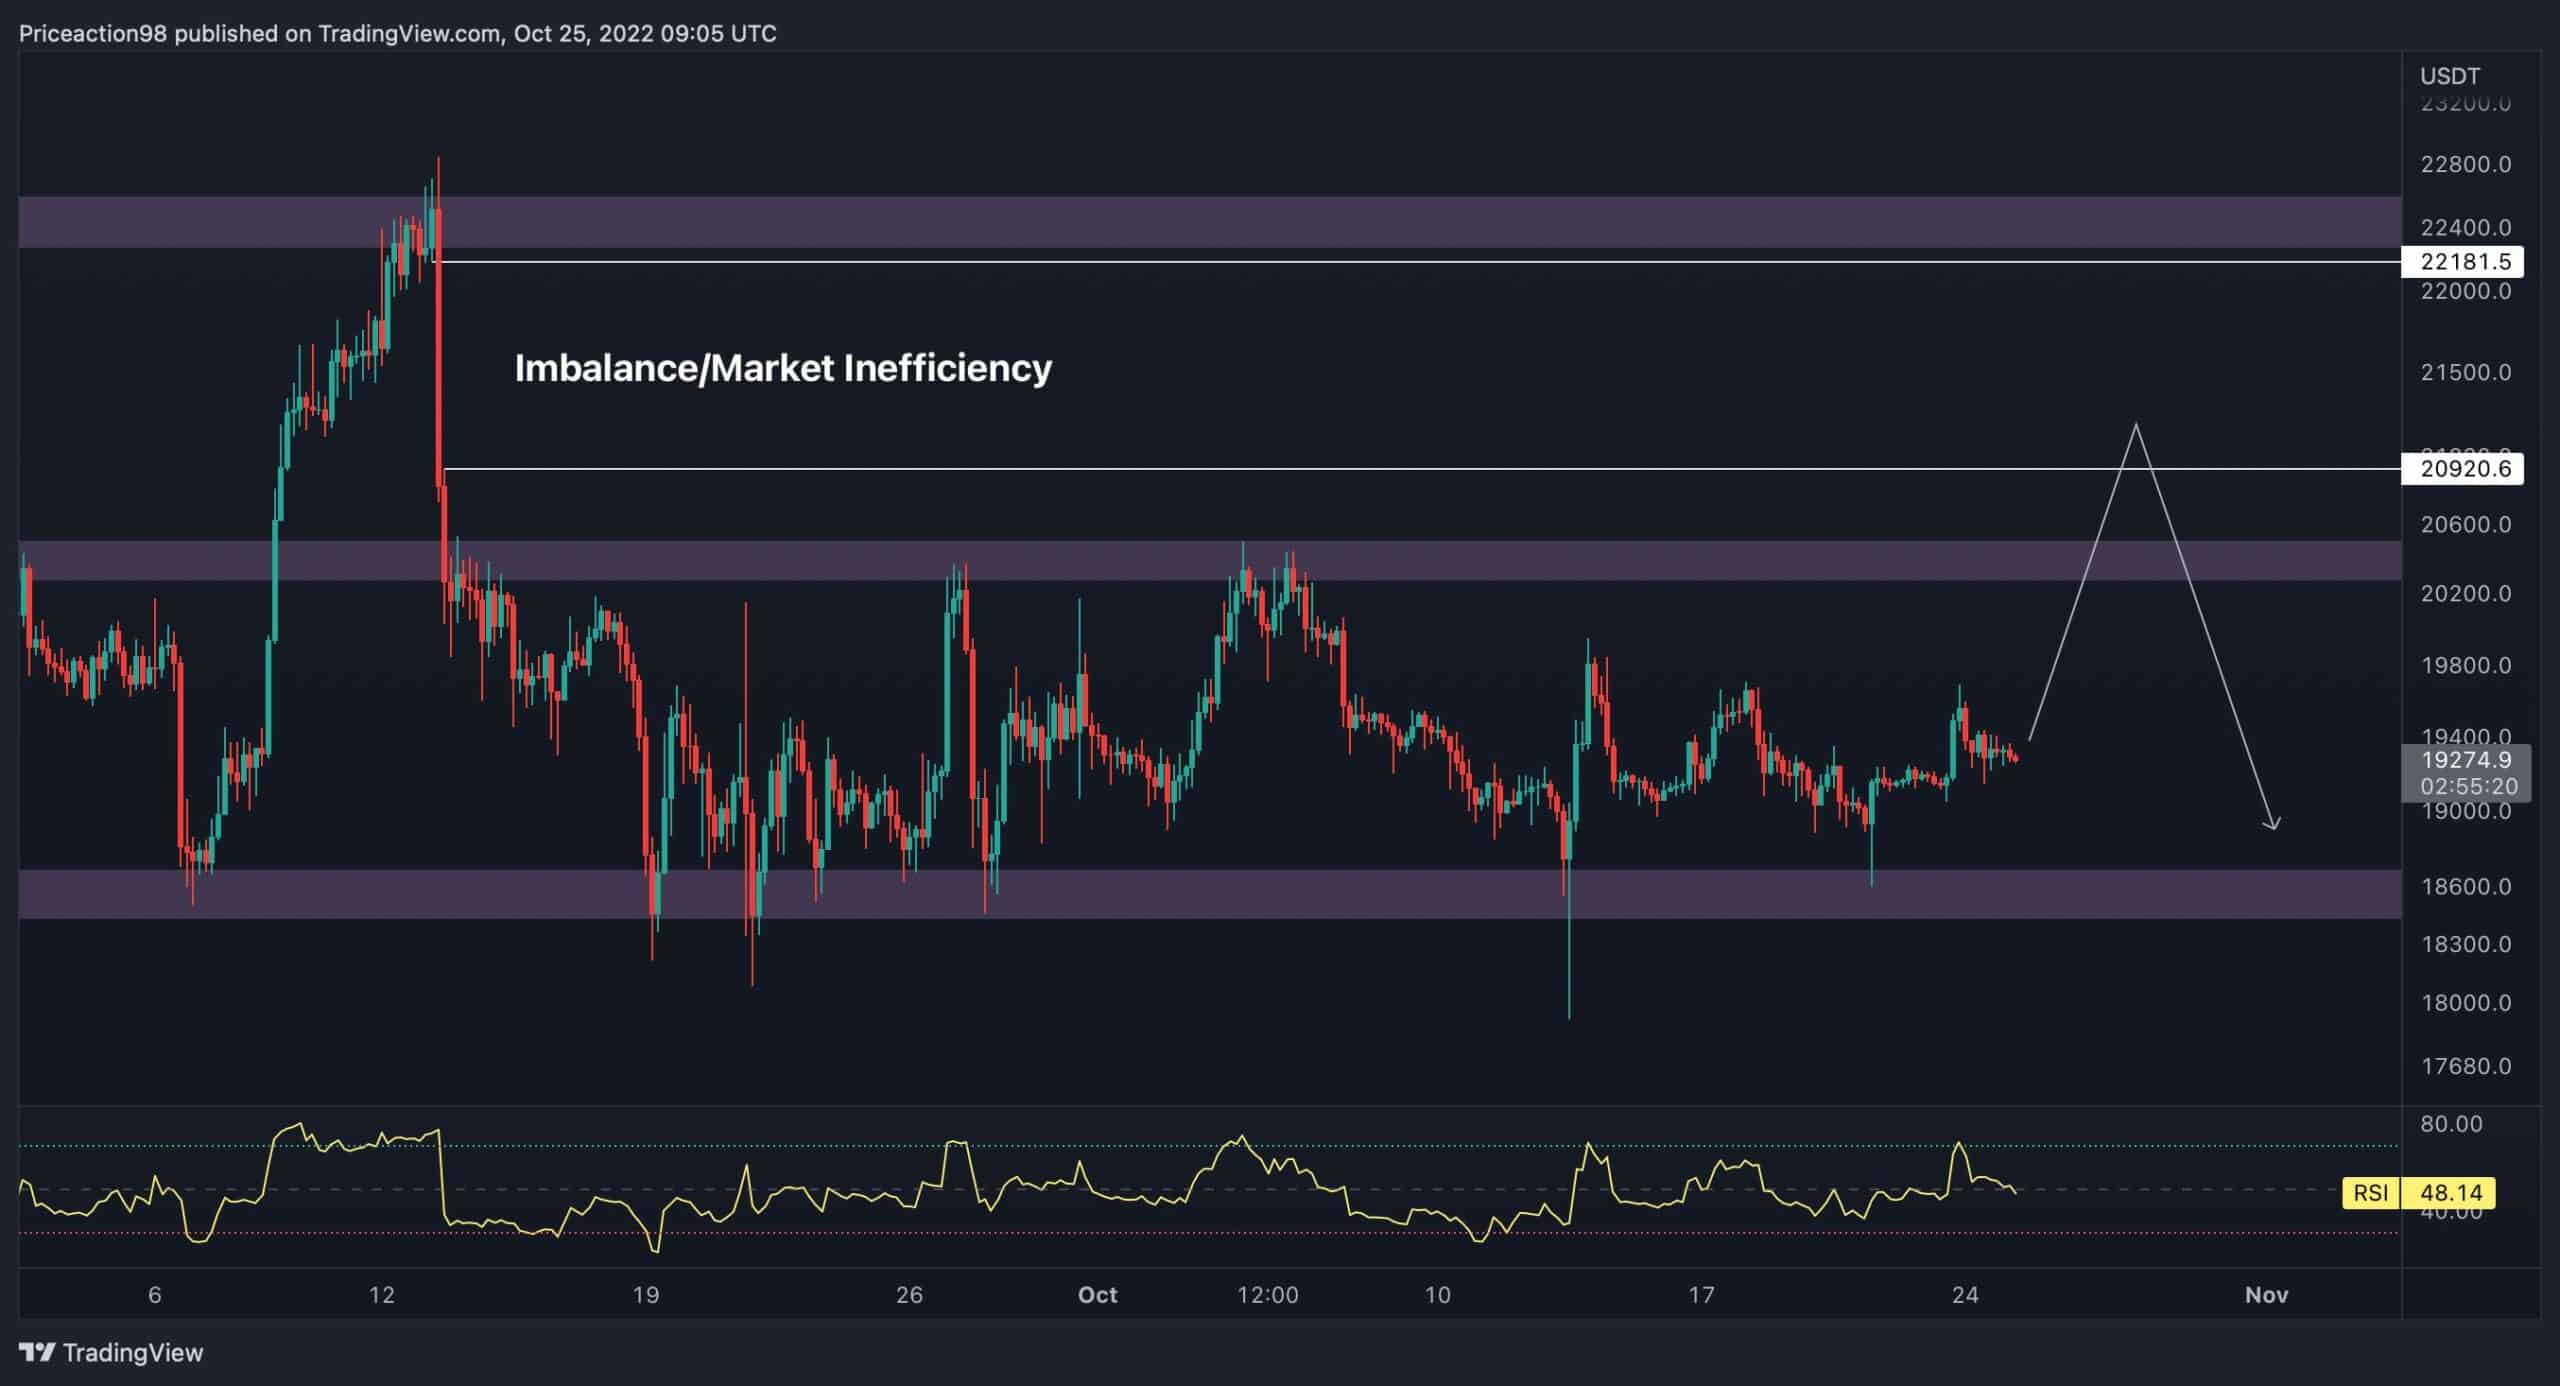
Since mid-June, the price has been lodged in a constant range between the $25K level and $18K. During this period, $20.5K turned into a significant resistance which has repeatedly rejected the price.
However, there is clear inefficiency between the $20.9K and the $22K levels. The market would typically use these inefficiencies to form its next big move. Hence, the most likely scenario for Bitcoin in the upcoming days seems to be using this imbalance and then developing another bearish move toward the $18K level.
If the support fails to hold, the $16K level will be a possible scenario on the table for the cryptocurrency.
Bitcoin has been attempting to form a reversal from the $18K support region over the last few months after many distinct clusters of market participants realized serious losses. However, the cryptocurrency has failed to rebound and is trapped in the $18K-$24K price channel.
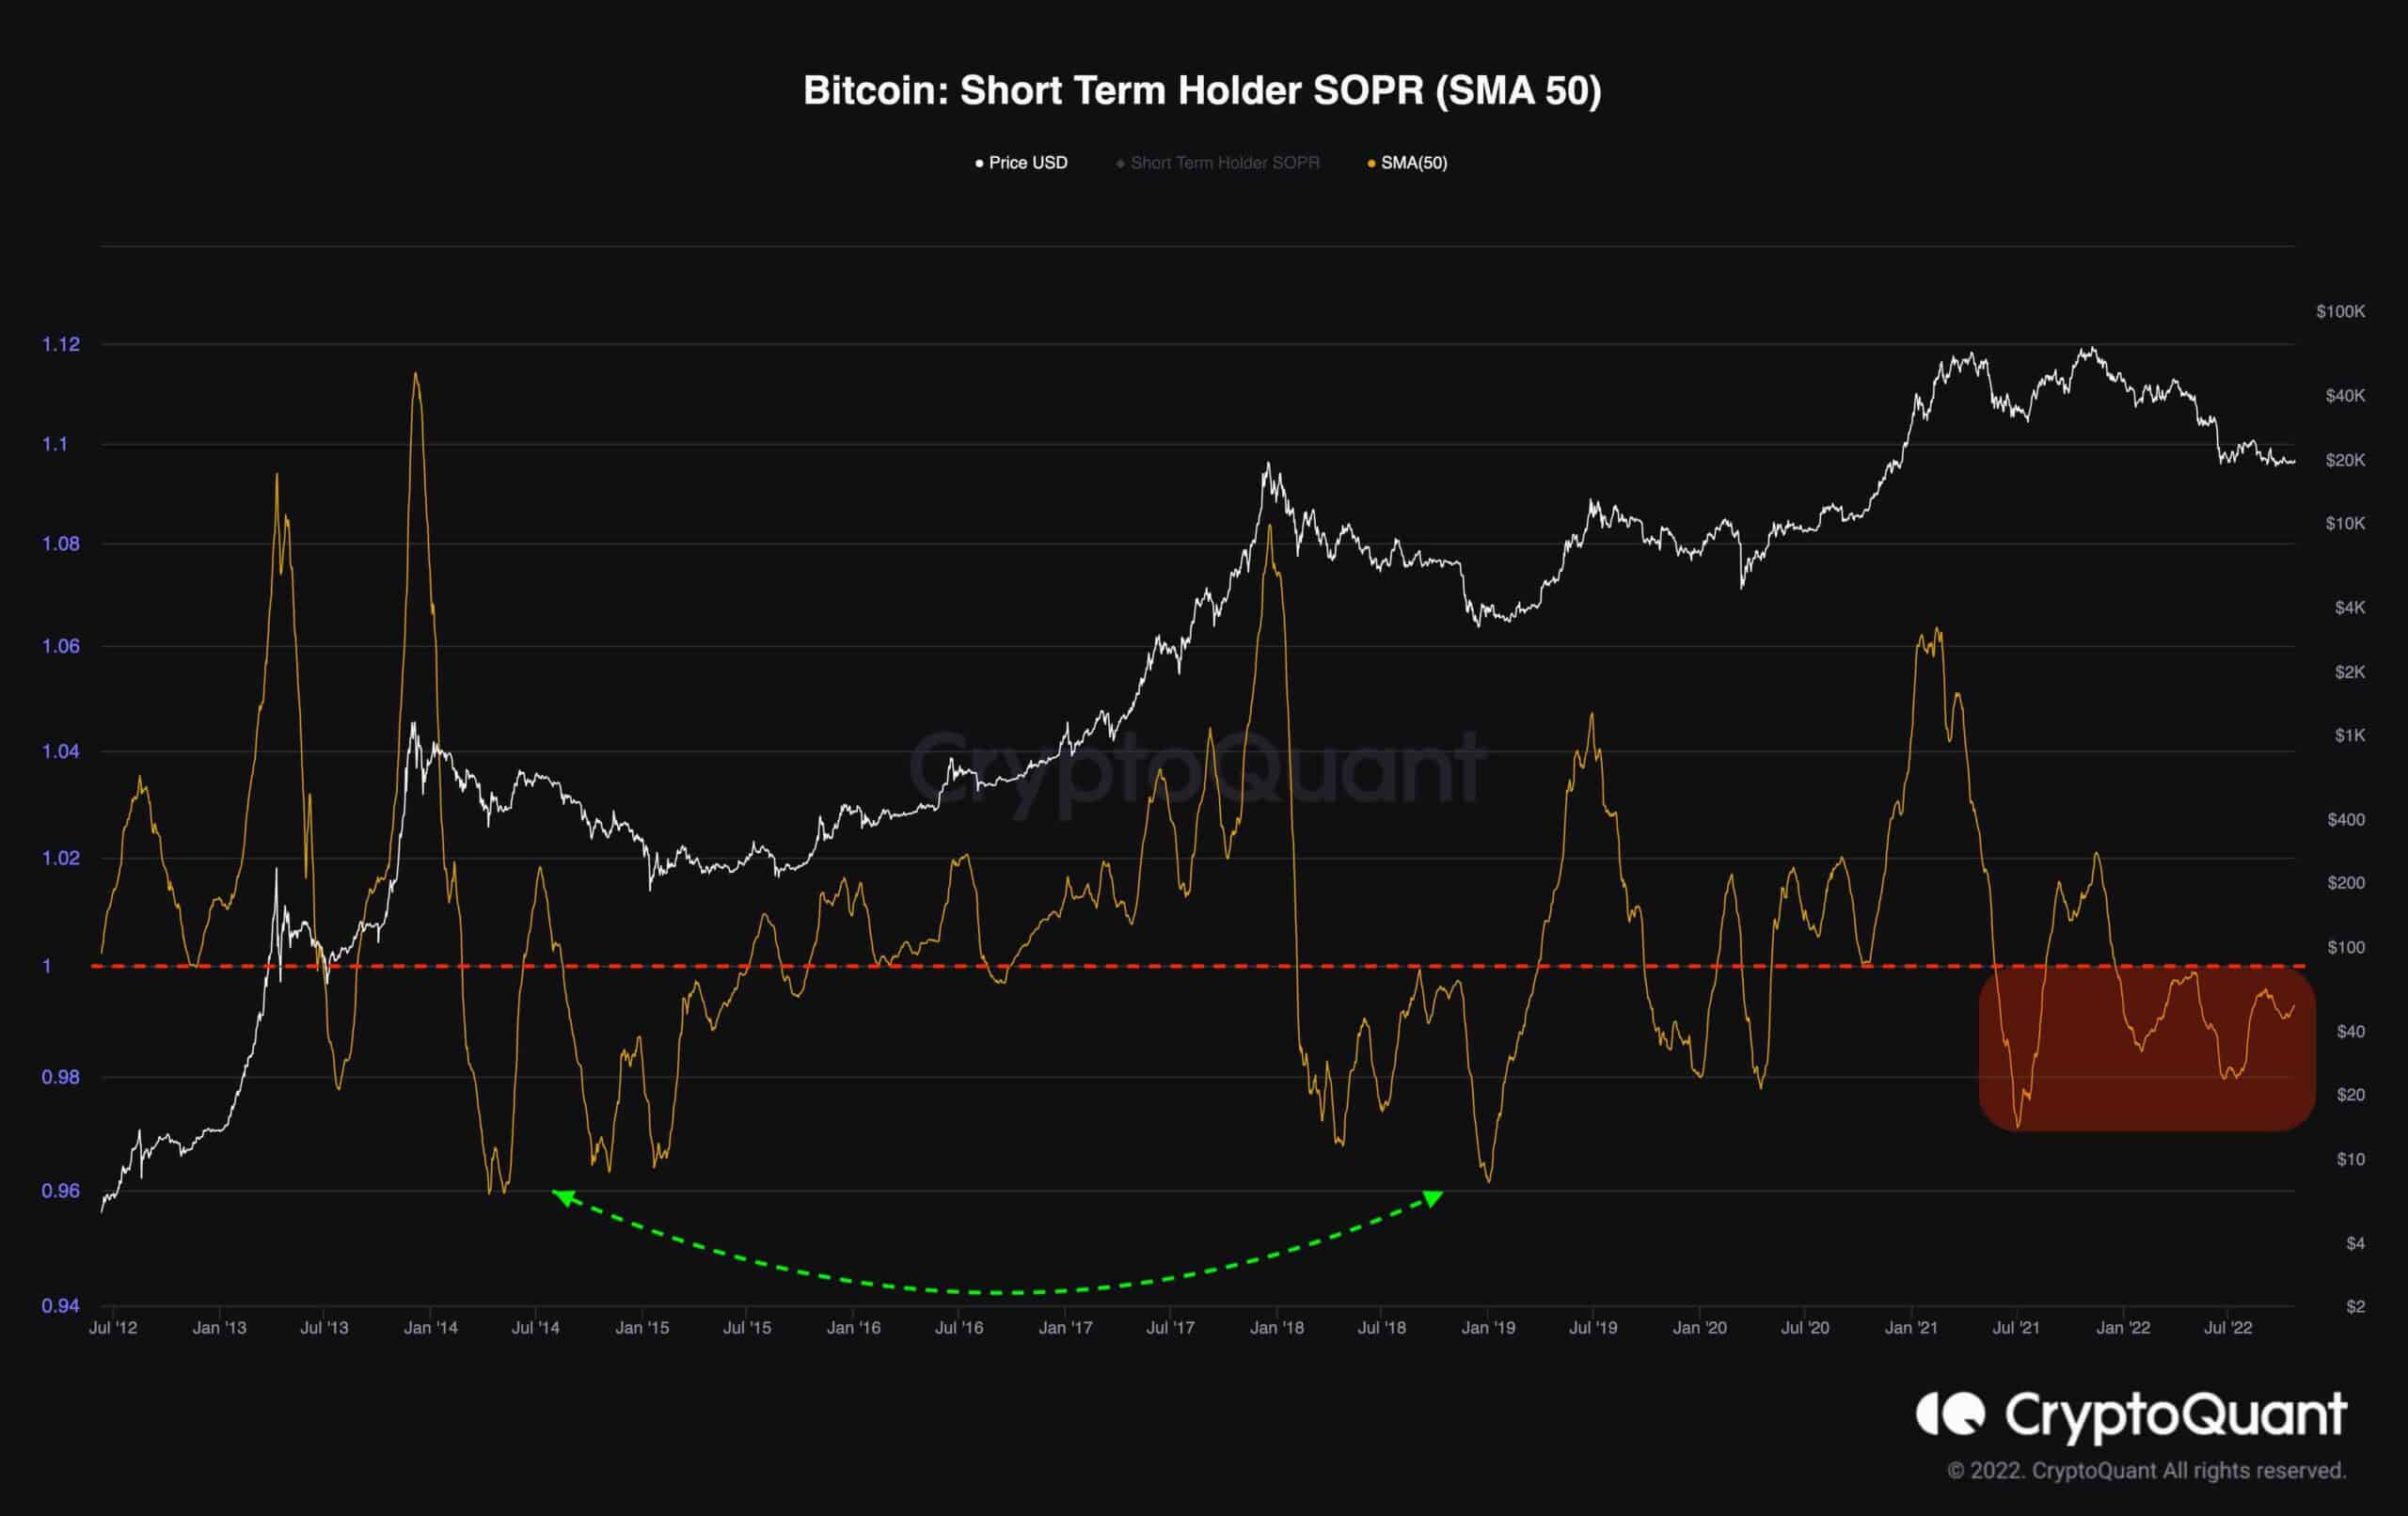
The following chart demonstrates the Short-Term Holder SOPR alongside the price. This metric measures whether the short-term holders are selling their coins at an aggregate loss.
It is evident that the short-term holder SOPR has not dropped significantly compared to the 2018 and 2015 bear markets, indicating that this cohort has not realized massive losses yet.
As a result, there is still room for another plummet toward lower price levels to complete the capitulation event.