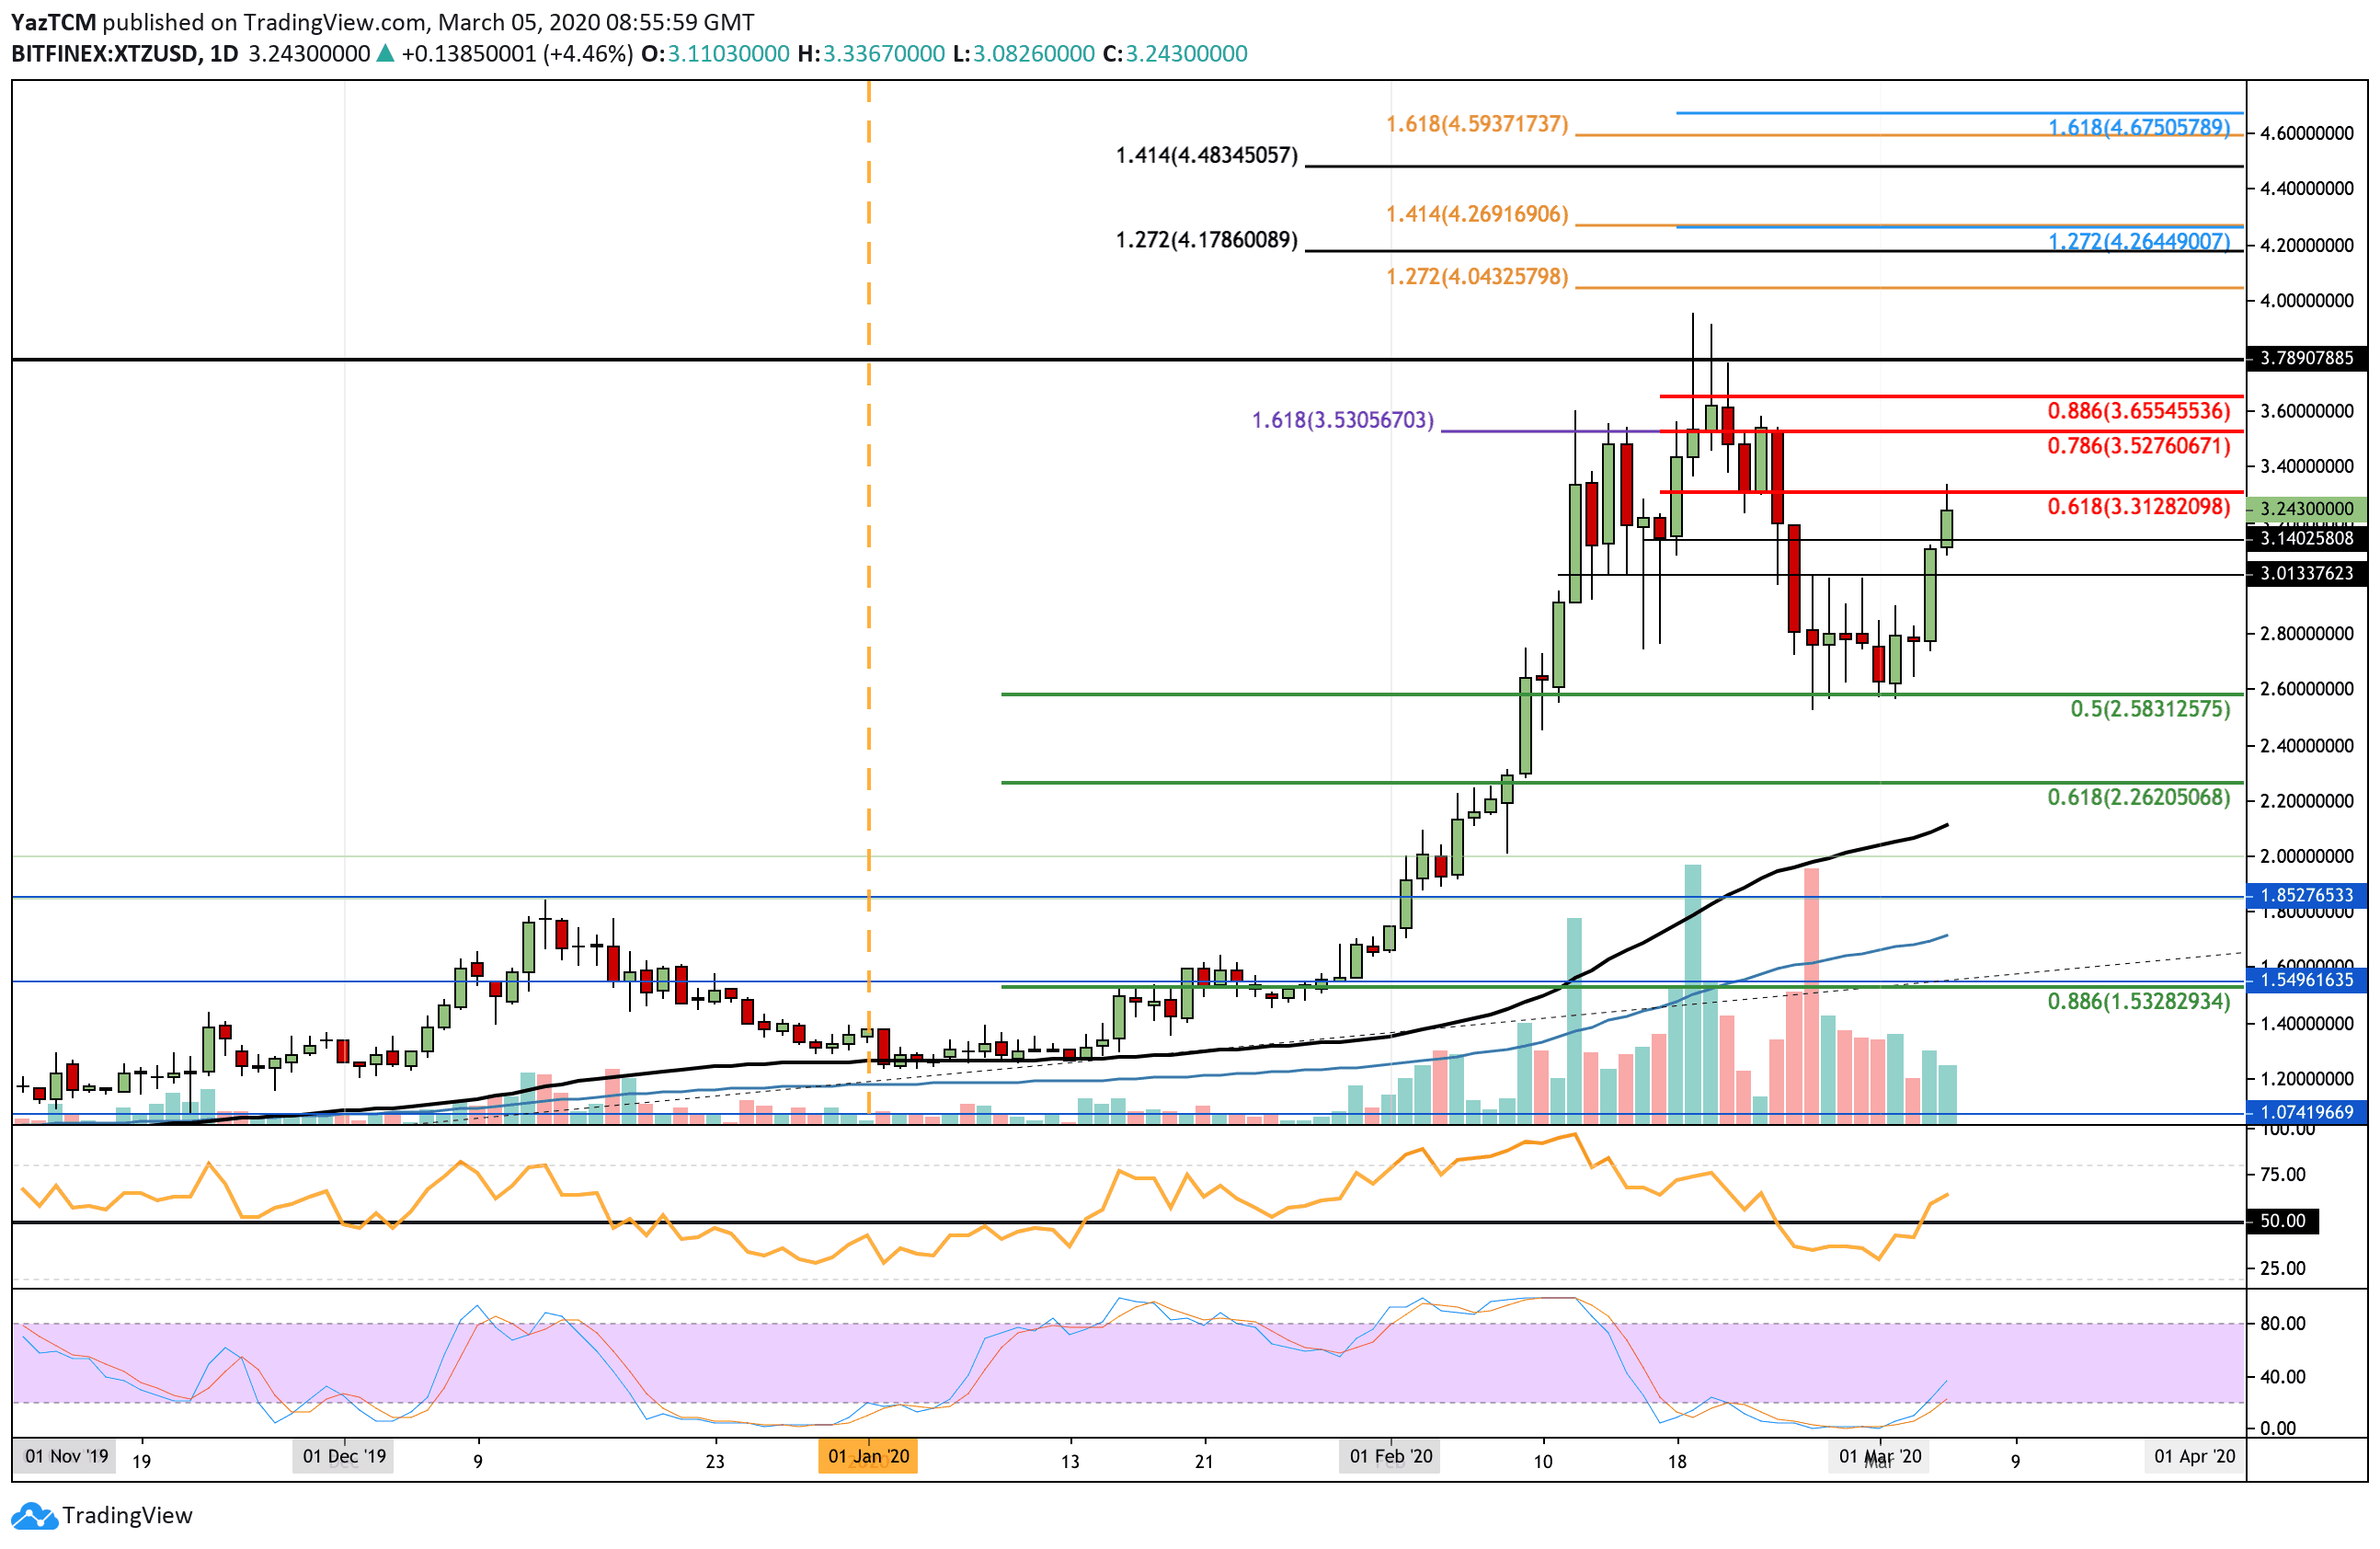
XTZ/USD:
Support: $3.14, $3.00, $2.80.
Resistance: $3.52, $3.65, $3.80.
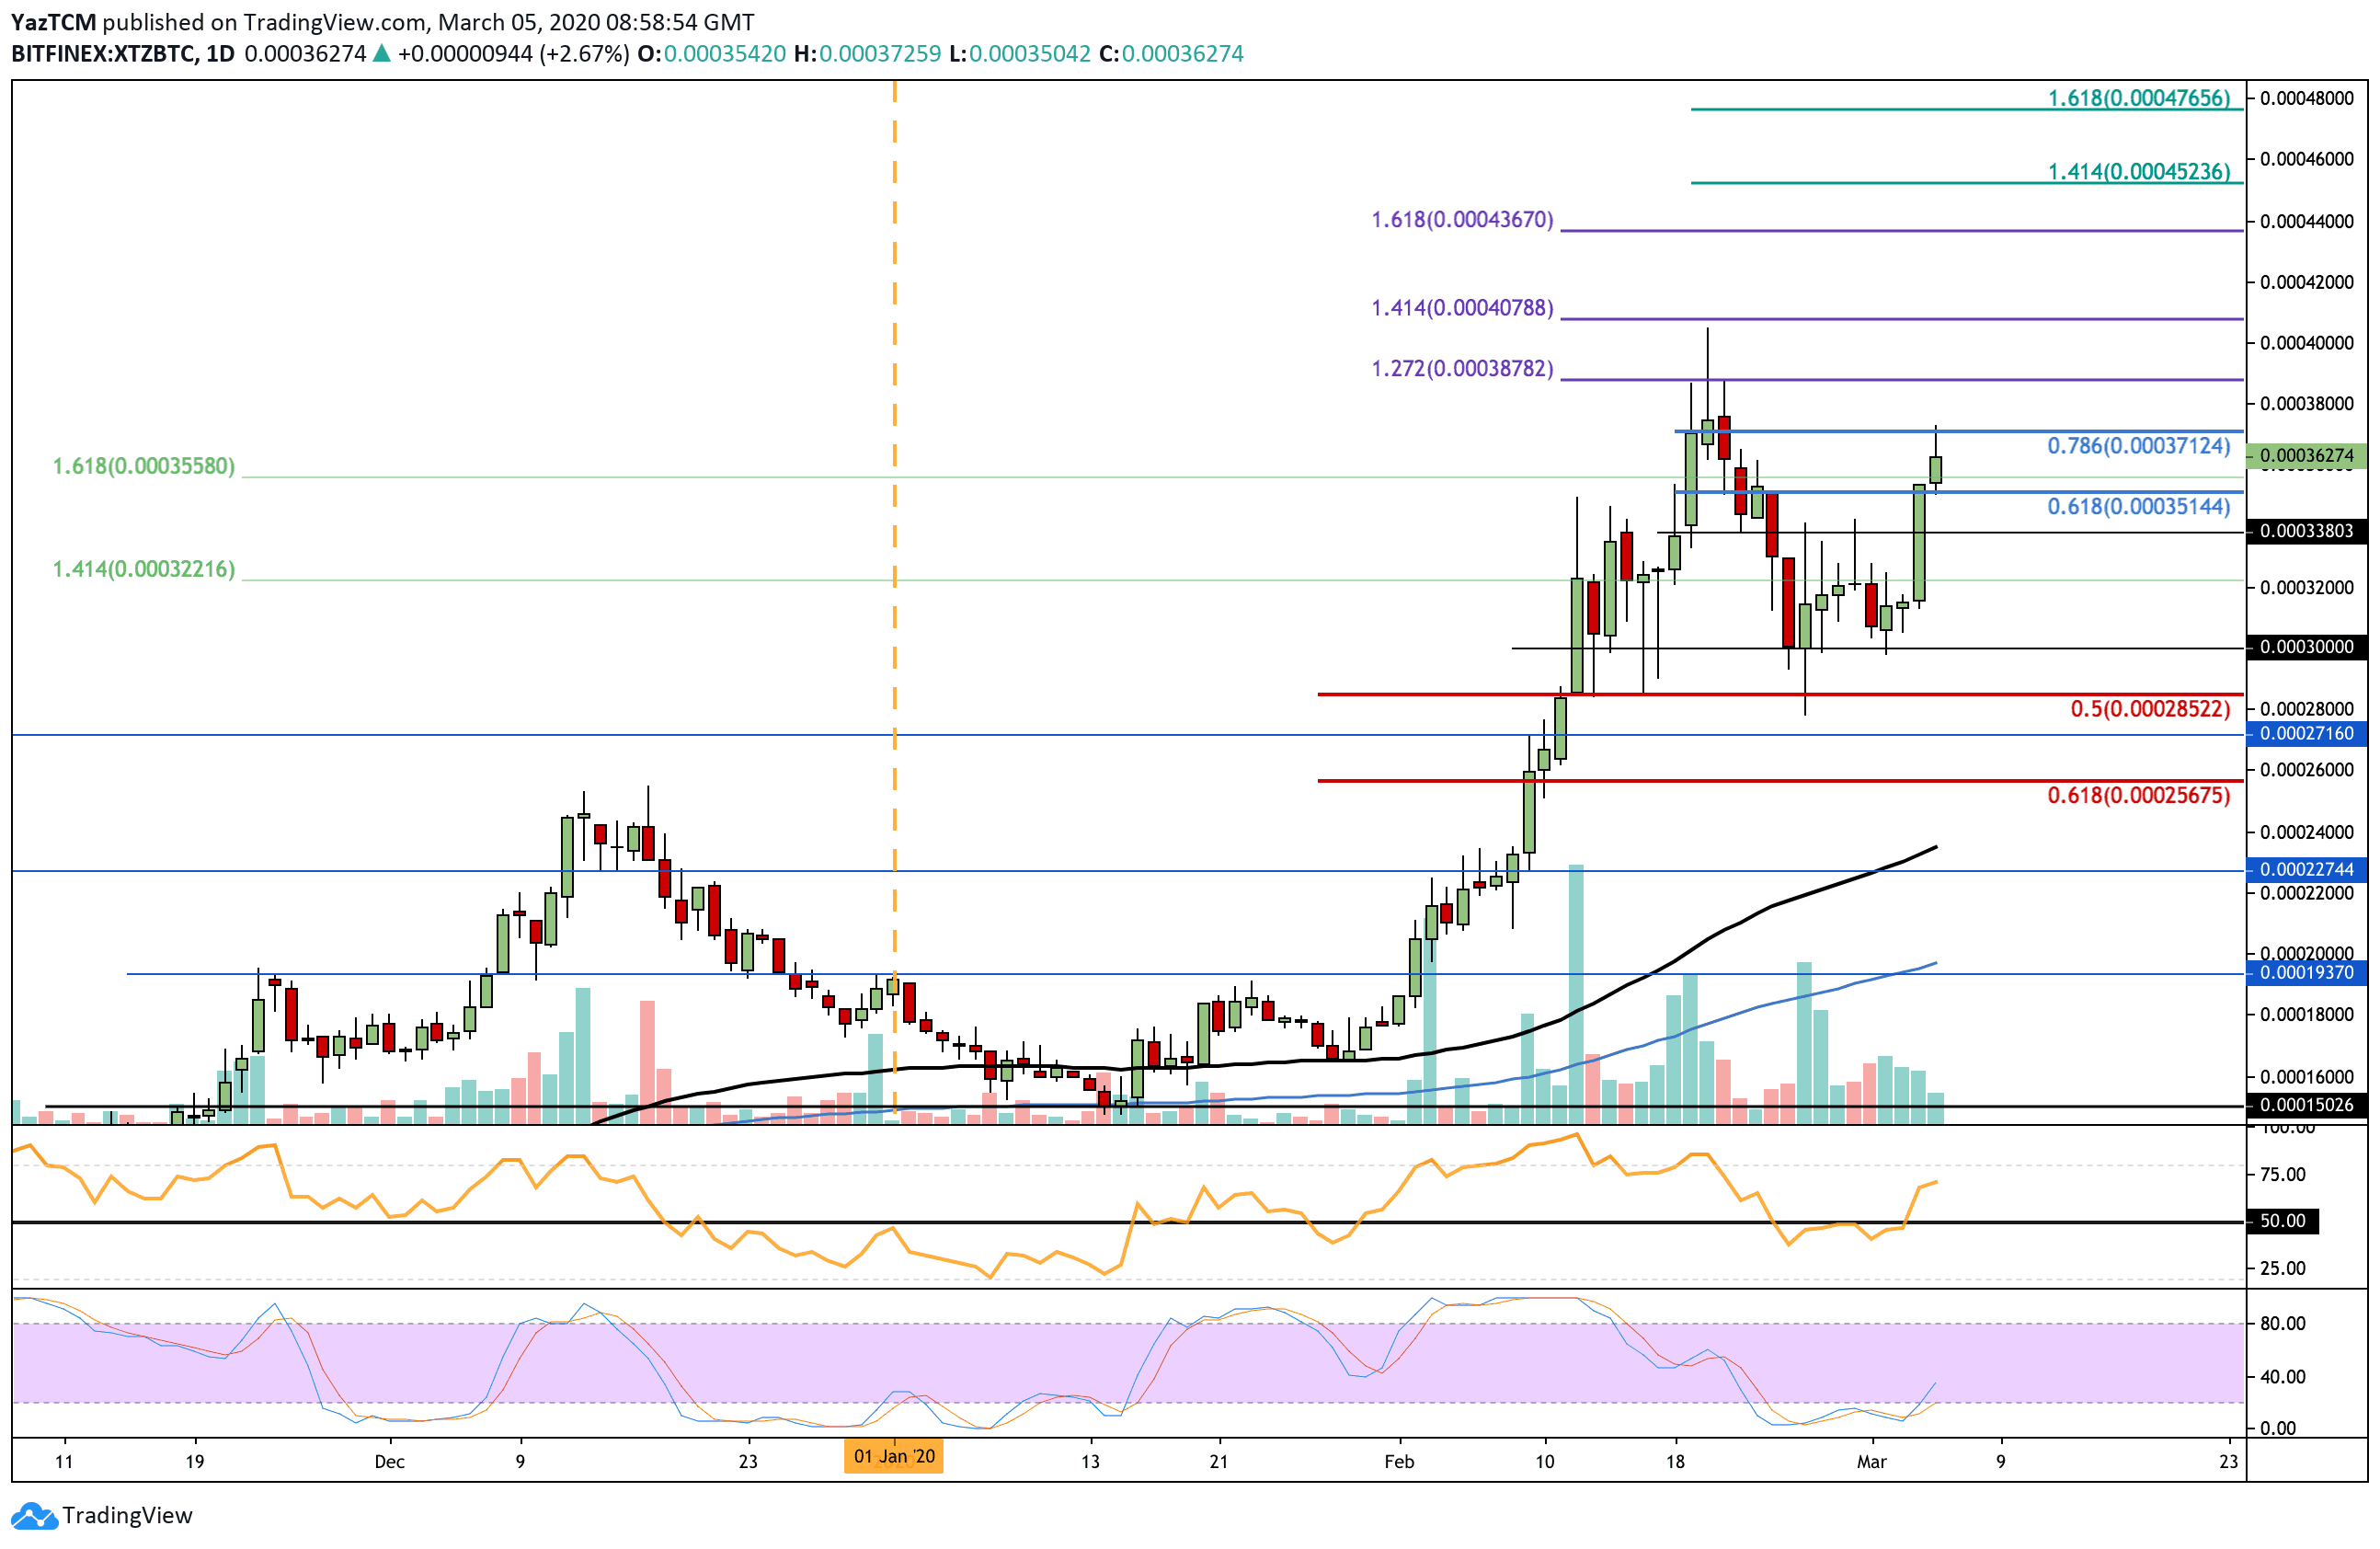
XTZ/BTC:
Support: 0.00036 BTC, 0.000351 BTC, 0.000338 BTC.
Resistance: 0.00038 BTC, 0.000387 BTC, 0.0004 BTC, 0.000407 BTC (2020 high).
During the middle of last month, Tezos ran into stiff resistance at $3.60 and quickly got rejected, following a huge price rally. It then went on to retrace by a total of nearly 30% until support was found at the 0.5 Fibonacci Retracement level at $2.58.
Upon reaching this support area, Tezos went on sideways trading within a range between $2.5 and $3.00 for the following week. It recently managed to penetrate $3.00 yesterday and continued further higher to reach $3.30 earlier today.
It currently facing resistance provided by a short term bearish .618 Fibonacci Retracement level priced at $3.31.
Once the bulls close above $3.31, higher resistance can be found at $3.52 (bearish .786 Fib Retracement), $3.65 (bearish .886 Fib Retracement), and $3.80. Beyond this, resistance lies at $4.00.
On the other hand, if the sellers push lower, support levels lie at $3.14, $3.00, and $2.80. This is followed by additional support at $2.58 (.5 Fib Retracement).
The RSI recently broke above 50 the level to show that the buyers are in control of the market momentum, and the Stochastic RSI also recently produced a bullish crossover signal.
Against Bitcoin, Tezos also rolled over during mid-Feb after hitting resistance at around 0.00038 BTC. It then dropped until finding support at 0.00028 BTC, where the market managed to rebound higher.
It is now facing resistance at a bearish .786 Fib Retracement level priced at 0.00037 BTC and must surpass and close above 0.00038 BTC in aiming for the 2020 high area beyond 0.0004.
If the buyers break above 0.000371 BTC, resistance is expected at 0.00038 BTC and 0.000387 BTC (1.272 Fib Extension). This is followed by higher resistance at 0.00040 BTC and 0.000436 BTC (1.618 Fib Extension). The 2020 high is at 0.000407, as mentioned above.
On the other hand, initial support can be expected at 0.00036 BTC. This is followed by support at 0.000351 BTC, 0.000338 BTC, and 0.00032 BTC.
Similarly to the XTZ-USD market, the RSI has broken above the 50 levels to indicate the bulls taking control of the momentum. The Stochastic RSI also produced a bullish crossover signal, which might be a positive sign for the buyers in the next future.