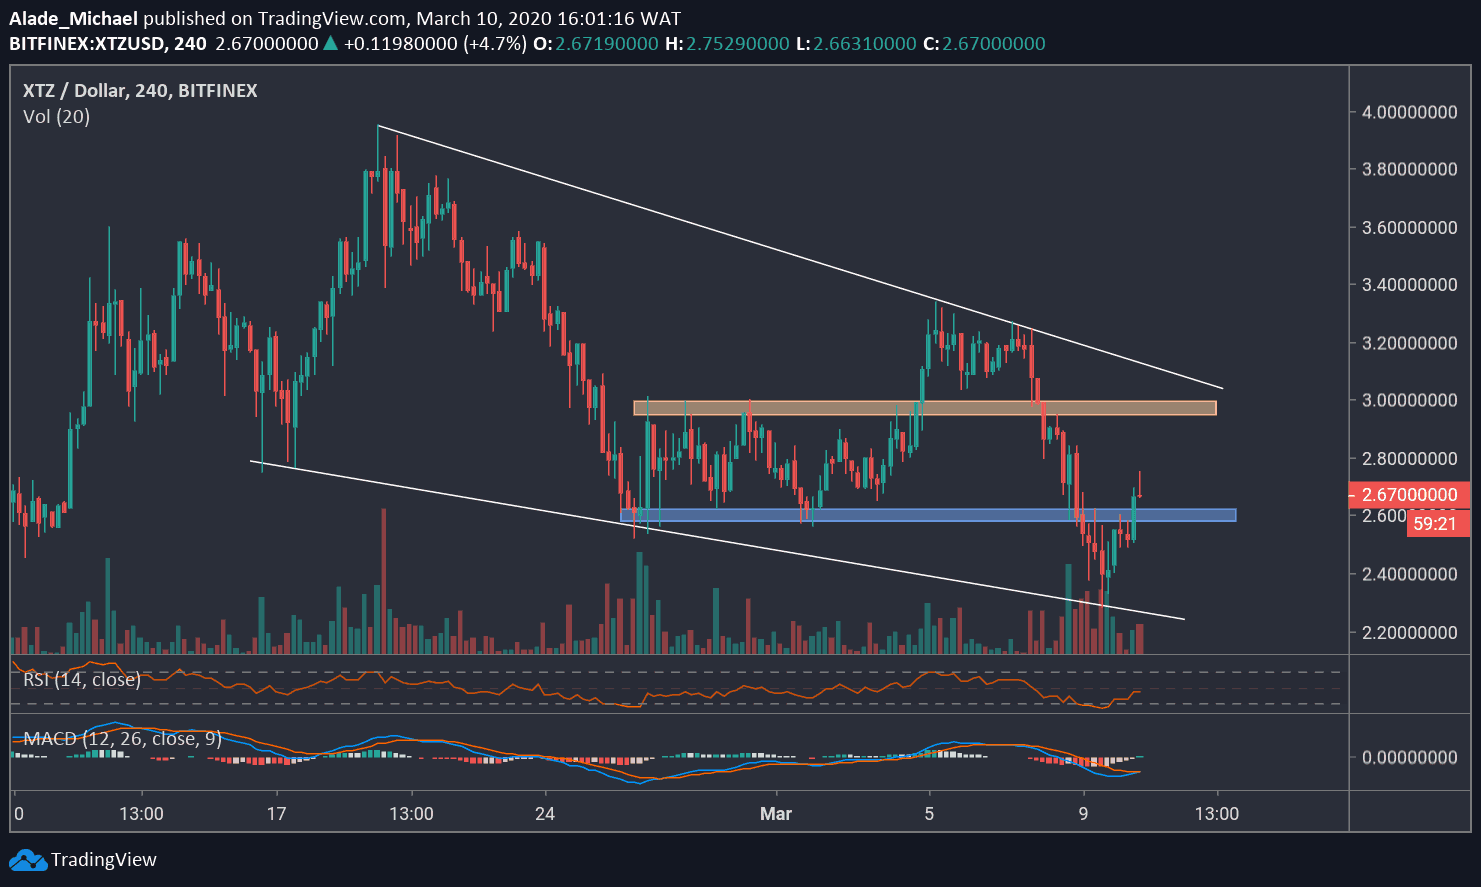
Key Resistance Levels: $3, $3.9
Key Support Levels: $2.3, $2
Following this week’s bearish start, XTZ saw a massive drop of 18% to a three-week low at $2.3. This drop was in correlation with the Bitcoin decline of the past days.
Today, Tezos recovered 10% over the past 24-hours. At the moment, XTZ is trading for $2.6.
Though XTZ is still trading inside a descending wedge, we can expect some bullish price action in case the wedge breaks to the upside. However, as it stands now, Tezos is still under a short-term bearish correction.
As we can see on the 4-hour chart, Tezos bounced off the wedge’s support of $2.3, followed by a slight break above $2.6 resistance – where the blue area lies. A further increase from here should allow XTZ to reach a psychological resistance of $3 in the orange zone.
If Tezos breaks above this wedge, it will likely target $3.9, the resistance from where the Tezos price started dropping mid-February.
A steep drop below the $2.6 level could initiate a severe sell-off to the wedge’s support level at $2.3. If the sellers break the latter, then Tezos may create another weekly low around $2 or even $1.8.
Looking at the technical indicators, we can see that Tezos is slowly regaining momentum on both the RSI and the MACD. Nonetheless, Tezos needs to rise above the mid-levels for bullish confirmation.
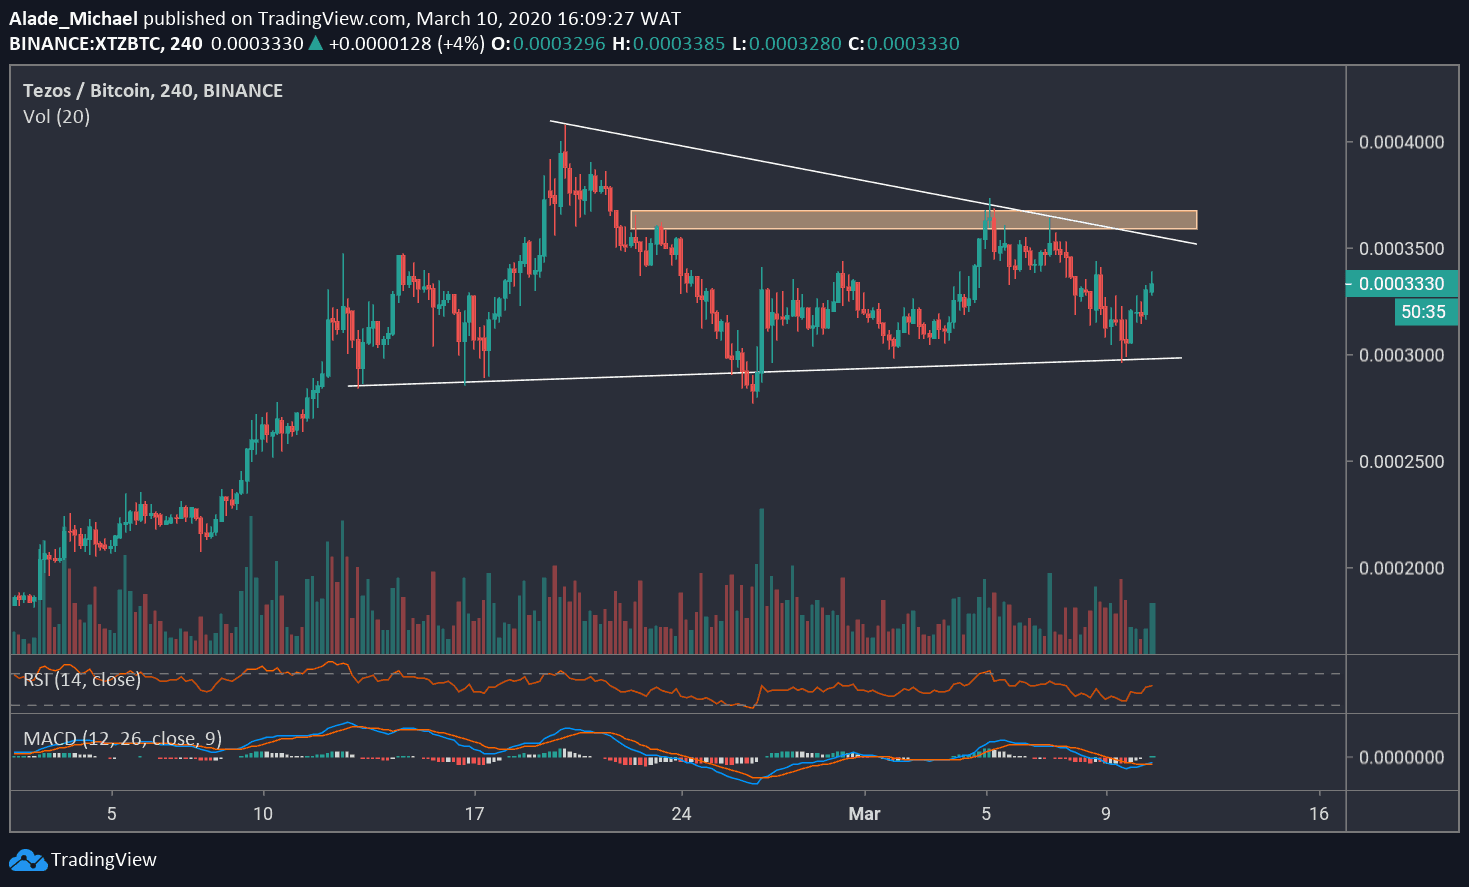
Key Support Levels: 0.00036 BTC, 0.00040 BTC
Key Resistance Levels: 0.00030 BTC, 0.00025 BTC
After finding support around the 0.00030 BTC level yesterday, Tezos bounced back and now trading around the 0.000330 BTC level following 6.5% gains at the moment.
Meanwhile, a bull flag pattern is forming on the 4-hours chart and could trigger a new bullish momentum for Tezos, in case of a breakout.
If the bullish flag pattern plays out, the closest resistance to watch is the 0.00036 BTC level (February 20 high), marked orange on the chart. A clear move above this level would allow a nice increase towards the current 2020 high of 0.00040 BTC.
In case Tezos rejects below the orange area, the first support level to consider is 0.00030, which is today’s low. A dip beneath this support could initiate a sell-off to 0.00025 level.
Currently, the RSI is shooting up following the price recovery. Though the MACD is currently negative but we can anticipate a positive move once a crossover occurs.