The most recent Bitcoin price surge may have triggered a serious FOMO wave amongst investors as data displayed the largest inflow of Tether (USDT) towards exchanges in eight months happened yesterday after BTC broke above $10,000 and aimed for $11,000.
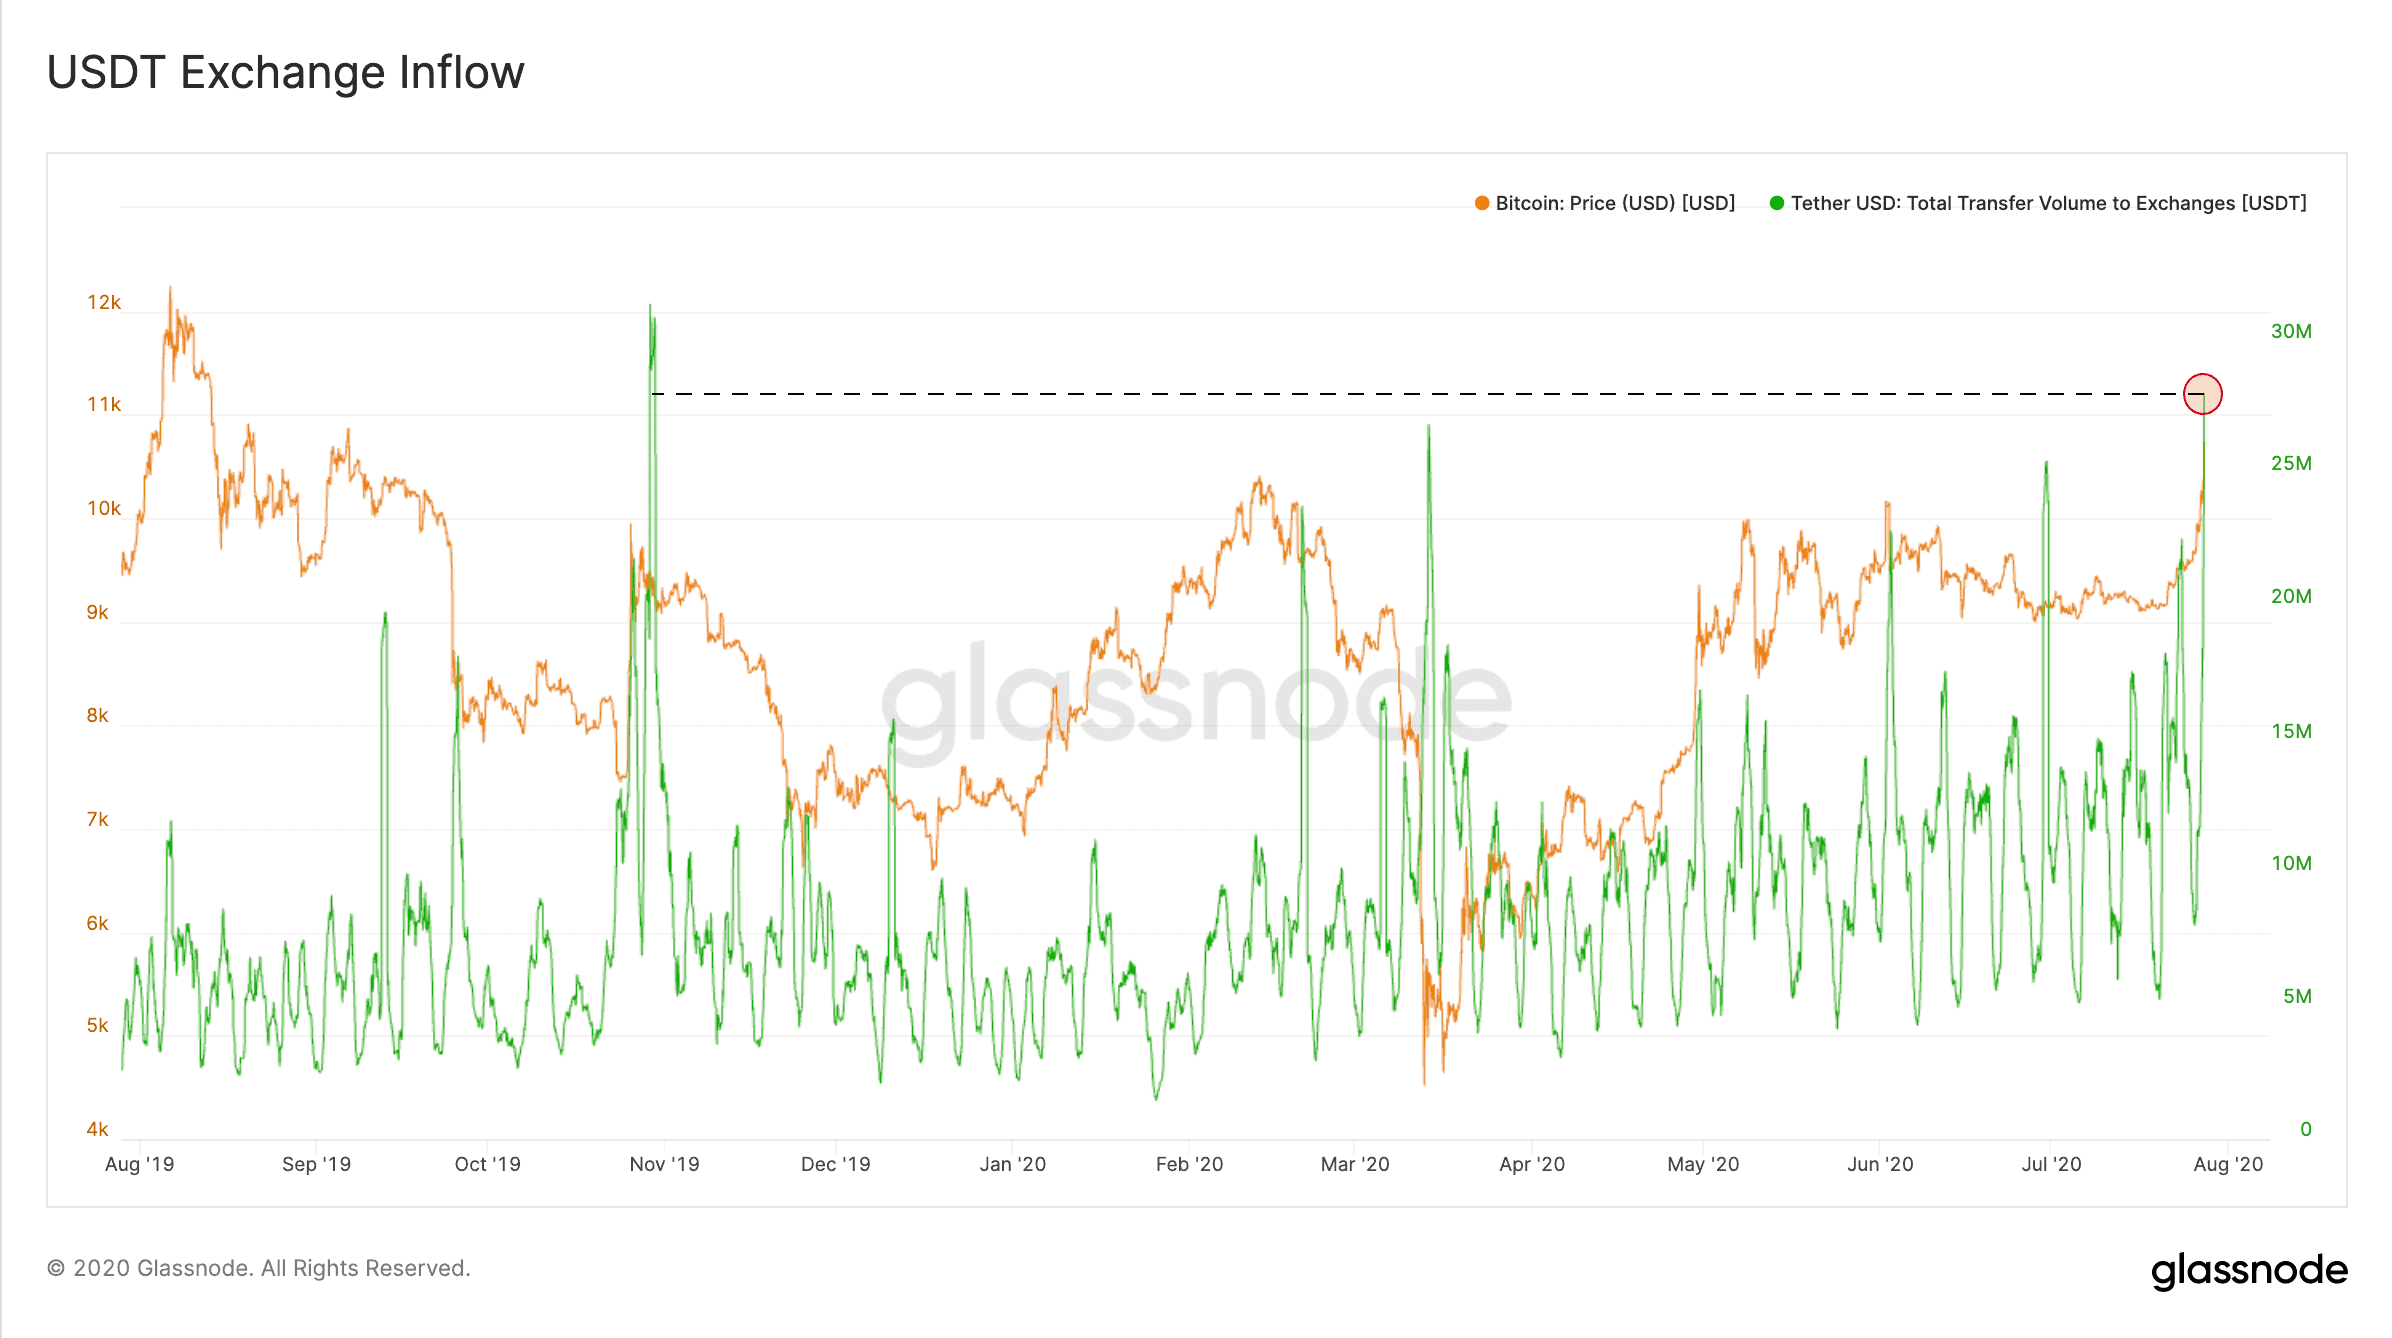
Bitcoin’s price finally broke above $10,000 a few days ago. In doing so, the asset attracted a lot of attention from the cryptocurrency community and perhaps investors. According to data provided by the digital asset analytics company Glassnode, exchanges received the largest hourly inflow (based on 24-hour moving average) of Tether in eight months yesterday.
This could indicate classic signs of FOMO (fear of missing out) from Bitcoin investors. Following weeks of stationary price positioning, BTC initiated a significant surge, in which it touched $11,400 before retracing slightly.
The massive inflow towards exchanges coincided with Bitcoin conquering the major resistance level at $10,500. In the last year, there was only one example of more substantial USDT inflow to digital asset platforms. It came in late October 2019, after another considerable price pump from the primary cryptocurrency.
At the time, China’s President Xi Jinping urged his country to invest more in blockchain technology. Although it was wrongly accepted that the most populated nation was adopting a more favorable approach towards cryptocurrencies, it had an immediate price effect on the market. Bitcoin alone jumped from $7,500 to over $10,000 in a few hourly candles.
Shortly after came the large USDT transfer volume to exchanges, but the asset began retracing and tanked back to $7,000 in a few weeks.
As mentioned above, BTC’s price declined after the October 2019 surge, but several indicators point that the outcome this time could be somewhat contrasting. In fact, the next significant BTC bull run may have already started, as CryptoPotato reported.
The asset broke above a crucial weekly resistance line that began in December 2017. For the first time since then, Bitcoin managed to close above it on the weekly chart.
Observing the monthly chart, a popular analyst pointed out that BTC is moving in expanding cycles, which could ultimately skyrocket its price to $100,000 by November 2022.
Other factors working in Bitcoin’s favor include the famous stock-to-flow model, the increased HODLers mentality from investors, and BTC’s daily issuance value in USD divided by the 365-MA of the daily issuance (the Puell Multiple metric).