BTC/USD chart via Tradingview
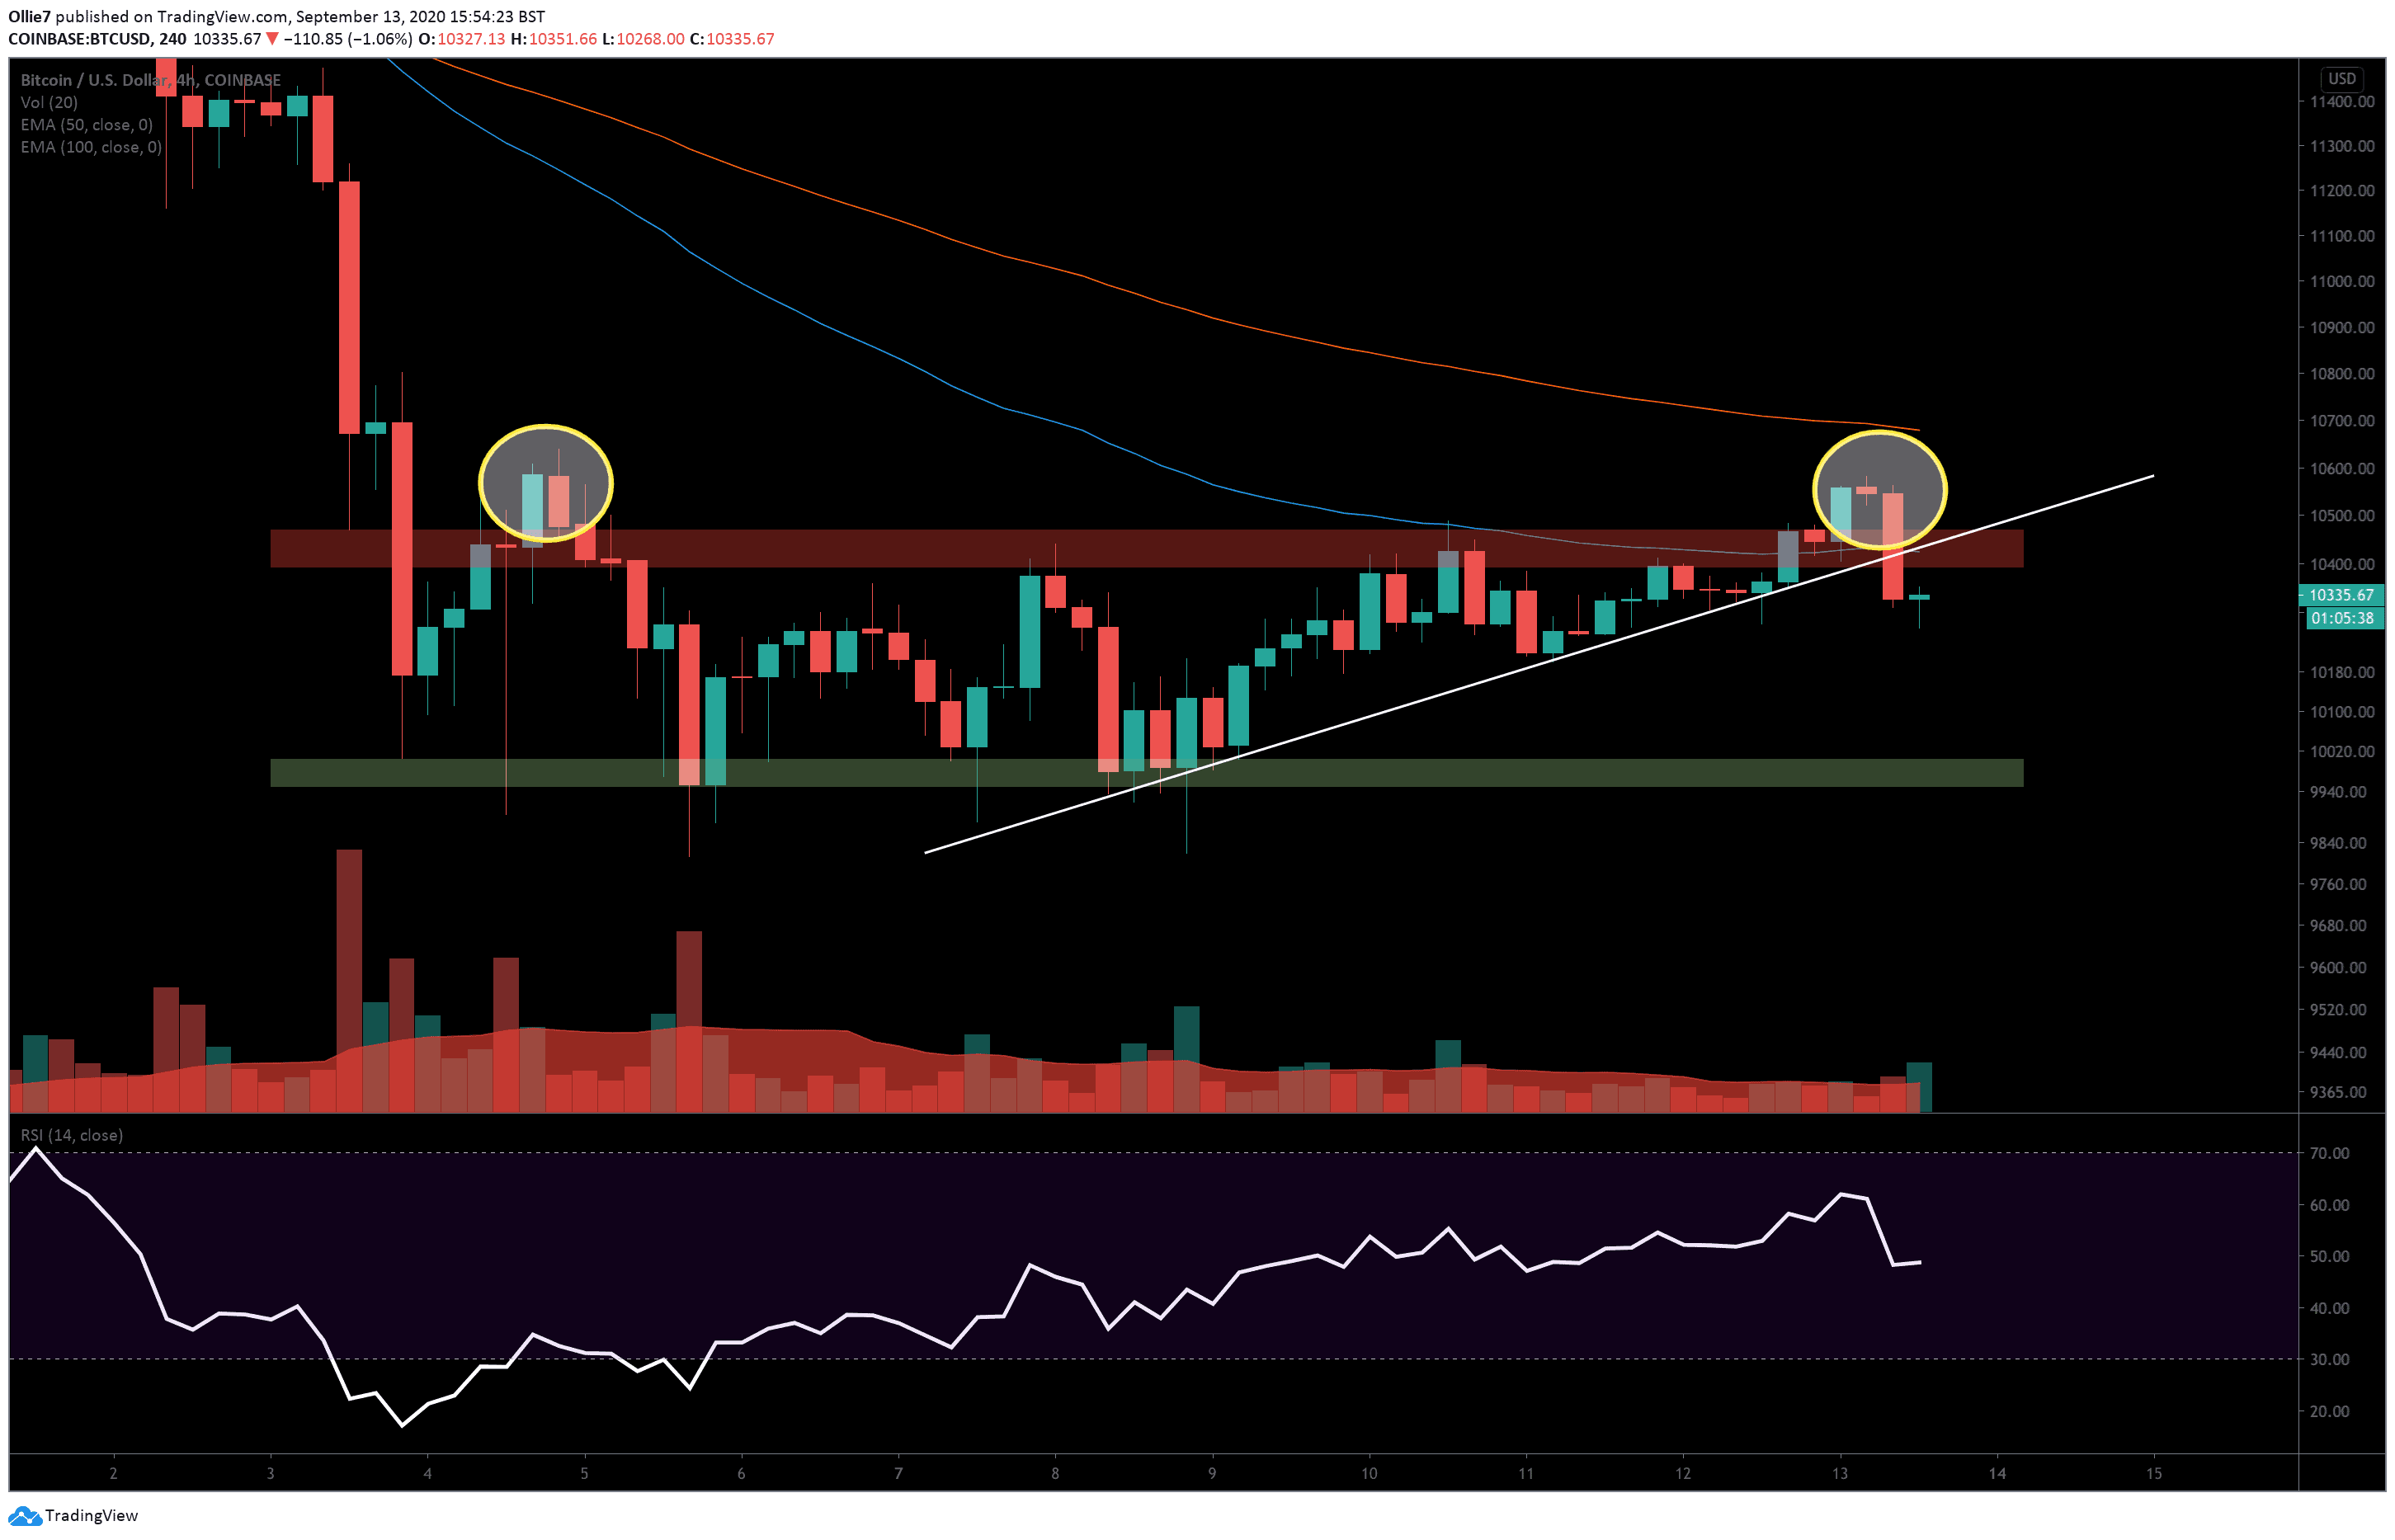
As of writing these lines, Bitcoin’s price has fallen back down to the $10,300 level in the last few hours, after bears overpowered a second breakout attempt from the current range.
Looking at the candles more closely over the 1-hour time frame, it seems like this latest move was orchestrated by whale traders to trick smaller traders into thinking BTC was finally breaking out of its range (above $10,500) before dumping on them.
Prices surged over $120 in a few minutes, followed by a period of sideways consolidation, and then a bearish correction that drove BTC straight back to where it started from.
Now, we have two clear fakeouts (marked by yellow circles below) from the current range between $10,470 and $9,950, both of which peaked around the $10,580 level.
Prior to the sell-off, BTC price had been tracking well on a strong up-trending support (the marked white line) for over four days, as can be seen on the 4-hour chart. Now, with $9 billion stripped from the crypto markets, this previous support will now likely flip into a strong resistance level.
The upper range resistance zone between $10,400 and $10,470 will continue to be a key area for bulls to breakthrough in the short-term. As a reminder, this was the previous 2020 high for most of the current year so far.
The 4-hour 50 EMA line (blue) should now also act as a short-term resistance after prices broke beneath it during the latest crash.
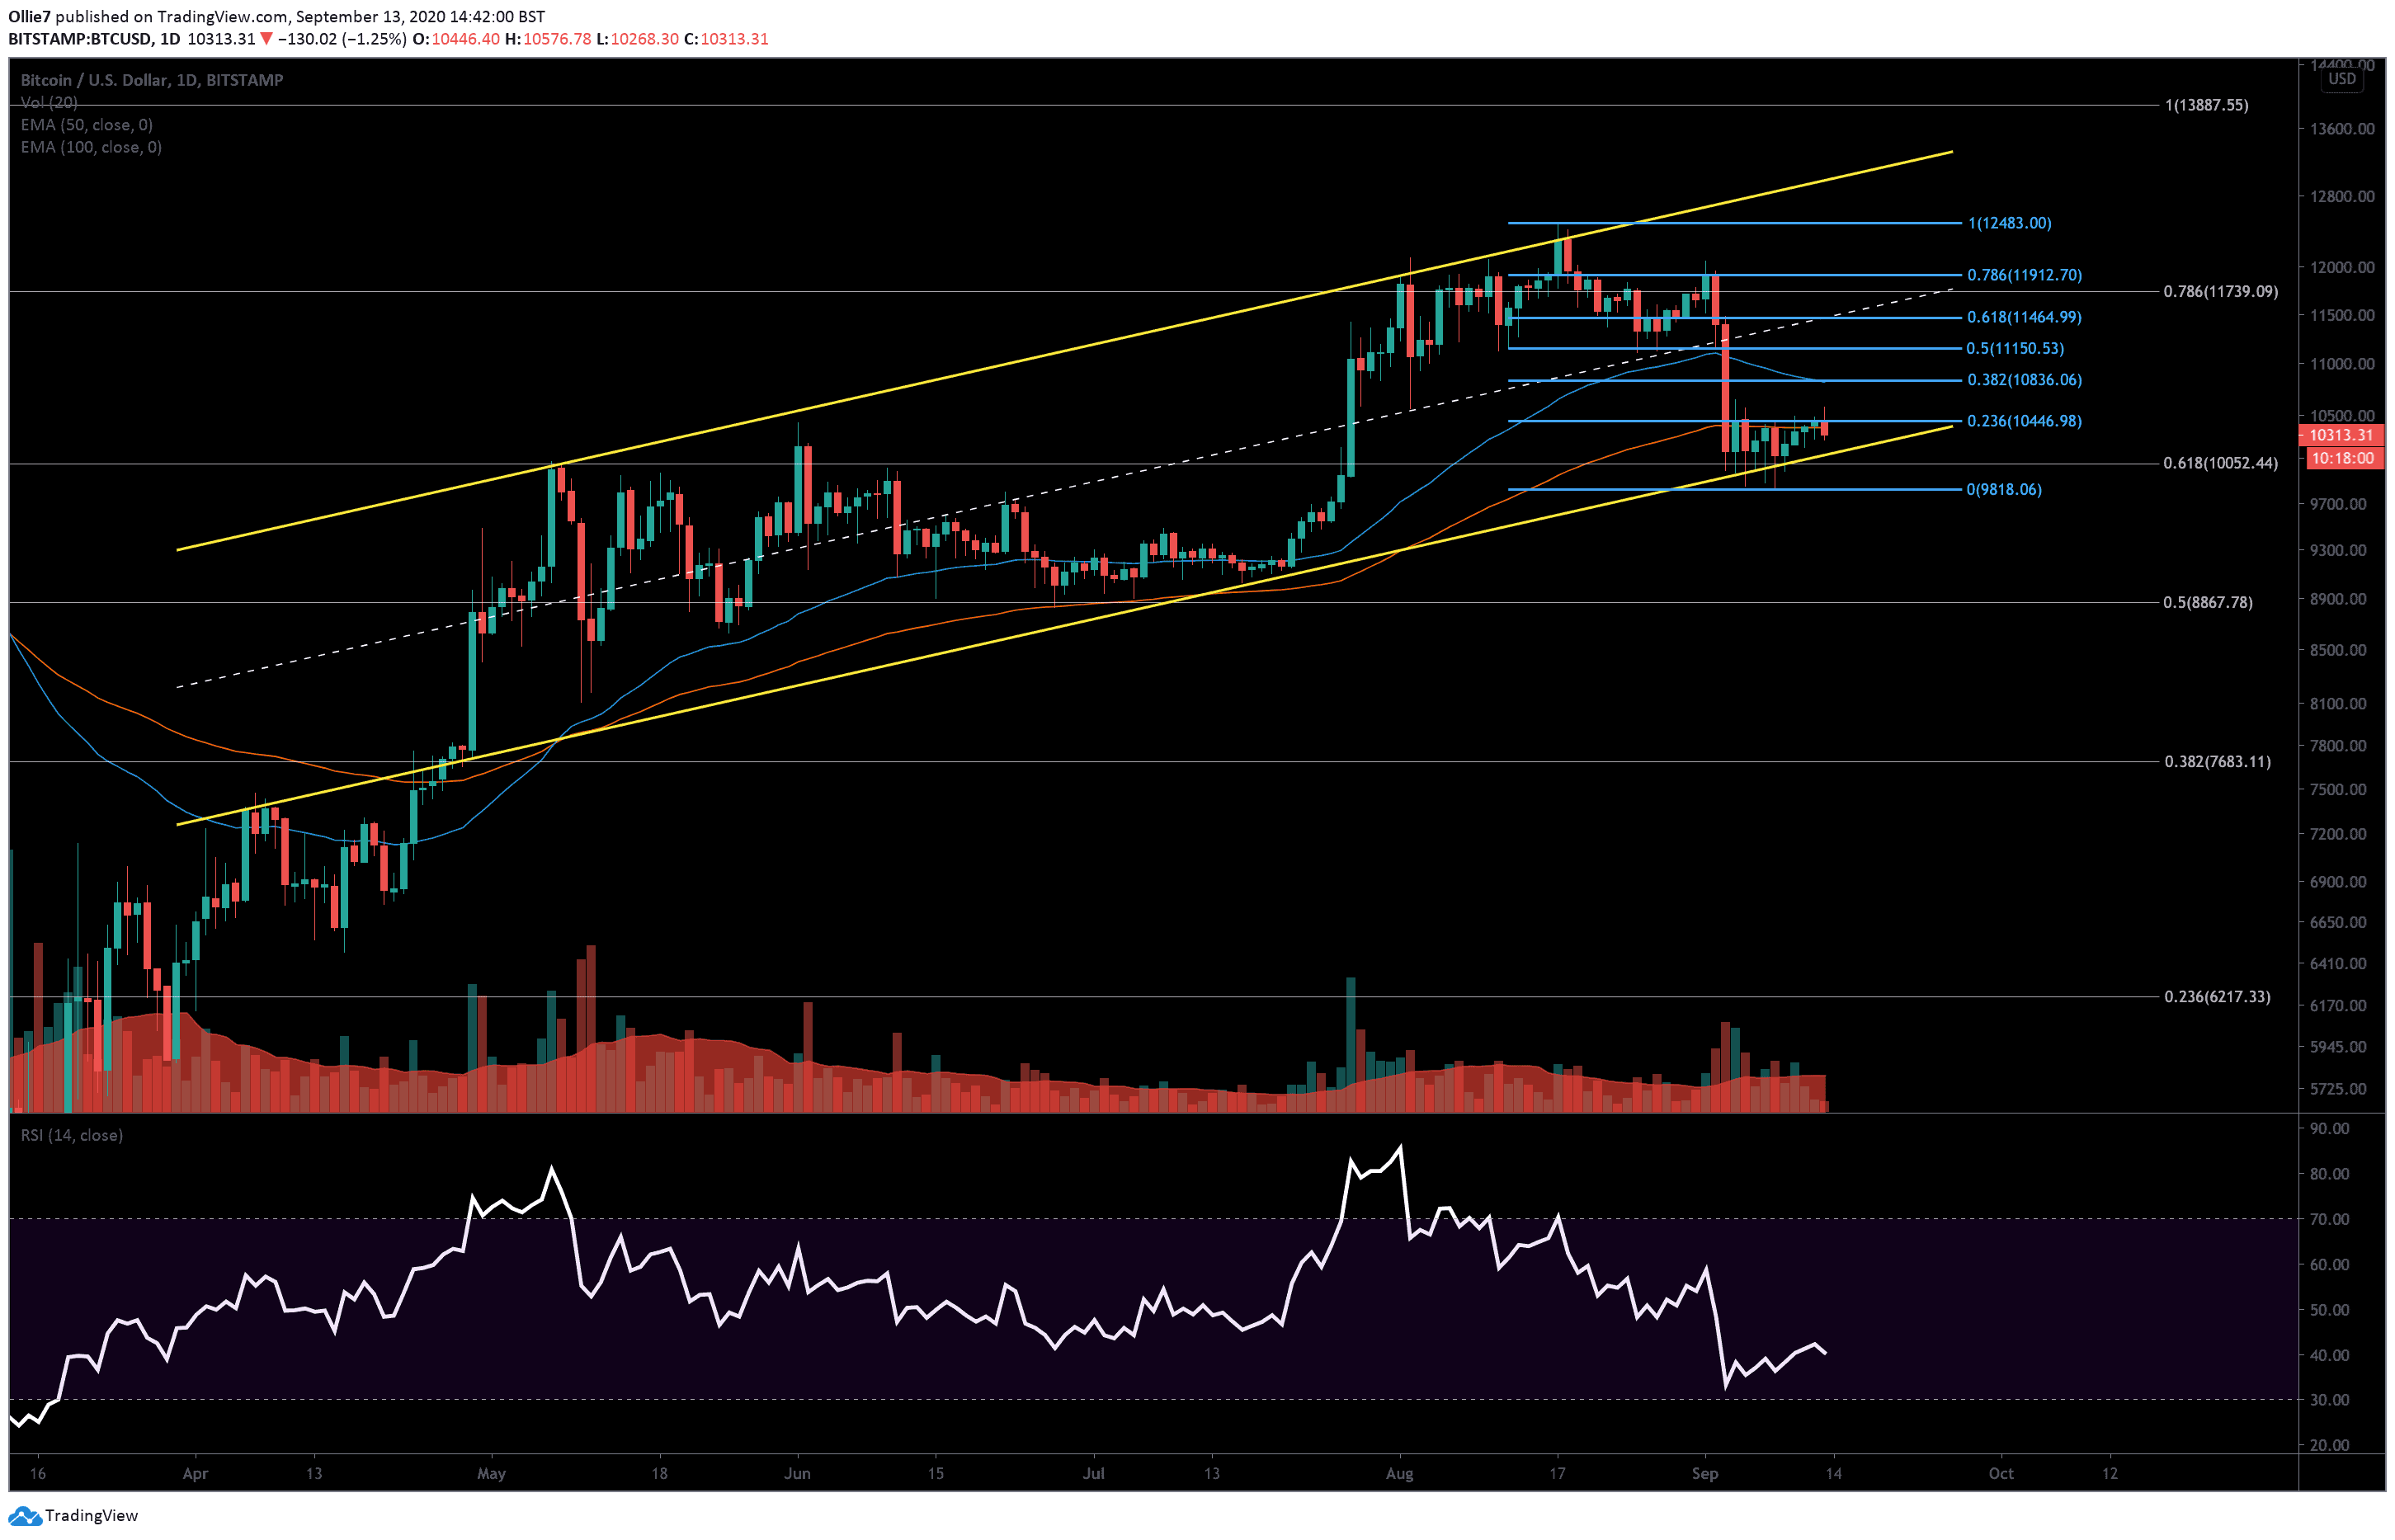
Looking at the daily BTC/USD chart, we can see that the recent rejection also coincided with prices hitting the 0.236 Fibonacci line (blue). This particular level has been a critical resistance over this time frame and has prevented Bitcoin from recovering on several occasions after the extreme flash crash on September 3.
The daily 200EMA line (red) is currently being fought over by both bullish and bearish BTC traders. This moving average has been an important S/R level for BTC prices and should provide bulls with the foothold they need to retest the upper range if they succeed in closing above it during today’s trading session.
Short-term supports to watch out for if the downtrend extends, include the $10,200, $10,170, and psychological $10K levels.
The primary channel support on the daily chart (see the yellow channel) should also be observed to get a good perspective of Bitcoin’s mid-term prospects. If Bitcoin’s price closes beneath this crucial support, it will be for the first time since April 26, 2020, which would be devastating for market confidence and bullish sentiment.
Total market capital: $344 billion
Bitcoin market capital: $190 billion
Bitcoin Dominance: 55.5%
*Data by Coingecko