Price Analysis
2 years ago

Solana Price Analysis: SOL Surges 15% Weekly, Will it Break Above $100?

Duo Nine Mar 23, 2022 15:13
SOL is quickly moving towards $100, which represents a critical resistance. The strength of this bullish momentum will soon be put to the test.

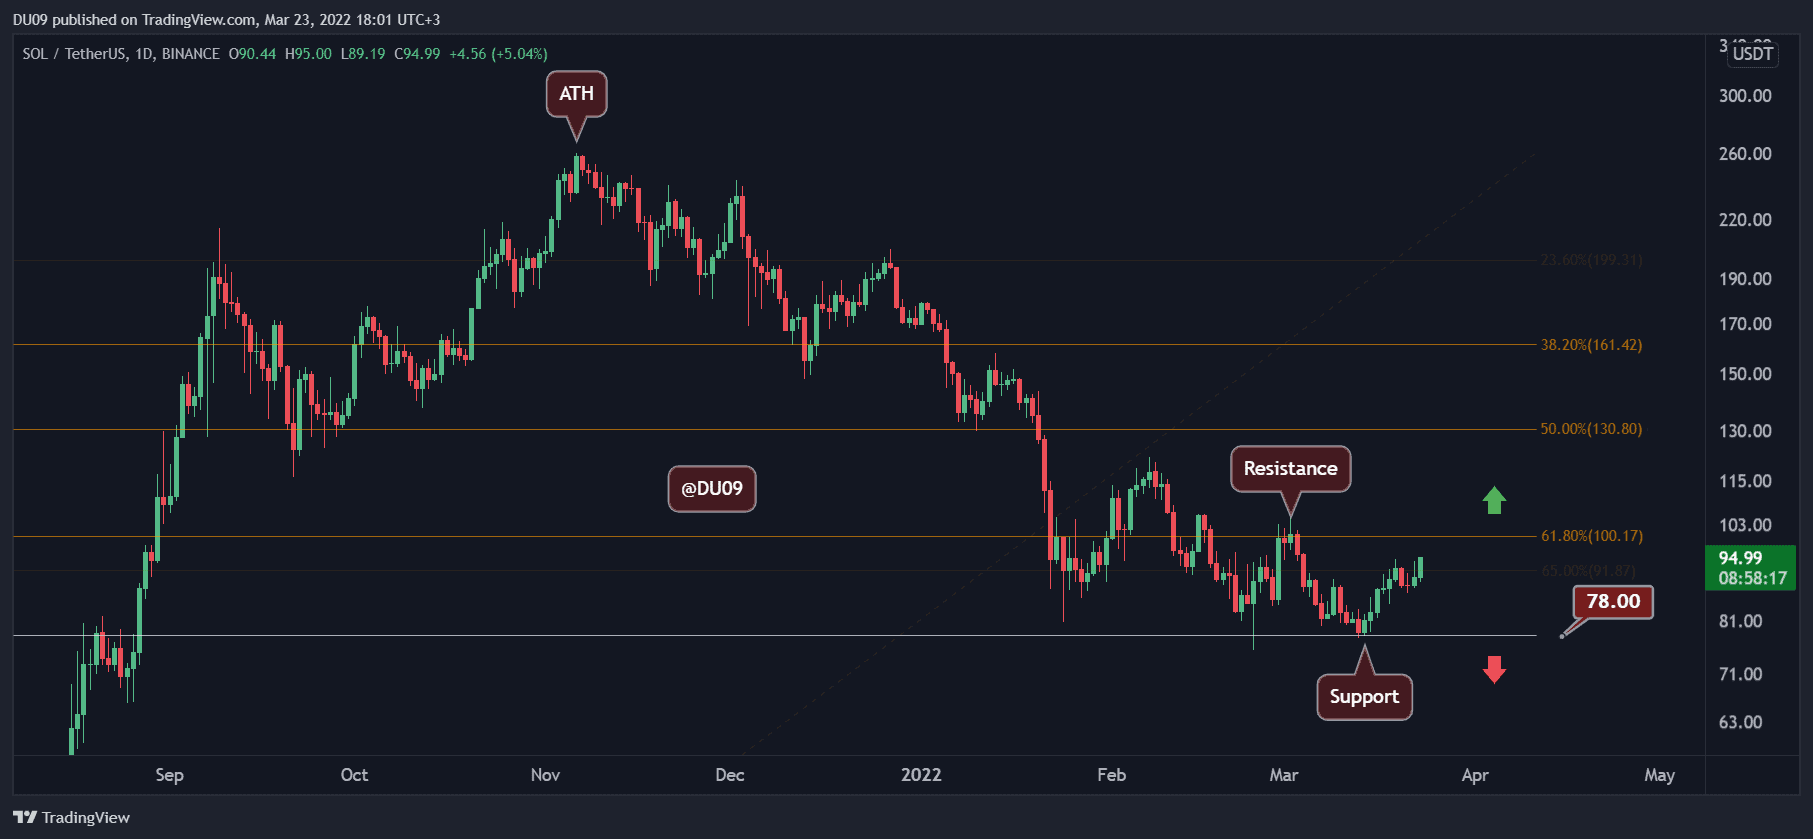
Key Support levels: $78, $56

Key Resistance level: $100, $130

In the past week, SOL has managed to find good support on the $78 level, from where price has now moved on the offensive towards the key resistance at $100. So far, buyers faced little resistance, but their resilience is about to be tested.

Chart by TradingView

Technical Indicators

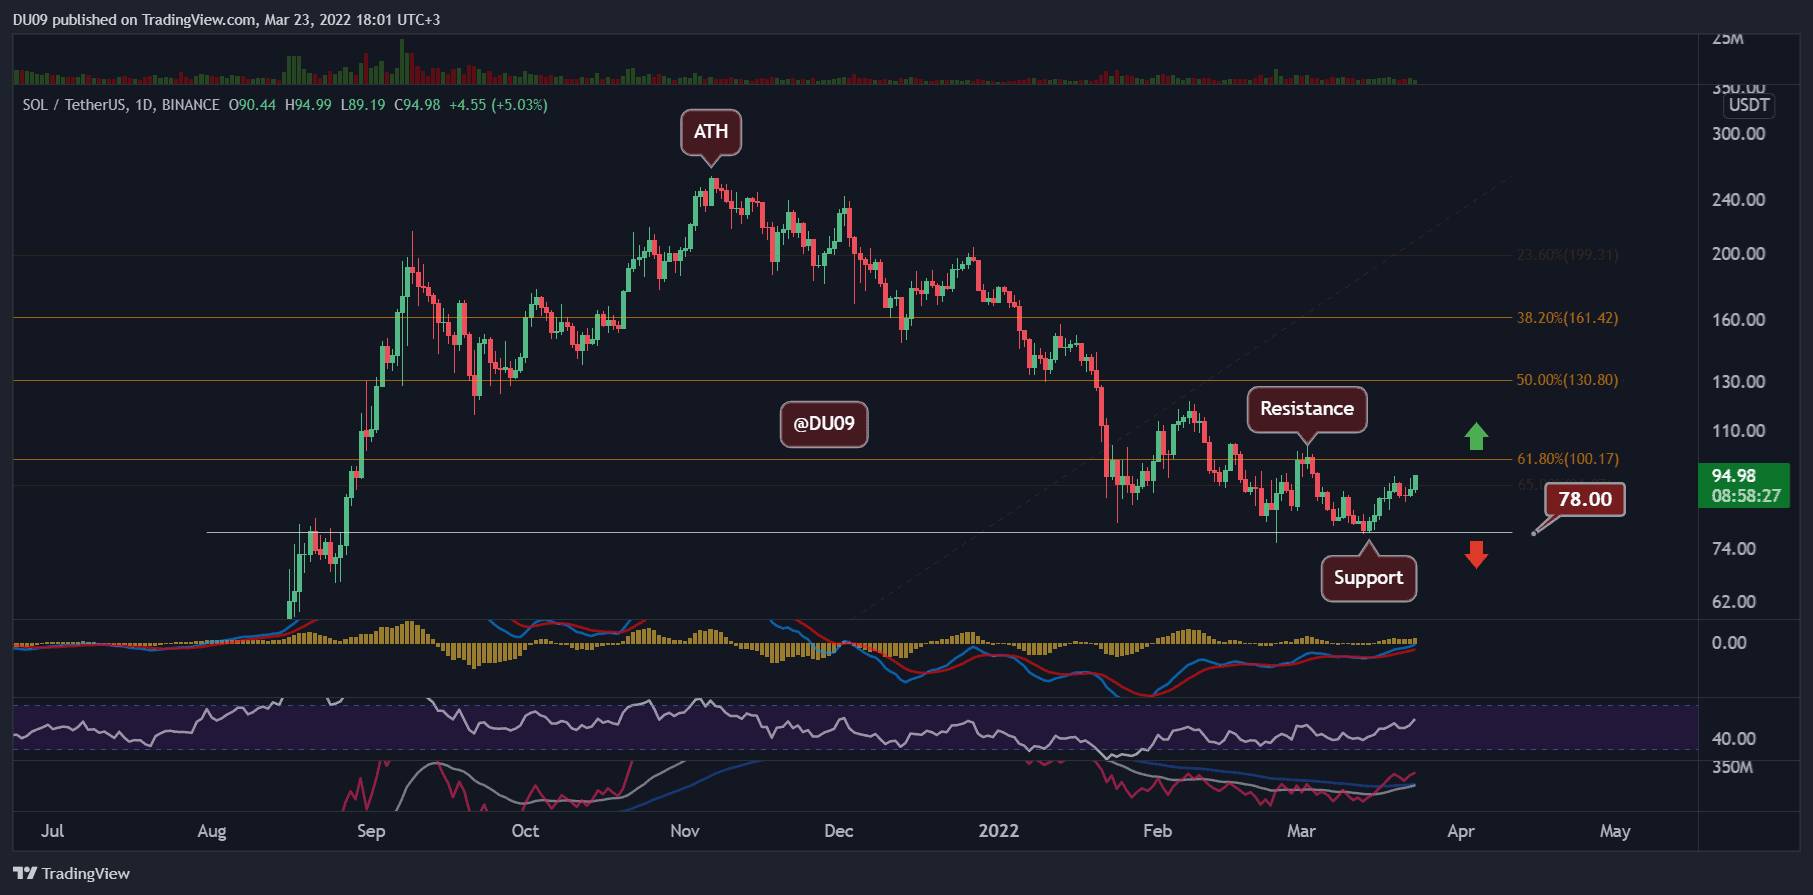
Trading Volume: The volume throughout this rally has been sustainable, which allowed the cryptocurrency to approach the $100 target.

RSI: The RSI is moving higher from its mid-point at 50 and has set a higher high. This is a good sign, and there is plenty of room left for it to move higher before becoming overbought (over 70).

MACD: The daily MACD is bullish, with the histogram making higher highs as well. Momentum is clearly on the buyers’ side right now.

Chart by TradingView

Bias

The current bias is bullish.

Short-Term Prediction for SOL Price

At this time, it seems likely that we will see SOL test the key resistance at $100 before any serious attempt by the bears to push the price into a correction. Bulls will need more volume to manage a breakout above this key level.

SPECIAL OFFER (Sponsored)
Binance Free $600 (CryptoPotato Exclusive): Use this link to register new account and receive $600 exclusive welcome offer on Binance (full details).

LIMITED OFFER 2024 for CryptoPotato readers at Bybit: Use this link to register and open a $500 BTC-USDT position on Bybit Exchange for free!


Disclaimer: Information found on CryptoPotato is those of writers quoted. It does not represent the opinions of CryptoPotato on whether to buy, sell, or hold any investments. You are advised to conduct your own research before making any investment decisions. Use provided information at your own risk. See Disclaimer for more information.

Cryptocurrency charts by TradingView.
Share This Article
Duo Nine

Duo Nine is crypto educator and a seasoned technical analyst with over seven years of experience in price action trading. After buying his first Bitcoin in 2014, Duo never left this space. He also has a cool crypto community on Discord with over 4,000 members where he posts charts, opinions on the market and guides new members. Contact: Twitter | Community