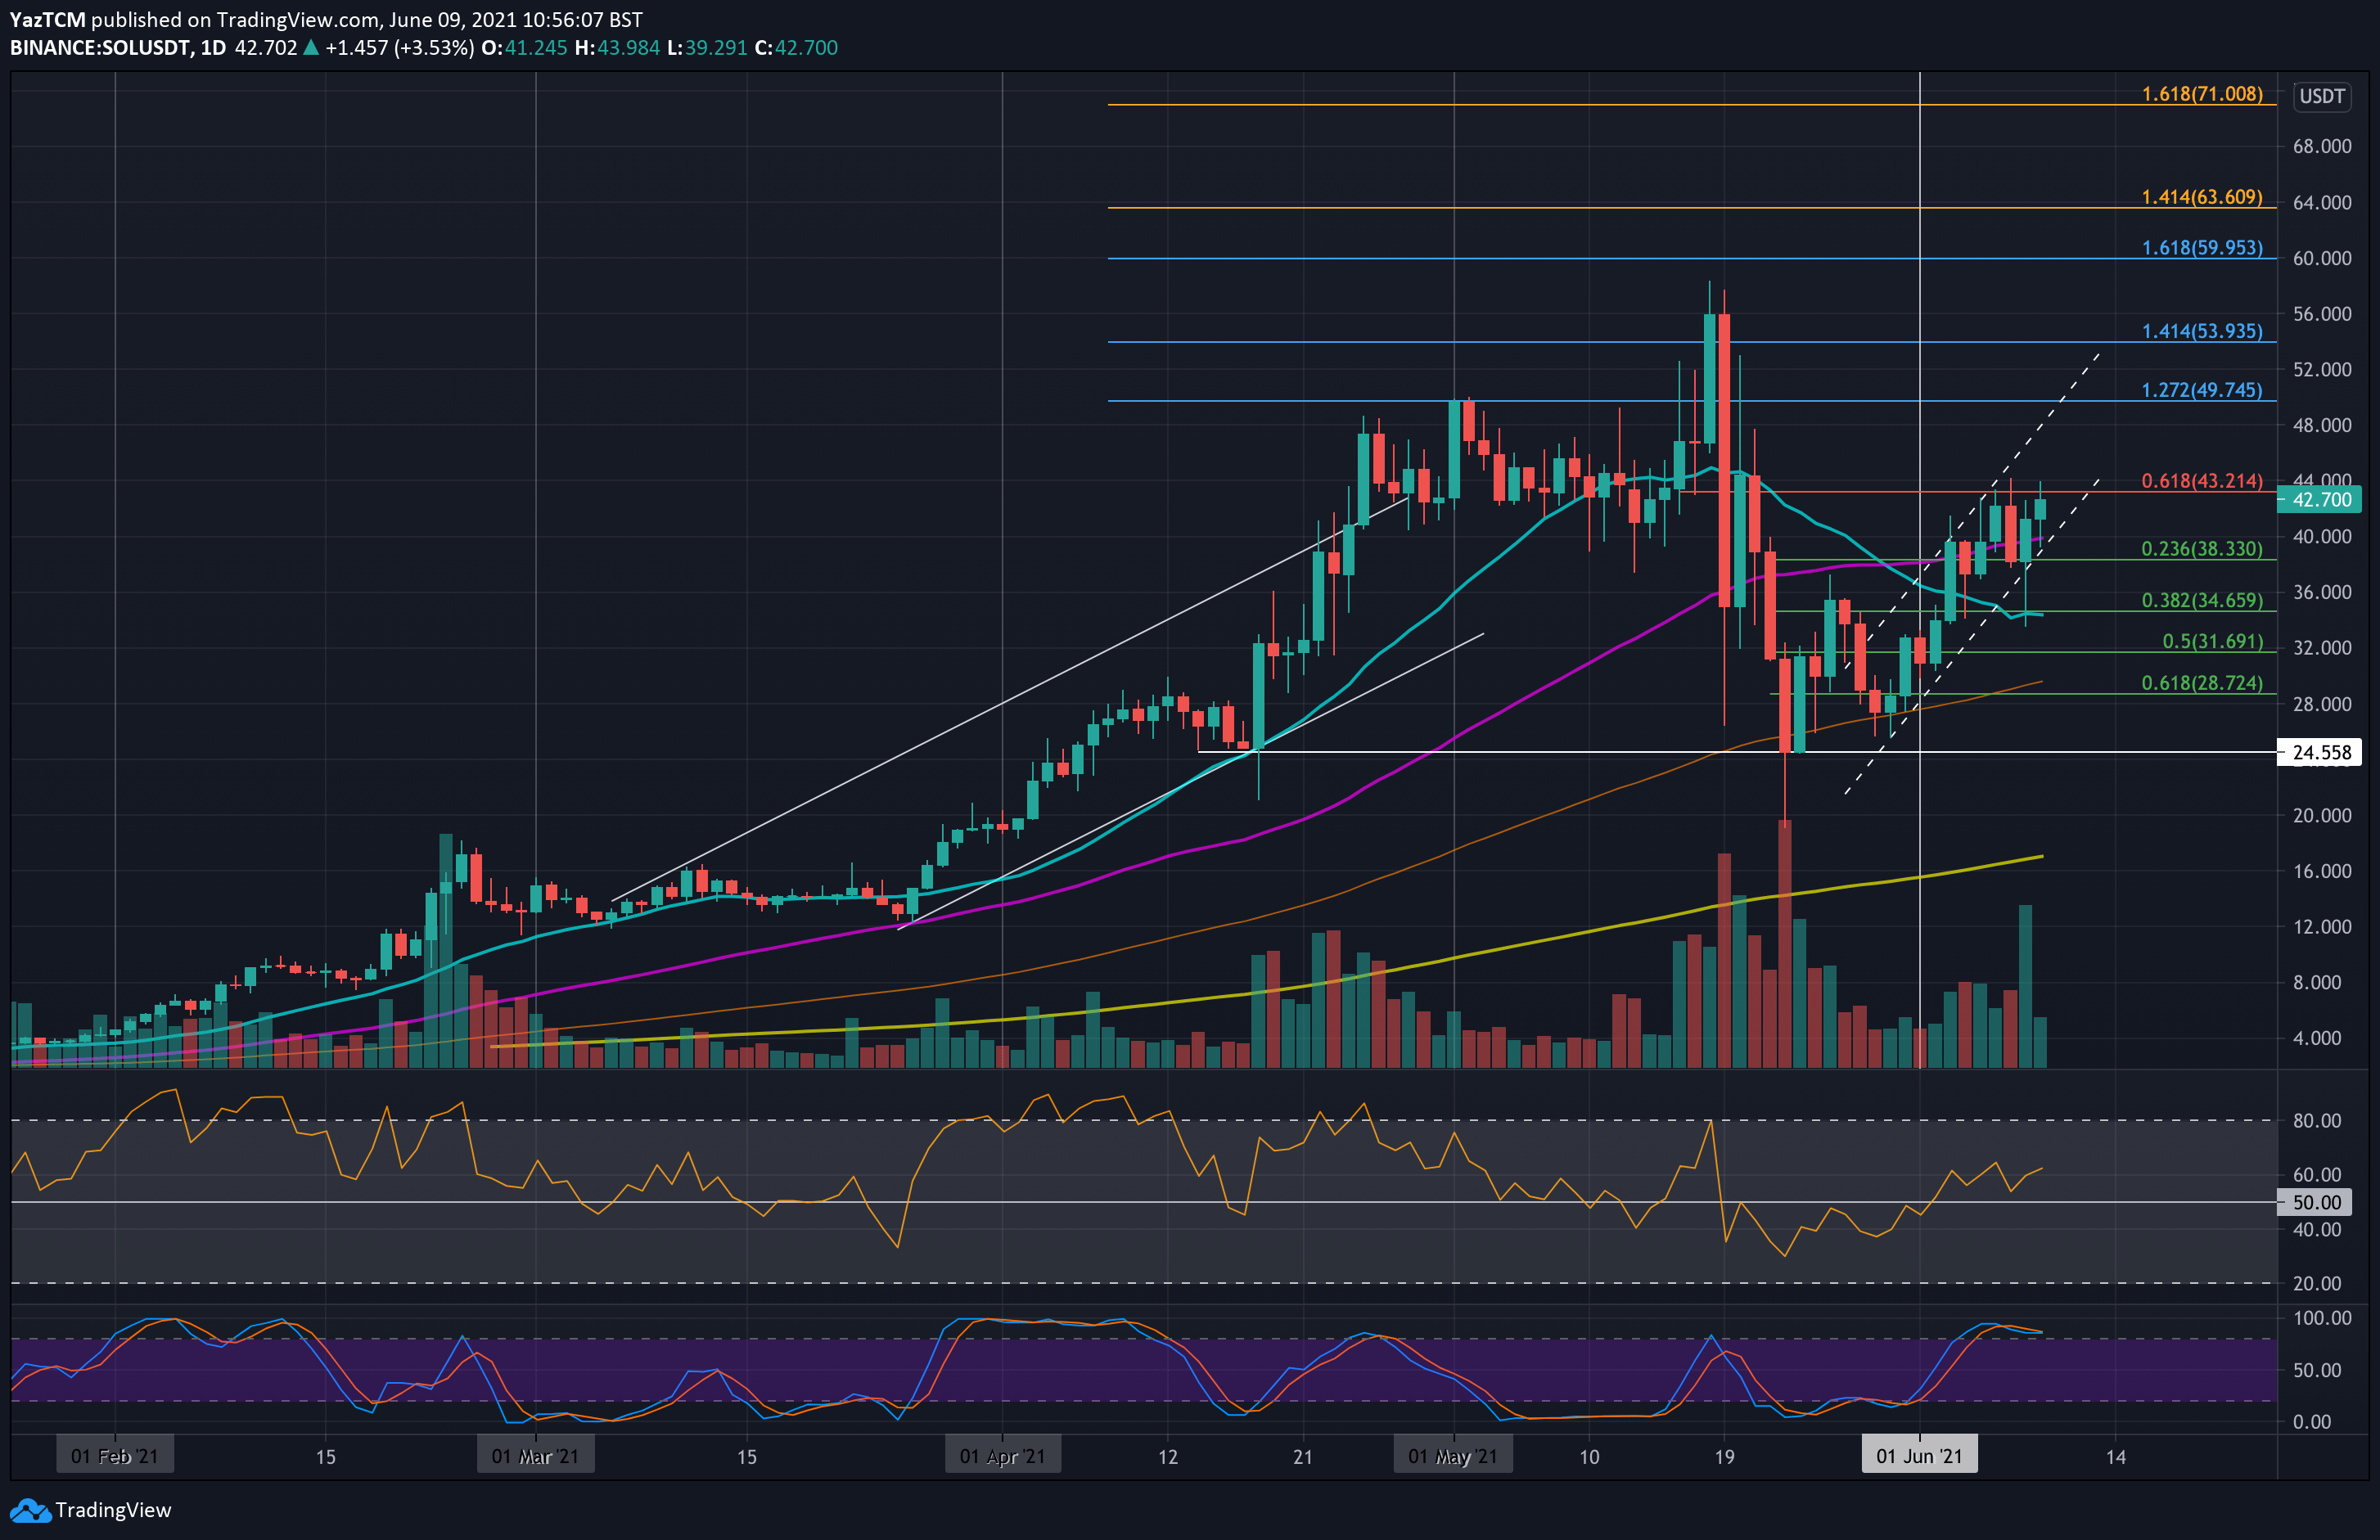
SOL/USD Daily Chart. Source: TradingView.
Key Support Levels: $40, $38.33, $34.65.
Key Resistance Levels: $44, $50, $52.
SOL is the highest performing top-25 ranked coin after surging 39.5% this week. The cryptocurrency climbed by another 18% today, allowing it to break back above the $40 level and test resistance at $44.
The coin found support at $24.55 during the May capitulation and has since rebounded to trade inside a rising price channel. The surge seen over the past 24-hours allowed it to rise above the 50-day MA at $40 and hit resistance at a bearish .618 Fib.
Looking ahead, the first resistance lies at $44 (bearish .618 Fib). This is followed by $50 (1.272 Fib Extension), $52, $54 (1.414 Fib Extension), and $58 (ATH Price). Additional resistance lies at $60 (1.618 Fib Extension) and $63.60 (1.414 Fib Extension -orange).
On the other side, the first support lies at $40 (50-day MA & lower boundary of price channel). This is followed by $38.33 (.236 Fib), $34.65 (.382 Fib & 20-day MA), $31.70 (.5 Fib), and $29.
The RSI is now above the 60 level, indicating that the bullish momentum is increasing within the market. To break the current $44 resistance, the RSI must pass the early June peak to indicate that the buying momentum is still increasing.
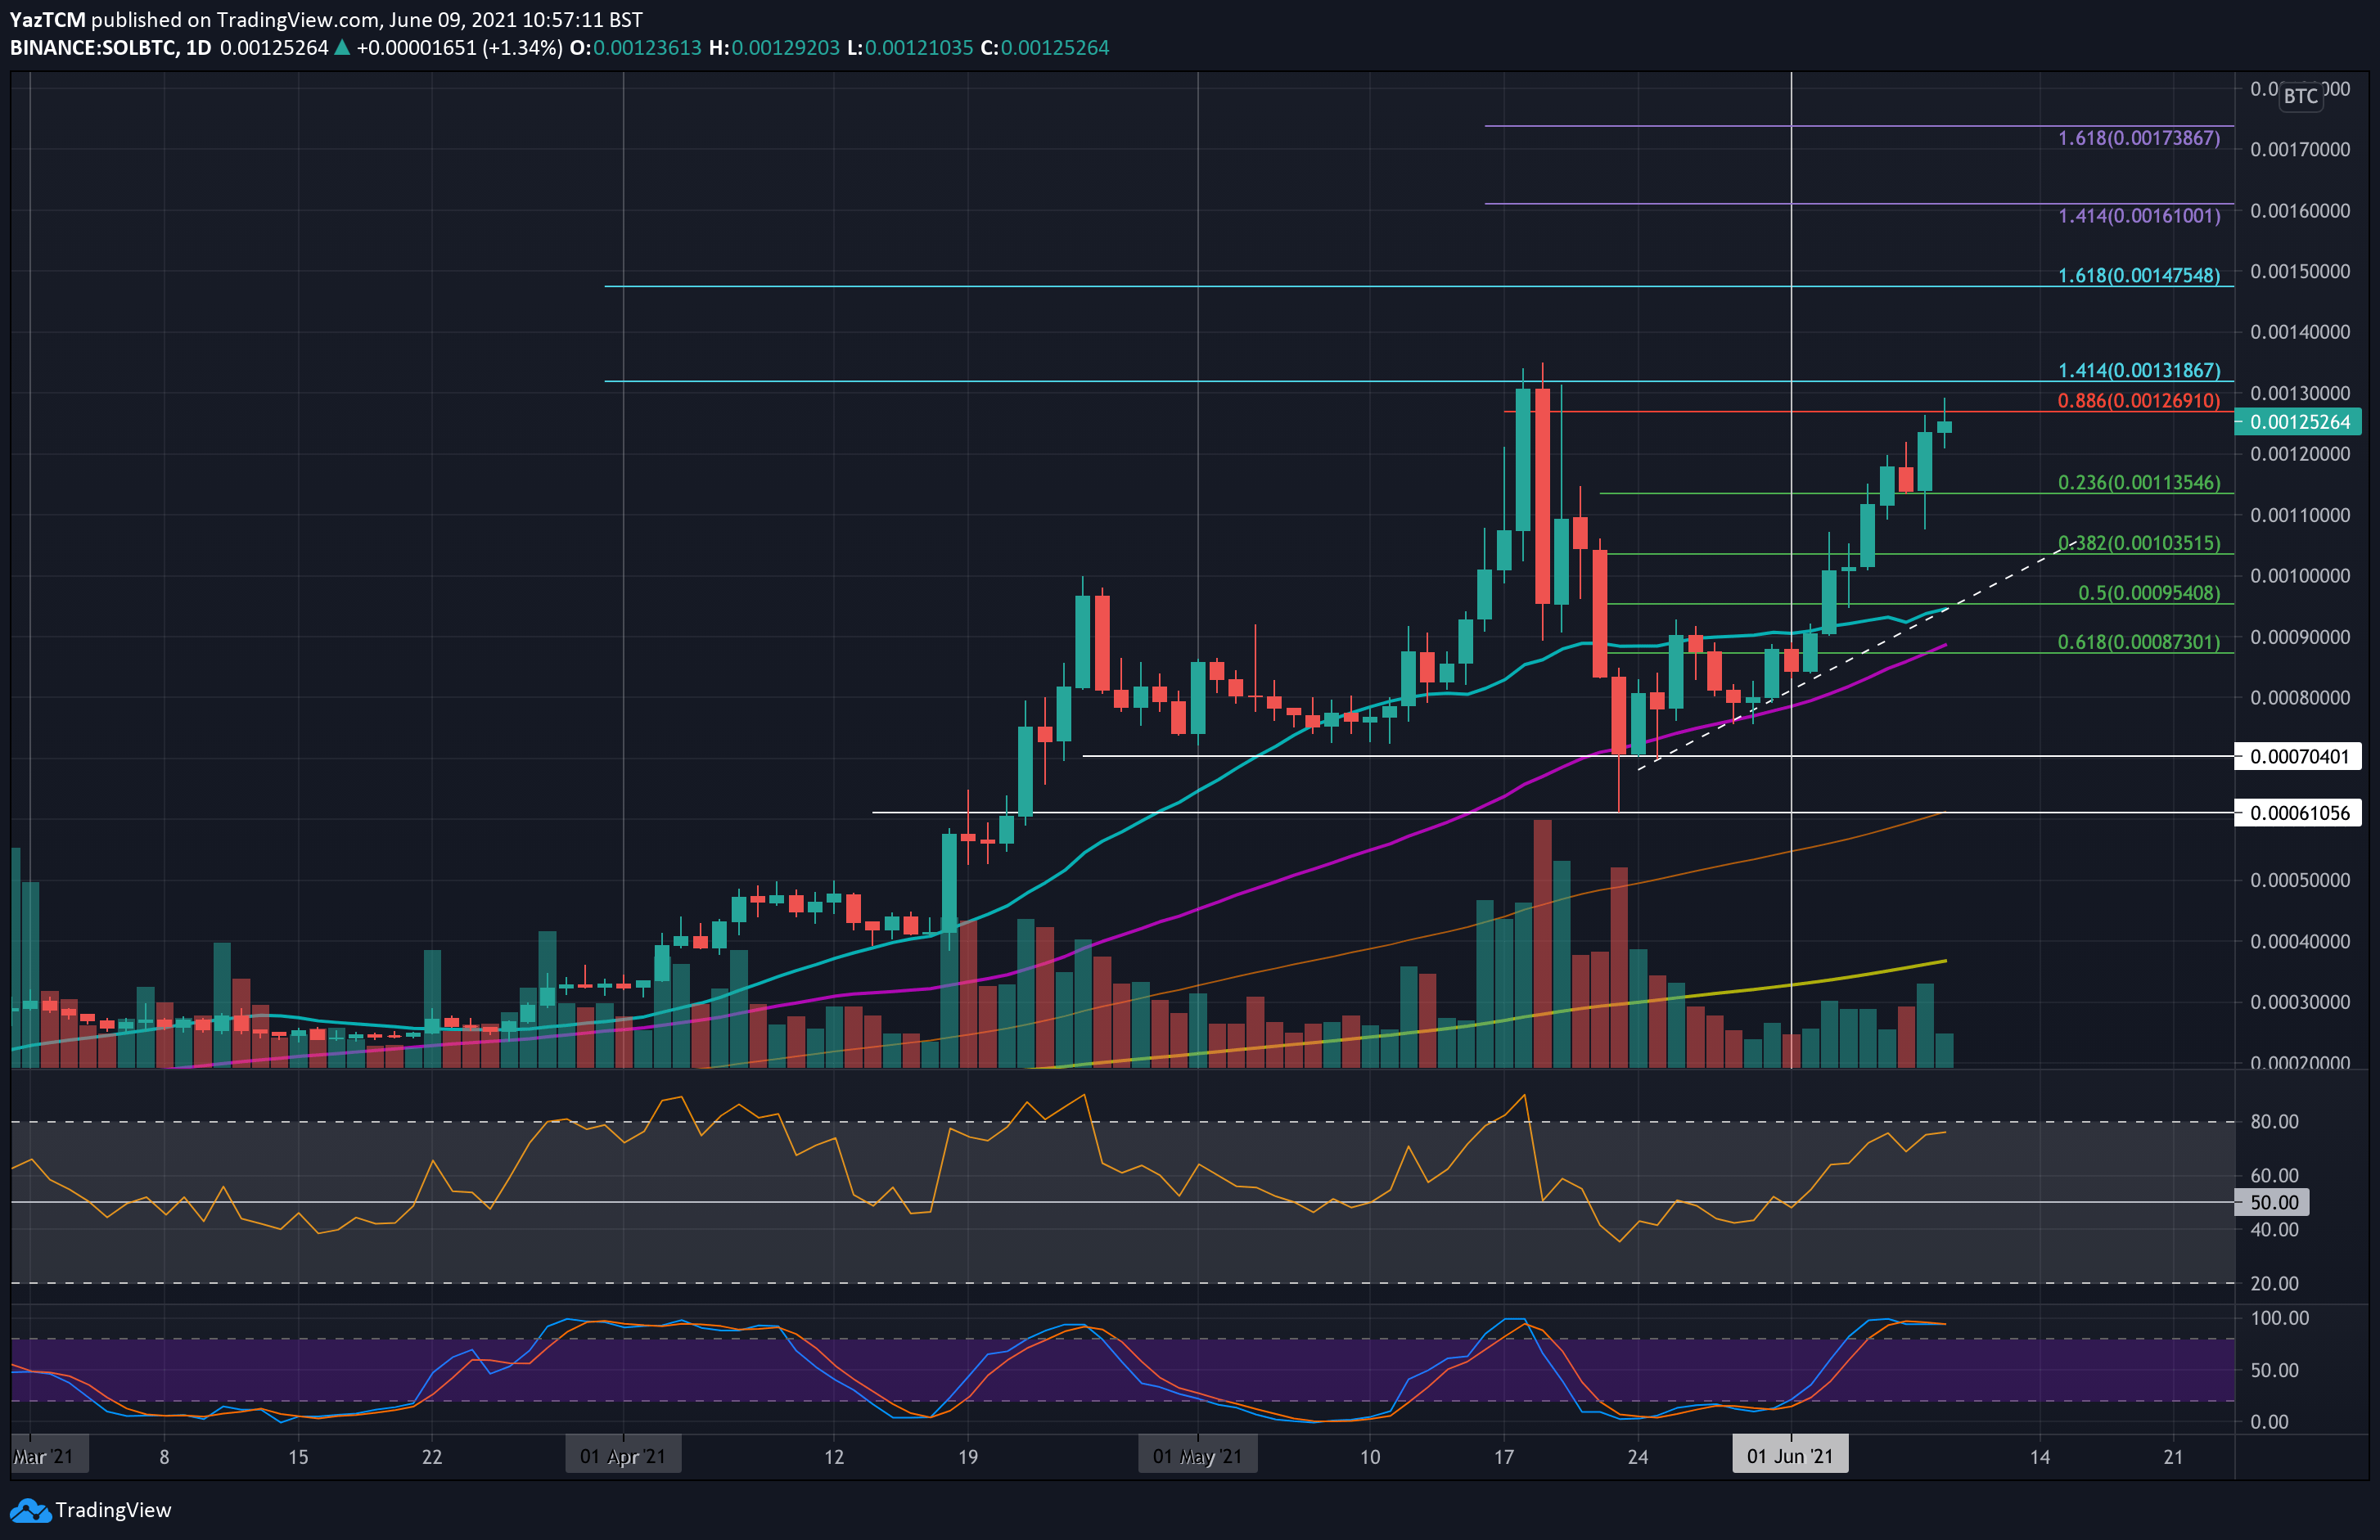
Key Support Levels: 0.0012 BTC, 0.00113 BTC, 0.0011 BTC.
Key Resistance Levels: 0.,00127 BTC, 0.00131 BTC, 0.0014 BTC.
Against bitcoin, SOL is almost trading at the previous ATH price near 0.00131 BTC. The coin found solid support at 0.000704 BTC (200-day MA) during the May capitulation and has since rebounded from there.
At the start of June, SOL surged above the 20-day MA at 0.0009 BTC and has continued higher since. It penetrated above resistance at 0.0012 BTC yesterday and reached as high as 0.00129 BTC today.
Moving forward, the first resistance lies at 0.00127 BTC (bearish .886 Fib). This is followed by 0.00131 BTC (1.414 Fib Extension & ATH), 0.0014 BTC, and 0.001475 BTC (1.618 Fib Extension).
On the other side, the first support lies at 0.0012 BTC. This is followed by 0.00113 BTC (.236 Fib), 0.0011 BTC, 0.00103 BTC (.382 Fib), and 0.001 BTC (rising trend line).
The RSI is approaching overbought conditions but still has room to push higher before the buyers become overextended. This indicates that the bulls should have sufficient momentum to be able to crack the ATH in the coming days.