In mid-July, Bitcoin attempted multiple times to break the significant resistance at $30K but ultimately failed and declined toward the 100-day moving average.
Nevertheless, the price is currently trading within a critical range, and a breakout could trigger a substantial price movement.
By Shayan
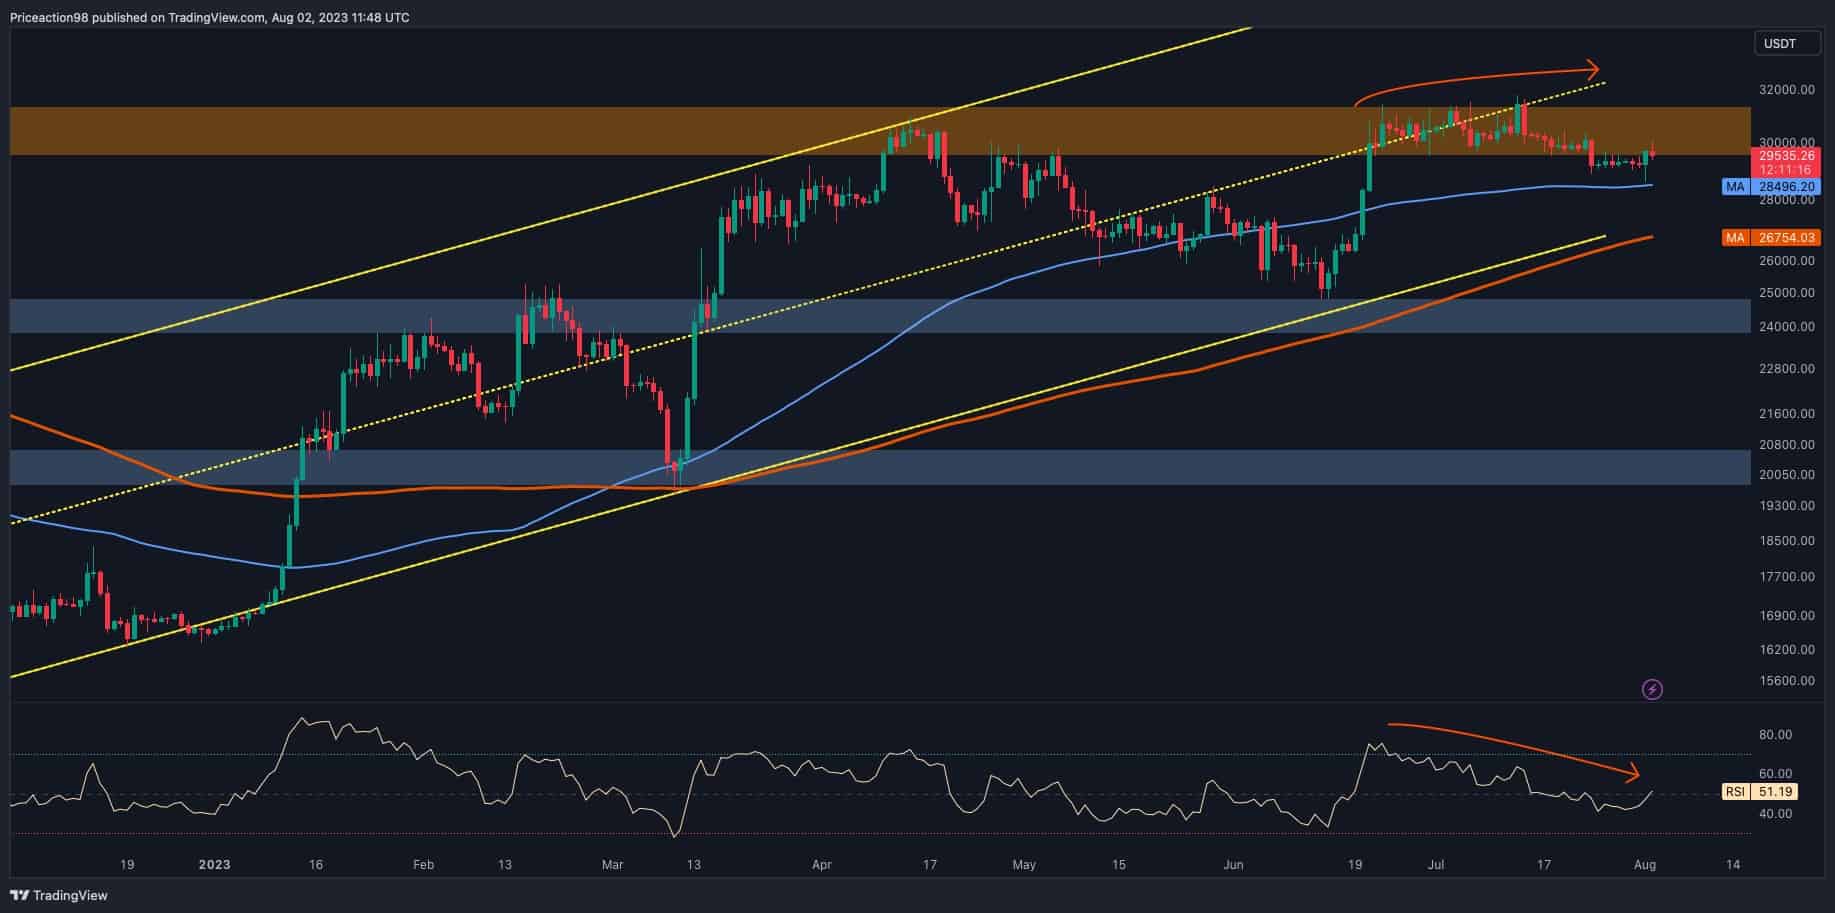
On the daily chart, the 100-day moving average is acting as a support level, preventing further declines. However, it has been unable to push the price back above the $30K mark in the last few months.
Also, the prolonged divergence between the price and the RSI indicator suggests a possibility of a downside break, potentially pushing the price toward the 200-day moving average of around $27K.
The 200-day MA is a significant indicator that could act as support and propel the price higher, as it did back in February. Alternatively, if the price manages to climb back above the key $30K level, it may trigger a rally toward the $38K resistance zone in the upcoming weeks.
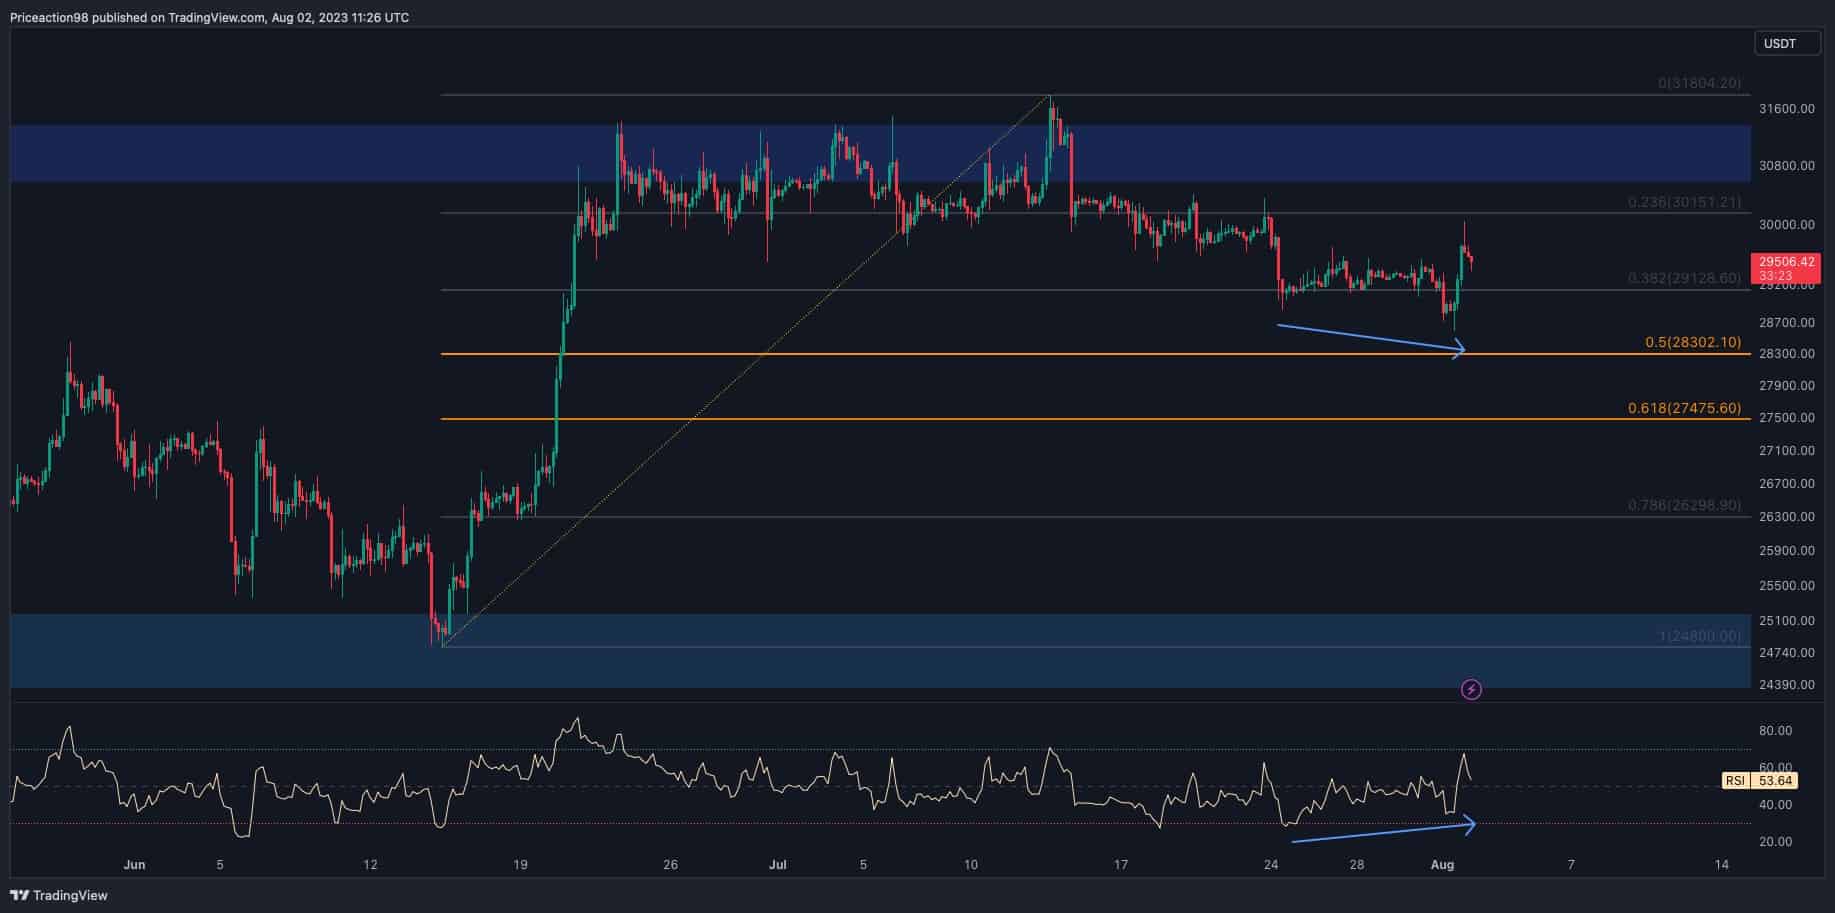
On the 4-hour chart, the situation for BTC looks intriguing. Following the correction that began in early July, the price has reached the 0.5 and 0.618 Fibonacci retracement levels, which serve as crucial support and could potentially halt the recent downward spiral.
If the price finds support around this level, it is likely to enter a new bullish phase and surge higher. However, there is still a chance for a break below the price range between the 0.5 and 0.618 Fibonacci levels, which would be concerning.
In such a scenario, a breakdown might lead to a rapid decline toward the $25K support level in the short term.
By Shayan
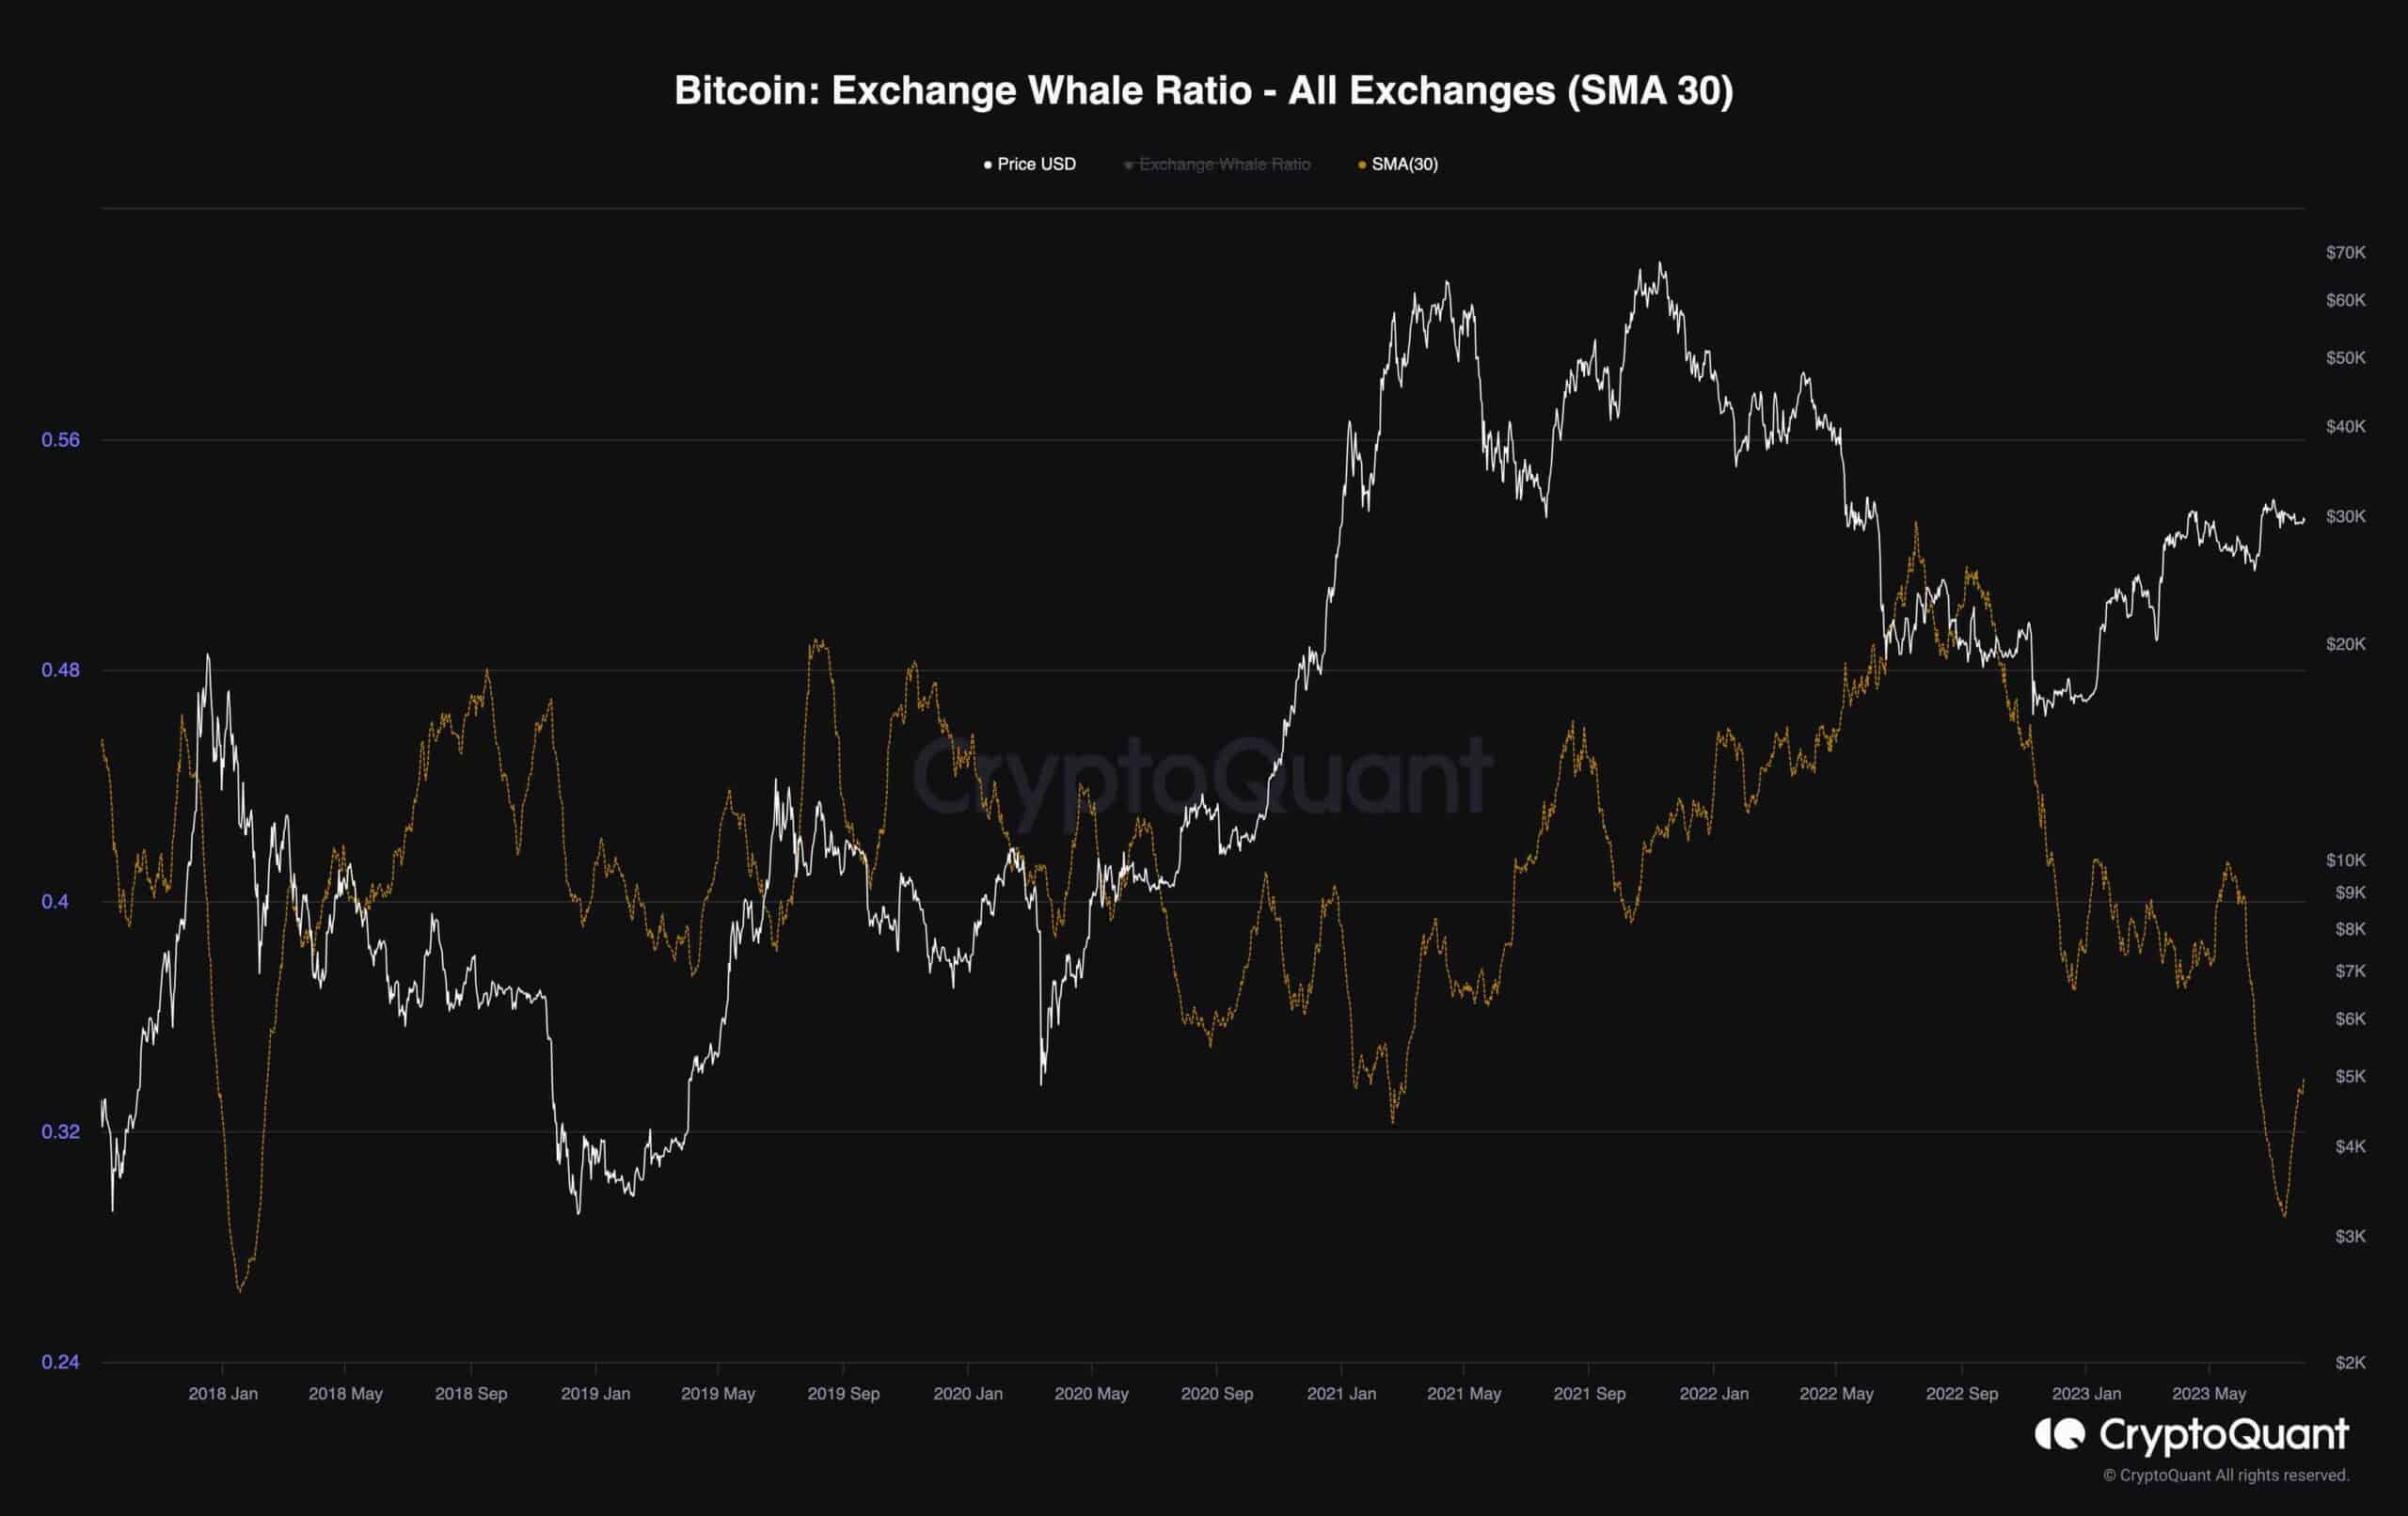
The “Exchange Whale Ratio” measures the proportion of the top 10 large inflows to the total inflows on a cryptocurrency exchange. High values of this ratio suggest that significant amounts of funds from large players, commonly referred to as “whales,” are being deposited into the exchange.
Currently, the Exchange Whale Ratio is at its lowest level, with the last instance of such low levels observed back in February 2018. When this ratio is low, it may not have an immediate impact, but historically, when it experiences a rebound, it tends to affect the price of Bitcoin (BTC) adversely.
For instance, in February 2018 and again in May 2021, when the ratio rebounded from an all-time low, the price of BTC reached its peak and subsequently started declining. This indicates that when the ratio increases, suggesting a surge in whale activity on exchanges, it could signal a potential downward trend in BTC’s price.
Since the fourth quarter of 2022, the Exchange Whale Ratio has been steadily declining, and during this period, there hasn’t been a significant drop in BTC’s price. However, it is essential to monitor this ratio closely as it could bounce back at any time, following historical patterns, potentially leading to changes in BTC’s price trajectory.