Chart by TradingView
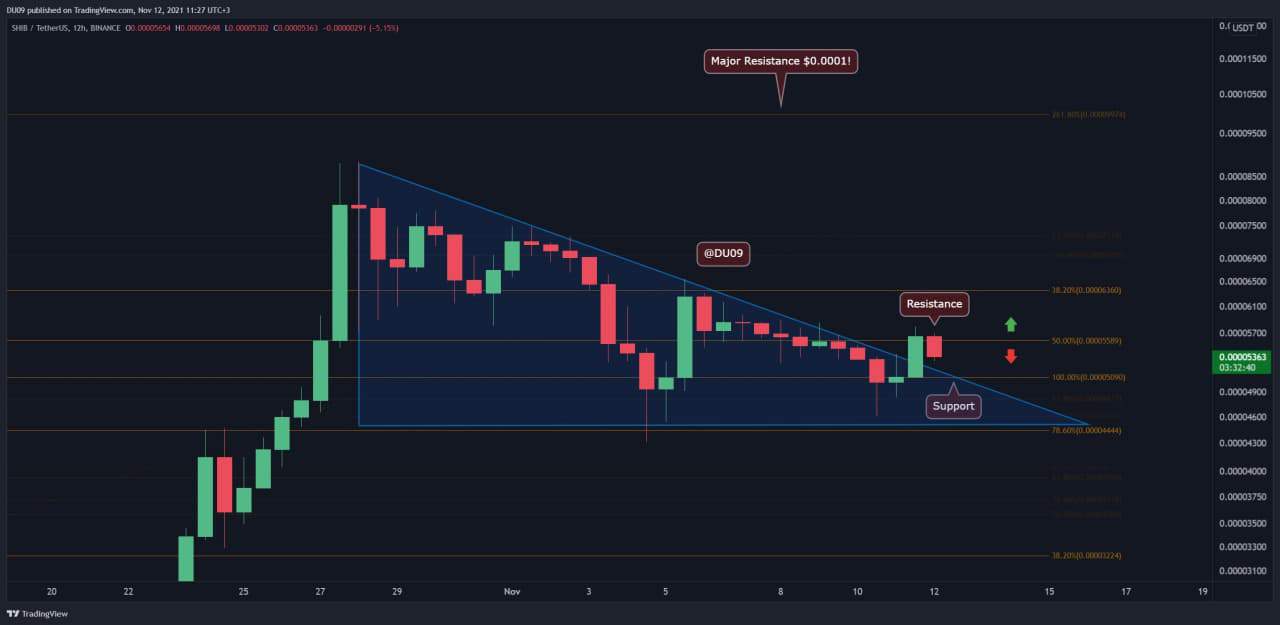
Key Support level: $0.000050; $0.000044
Key Resistance level: $0.000055; $0.000063
SHIB bulls managed to push the price all the way to the resistance at $0.000055 after breaking away from the blue triangle. At one point, the price was up about 20% from the daily low.
The bullish signals hinting at this possibility were already discussed in our last SHIB analysis from yesterday. The current price action confirmed this scenario, and if the bulls manage to turn the top of this descending triangle into support at around $0.000050, they have a good chance to break above the current resistance. If not, the bears may take over again.
Note that this latest rejection at resistance can be interpreted as another lower low on the chart. The bulls really need to push higher if the trend is to change. Therefore, any celebrations might be premature.
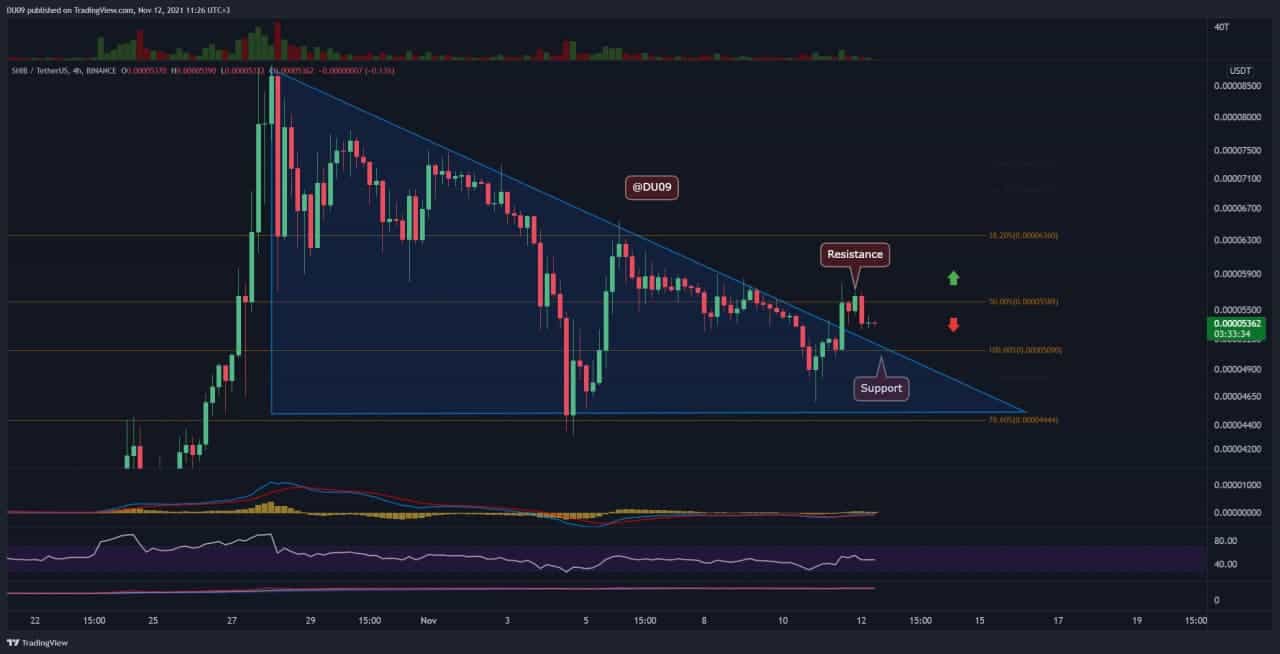
Trading Volume: Good volume on the breakout from the triangle. But this quickly faded as price approached the resistance.
RSI: The RSI just did a higher high on the 4-hour timeframe. This is bullish after also making a higher low previously. However, the bulls need to sustain the positive momentum so that on the daily timeframe, the RSI can curve back up.
MACD: The MACD did a bullish cross on the 4-hour timeframe, this is a good start towards a potential reversal. On the daily timeframe, the MACD histogram also made a higher low which may indicate the bearish trend is coming to an end.
The bias on SHIB has turned bullish with this breakout. However, to maintain this bias, SHIB price must not fall under $0.000050.
SHIB looks like it has a good chance to return to the uptrend. This latest move has turned the bias to bullish, and if the price manages to hold at the $0.000050 support, then it has a real chance to turn the indicators on larger timeframes like daily bullish again. Until SHIB breaks the current resistance at $0.000055, it’s expected to see the price bounce between these two levels as the bulls and bears fight for dominance.