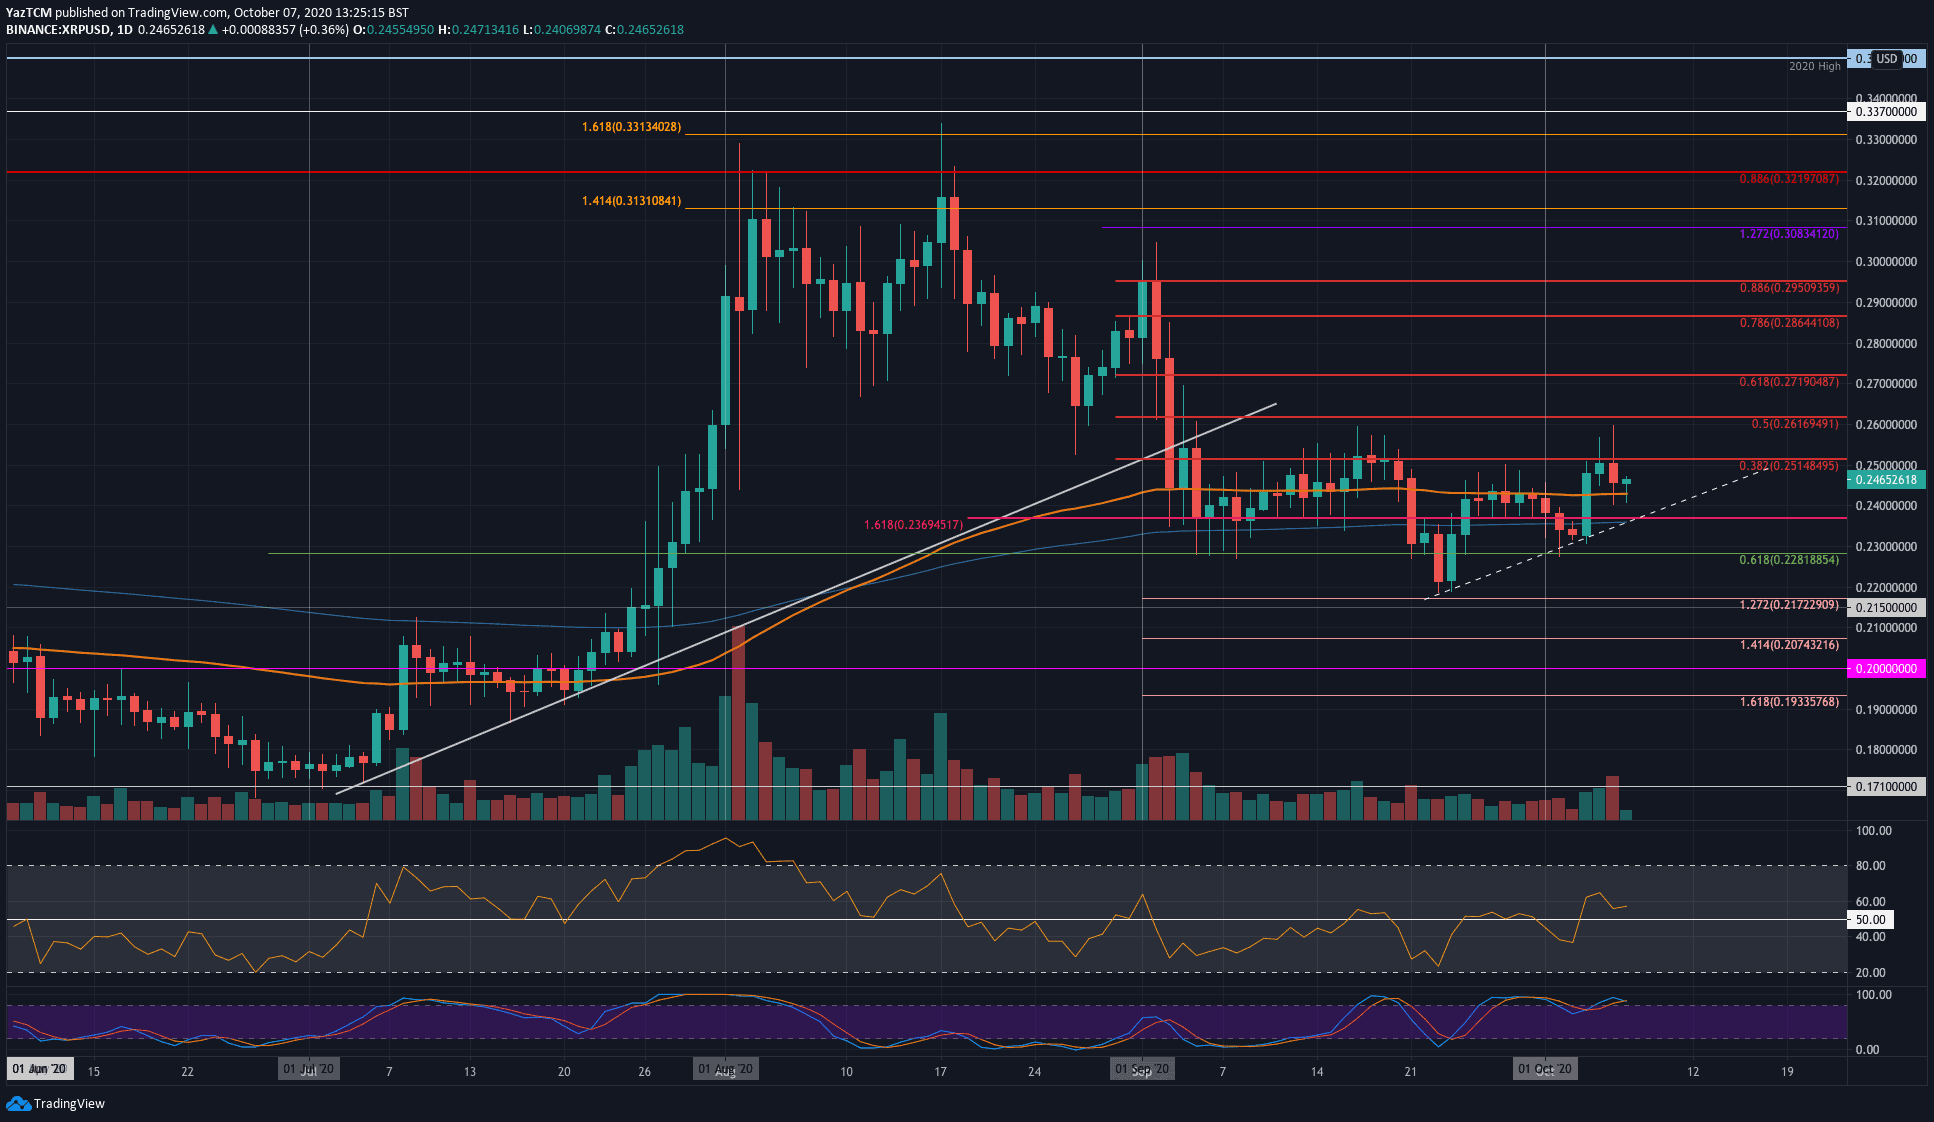
XRP/USD Daily Chart. Source: TradingView
Key Support Levels: $0.24, $0.236, $0.23.
Key Resistance Levels: $0.251, $0.261, $0.271.
XRP rebounded from a rising trend line on Sunday which saw the coin breaking above the 100-days EMA to reach the resistance at $0.251 (bearish .382 Fib Retracement). During this week, XRP managed to spike as high as $0.26 but is still yet to close a daily candle above the resistance at the bearish .382 Fib Retracement.
Yesterday, after failing to break the $0.251 resistance, XRP headed lower but managed to close the daily candle above the 100-days EMA. Today, the bulls are also battling to remain above the 100-days EMA as they refuse to relinquish their control of the market momentum.
Looking ahead, the first level of resistance lies at $0.251 (bearish .382 Fib). This is followed by resistance at $0.261 (bearish .5 Fib), $0.271 (bearish .618 Fib), and $0.28.
On the other side, the first level of support lies at the 100-days EMA. This is followed by support at $0.24, $0.236 (200-days EMA), and $0.23, and $0.228 (.618 Fib Retracement).
The RSI remains above the mid-line, however, the Stochastic RSI is overbought and is shaping up for a bearish crossover signal.
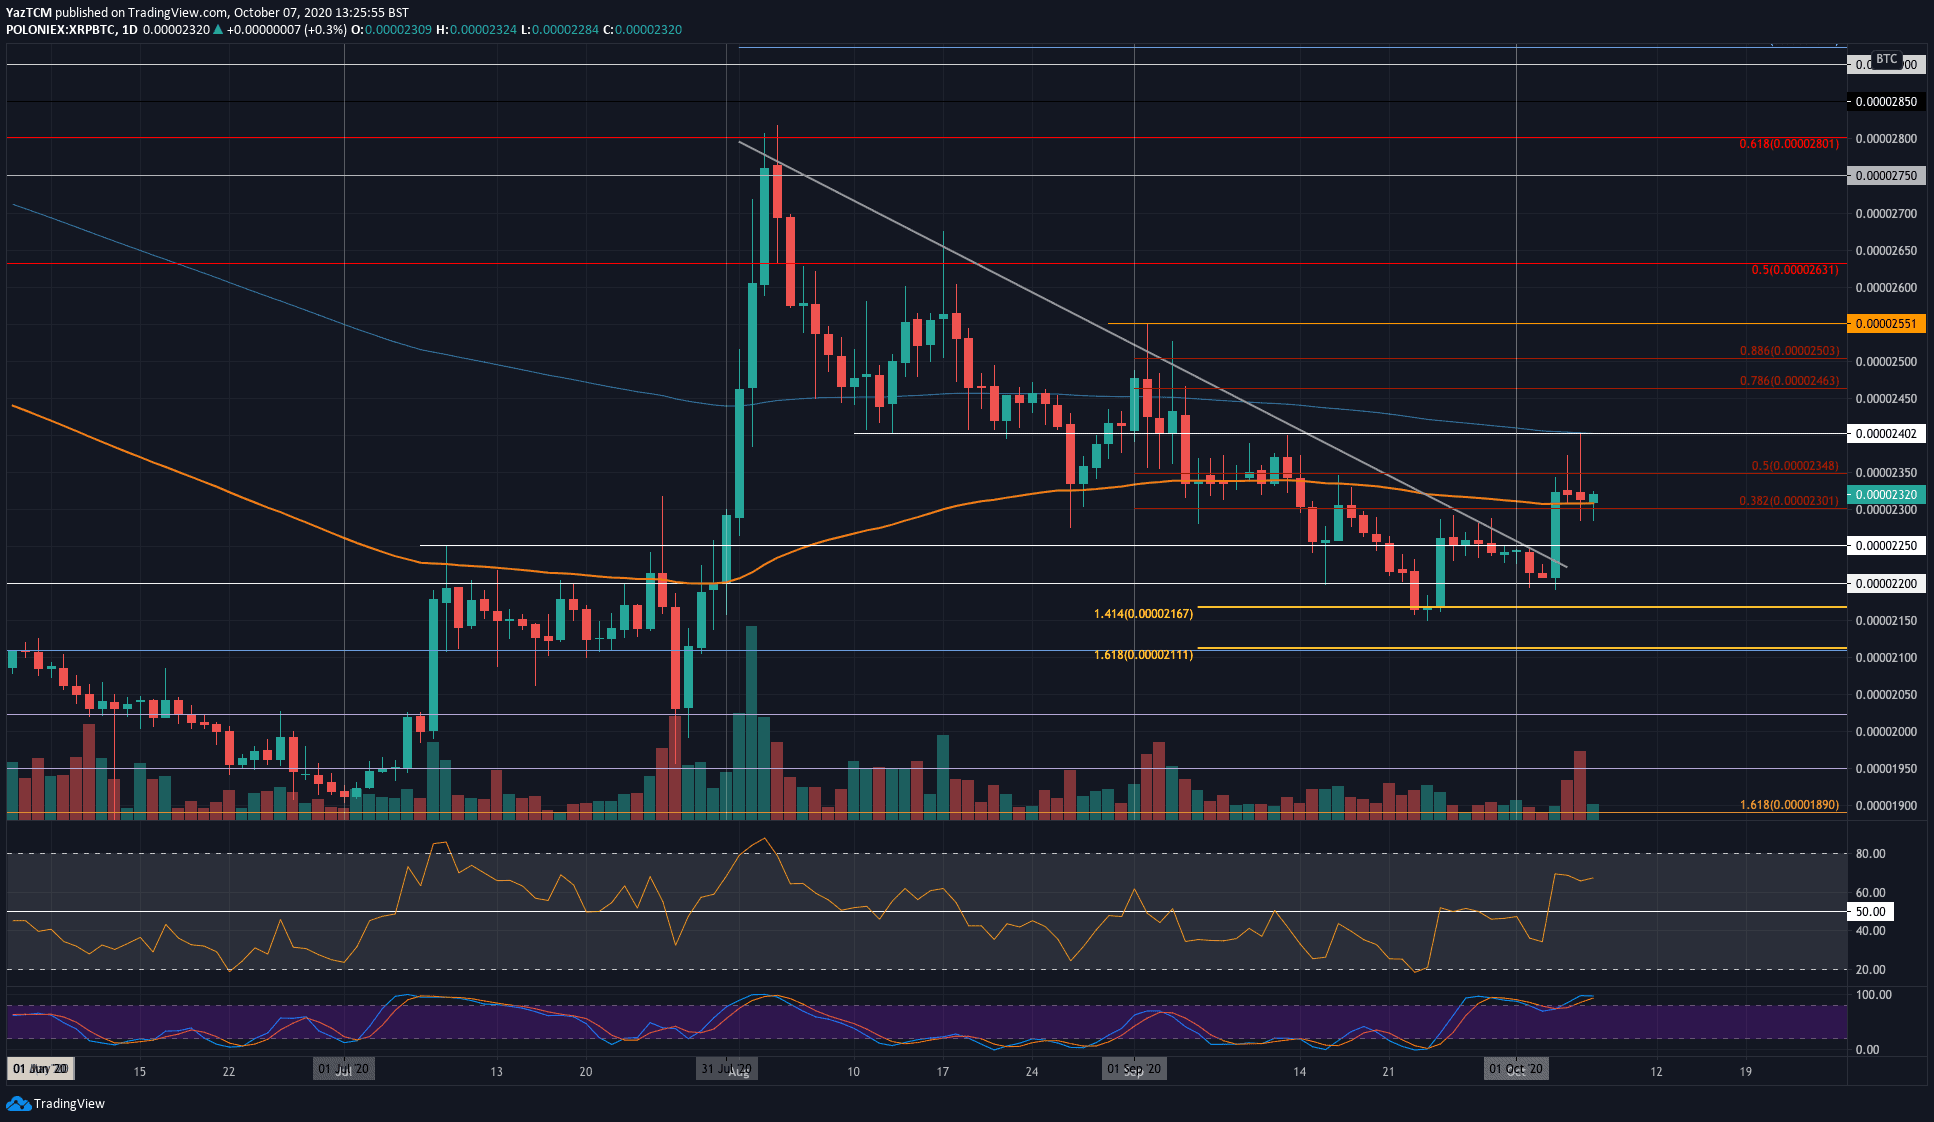
Key Support Levels: 2300 SAT, 2250 SAT, 2200 SAT.
Key Resistance Levels: 2350 SAT, 2400 SAT, 2465 SAT.
On Sunday, XRP bounced from the 2200 SAT support to break above a 2-month-old falling trend line and reach the resistance at 2350 SAT. Yesterday, XRP attempted to spike higher as it reached the 200-days EMA at 2400 SAT. However, the sellers quickly regrouped to cause XRP to close at around 2320 SAT.
Despite dropping, the coin still remains strongly supported by the 100-days EMA at around 2300 SAT.
Looking ahead, the first level of resistance lies at 2350 SAT (bearish .5 Fib). This is followed by resistance at 2400 SAT (200-days EMA), 2465 SAT (bearish .786 Fib), and 2500 SAT.
On the other side, the first level of support lies at 2300 SAT. Beneath this, support is located at 2250 SAT, 2200 SAT, and 2170 SAT.
Likewise, the Stochastic RSI is overbought and is shaping itself for a bearish crossover signal.