Ripple may have seen a very steep 10% price drop over the past week, but it has recently managed to rebound from a very strong support and is now battling to break above the $0.40 resistance level.
Ripple, ranked in 3rd place amongst the top cryptocurrency projects by market cap value, has only seen a small 28% price increase over the past 3 months of trading. In comparison, the rest of the top 5 cryptocurrency projects have seen have all increased by more than 100% in the same period. This leads us to believe that once XRP breaks above the $0.46 resistance level, it has a long way ahead to catch up to this year’s growth of its competition.
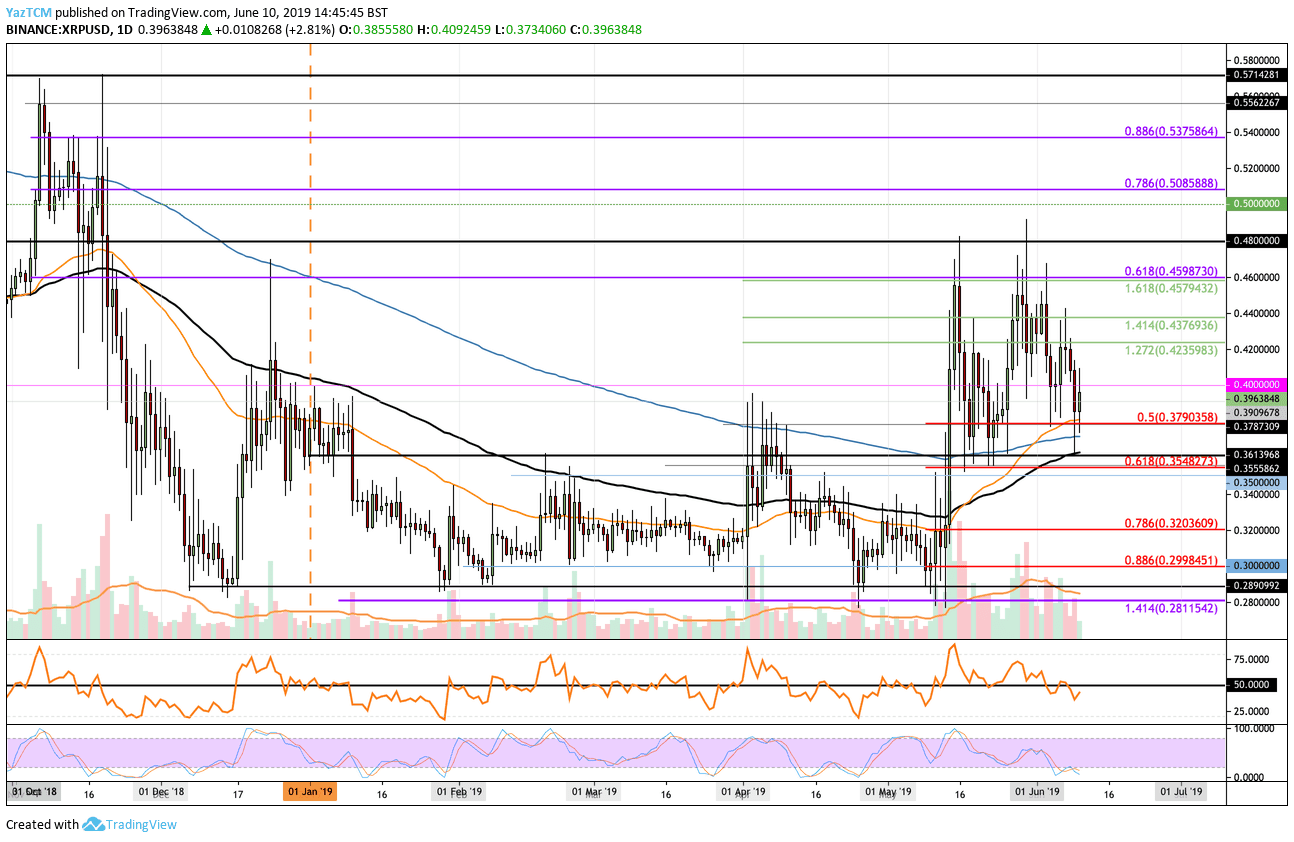
Looking at the XRP/USD 1-Day Chart:
- Since our previous XRP/USD analysis, we can see that XRP/USD went on to fall lower but had managed to rebound at the strong support around the $0.3790 level, provided by a short term .5 Fibonacci Retracement level. XRP/USD has rebounded from this level of support and is now attempting to break $0.40.
- From above: The nearest level of resistance above now lies at $0.40. Beyond this, higher resistance is expected at $0.4235, $0.4375 and $0.46. If the buyers break above $0.46, higher resistance is then located at $0.48 and $0.50. Above $0.50, further resistance lies at $0.5085 and $0.5375.
- From below: The nearest level of support now lies at $0.3790. Beneath this, further support lies $0.36, which is bolstered by the 100 days EMA. Beneath $0.36, support is expected at $0.35, $0.34 and $0.3203.
- The trading volume remains below average but is still relatively high.
- The Stochastic RSI is in oversold conditions as we wait for a bullish crossover to signal a push higher.
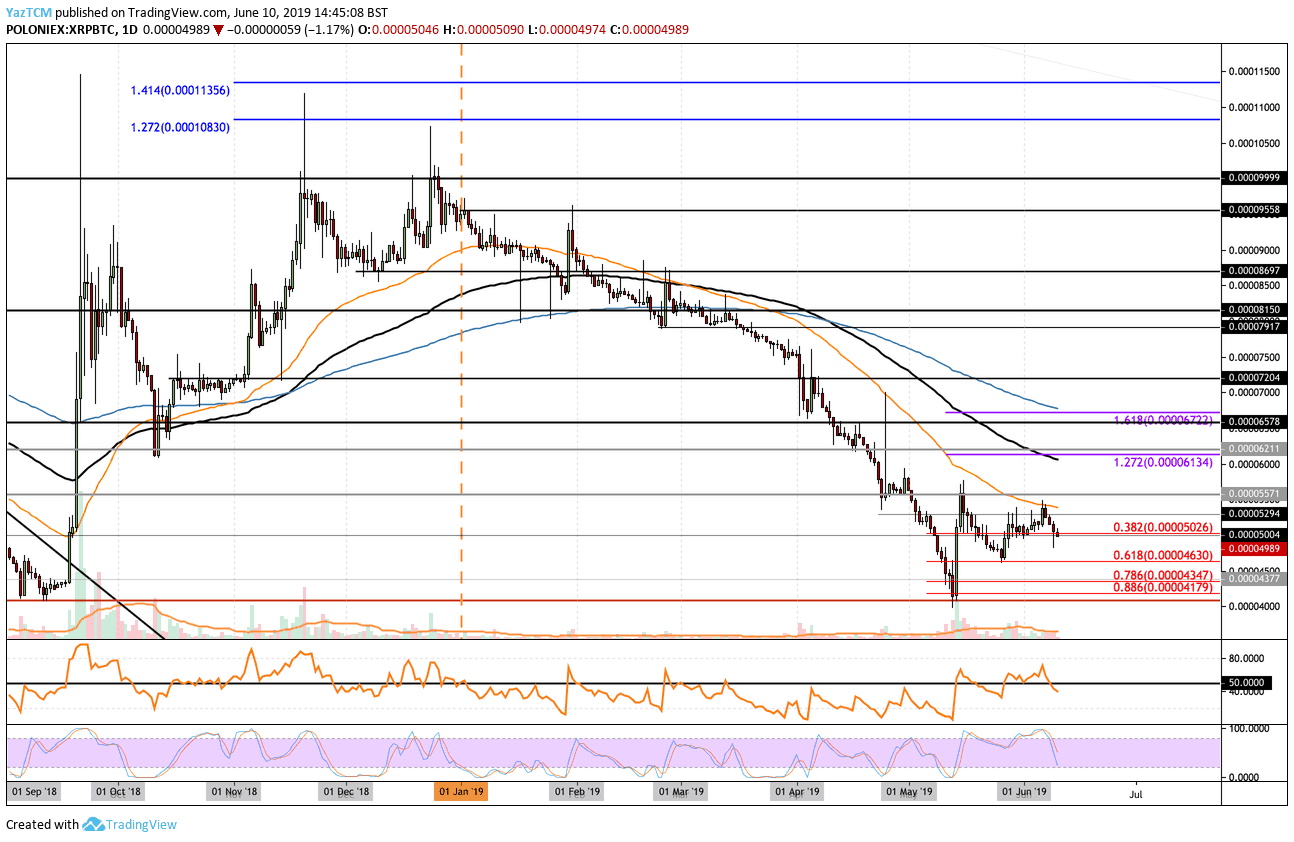
Looking at the XRP/BTC 1-Day Chart:
- Against Bitcoin, we can see that XRP failed to claim any ground above the 5500 SAT level during June 2019, causing XRP/BTC to fall lower to where it currently trades at 4990 SAT.
- From above: The nearest level of resistance now lies at 5000 SAT. Above this, further higher resistance lies at 5500 SAT, 6000 SAT, 6135 SAT, 6500 SAT, 6722 SAT and 7000 SAT.
- From below: The nearest level of support lies at 4800 SAT and 4630 SAT. Beneath this, further support lies at 4347 SAT, 4200 SAT, 4179 SAT, 4100 SAT, and 4000 SAT.
- The trading volume has started to increase slightly during the first week of June 2019.
- The RSI has recently dropped back beneath the 50 level to indicate that the sellers have regained control of the market momentum.
SPECIAL OFFER (Sponsored)
LIMITED OFFER 2024 for CryptoPotato readers at Bybit: Use this link to register and open a $500 BTC-USDT position on Bybit Exchange for free!
Disclaimer: Information found on CryptoPotato is those of writers quoted. It does not represent the opinions of CryptoPotato on whether to buy, sell, or hold any investments. You are advised to conduct your own research before making any investment decisions. Use provided information at your own risk. See Disclaimer for more information.
Cryptocurrency charts by TradingView.