Ripple had recently lost its second place on the top coin market cap list. Except for dignity, it doesn’t mean much.
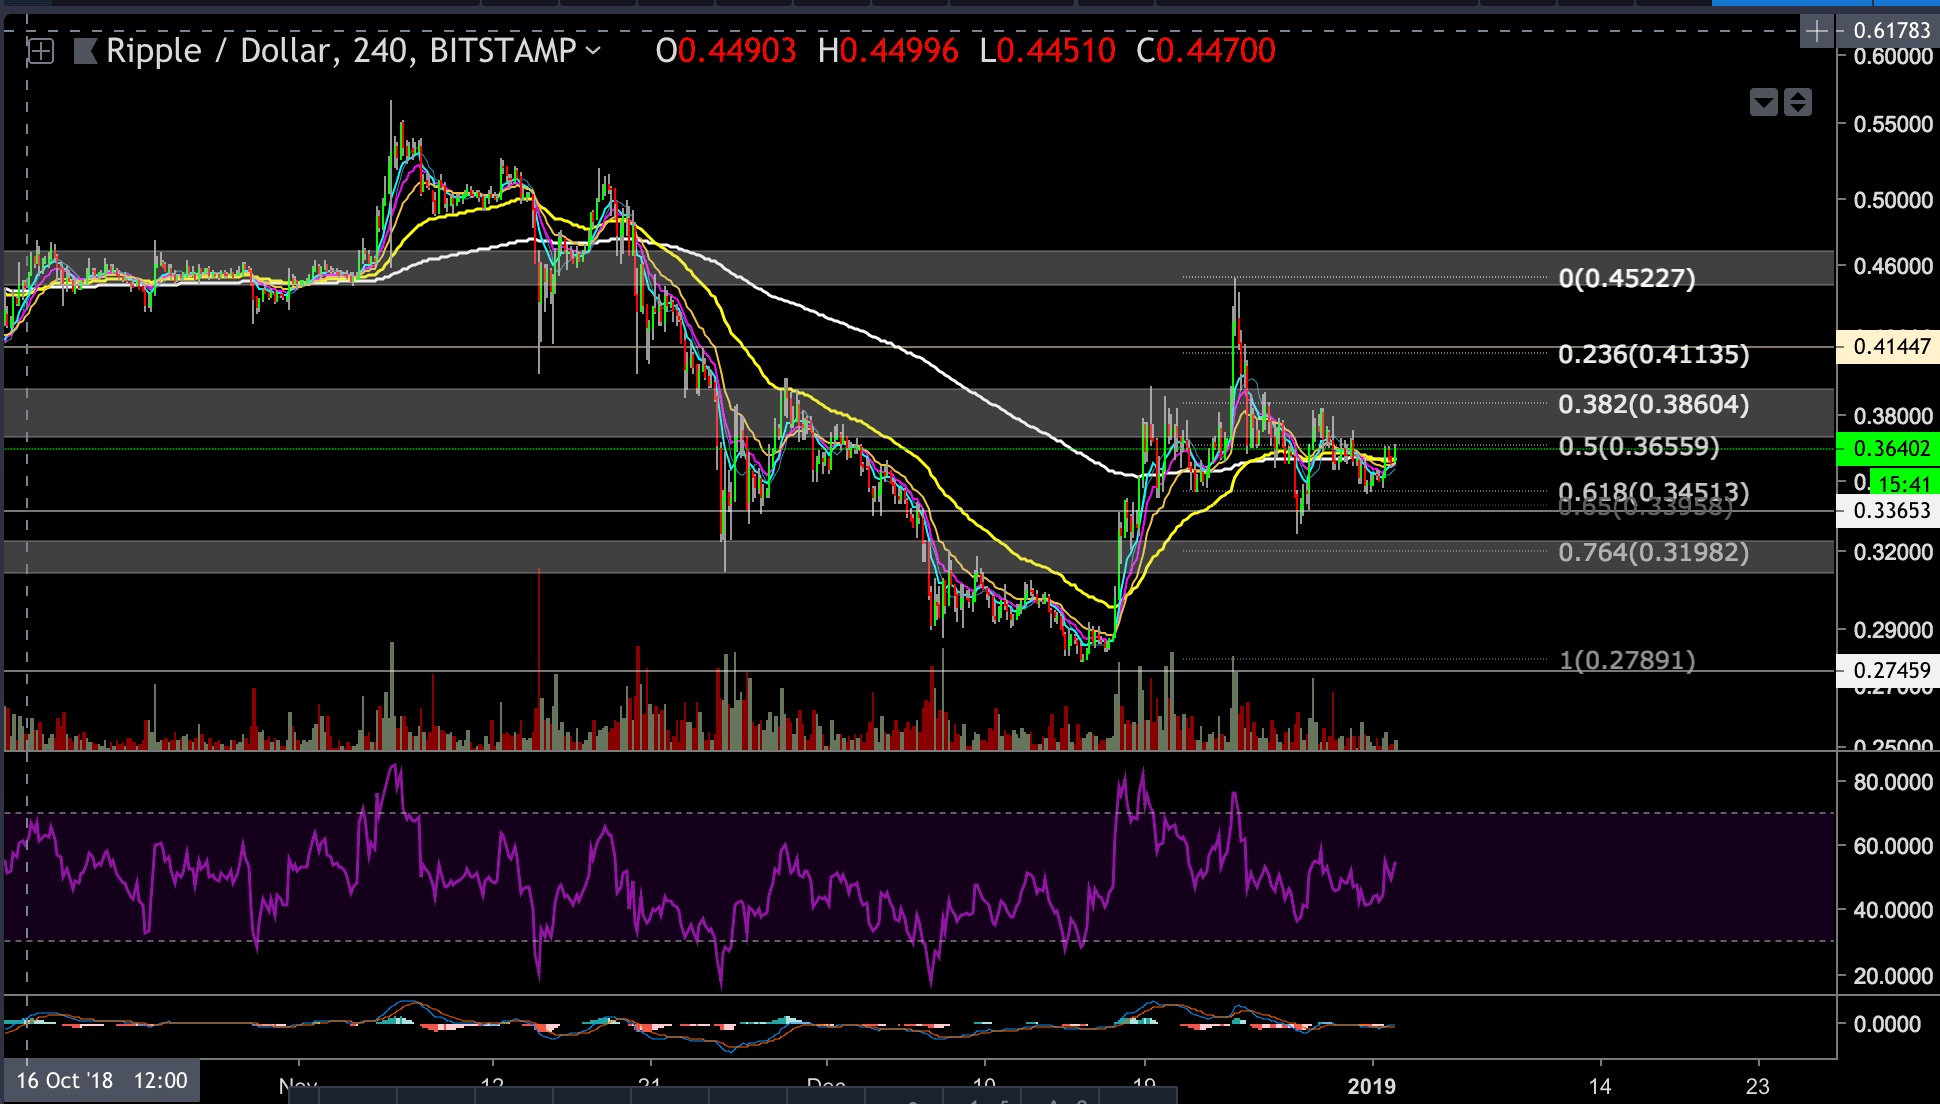
XRP is currently trading around the $0.36 price level, and we can notice that the 200 EMA (marked in a white line) and the 55 EMA (yellow line) are curling around each other, which is likely a sign that a sharp move is about to take place soon.
Looking at the 4-hour chart
- XRP is still trading in between the range of $0.37 – $0.395 resistance from above and $0.31 – $0.324 support level from below.
- We expect to see a retest of the resistance level shortly, a move that will determine the next short-term direction for the coin. Looking at the daily chart, we can see that the above resistance level is very significant for XRP. It is the peak of the first XRP rally recorded in May 2017. If this resistance gets broken up, then the future might be much brighter for XRP in the mid-term.
- In the above scenario, as we mentioned in our last XRP analysis, the next target for XRP could be found at the previous high of $0.448.
- On the other hand, if the bears take the lead, then XRP will likely to retest the channel’s support level ($0.31 – $0.324). In the case that this level gets broken down, XRP could easily slide toward the lows around $0.27.
- The RSI indicator is at 54 (the middle of the channel). This level doesn’t give us any short-term indications where the wind is blowing.
- The trading volume is shrinking, and together with the parallel EMAs movement, we should expect a sharp move soon.
BitStamp XRP/USD 4-Hour Chart
BitStamp XRP/USD 1-Day Chart
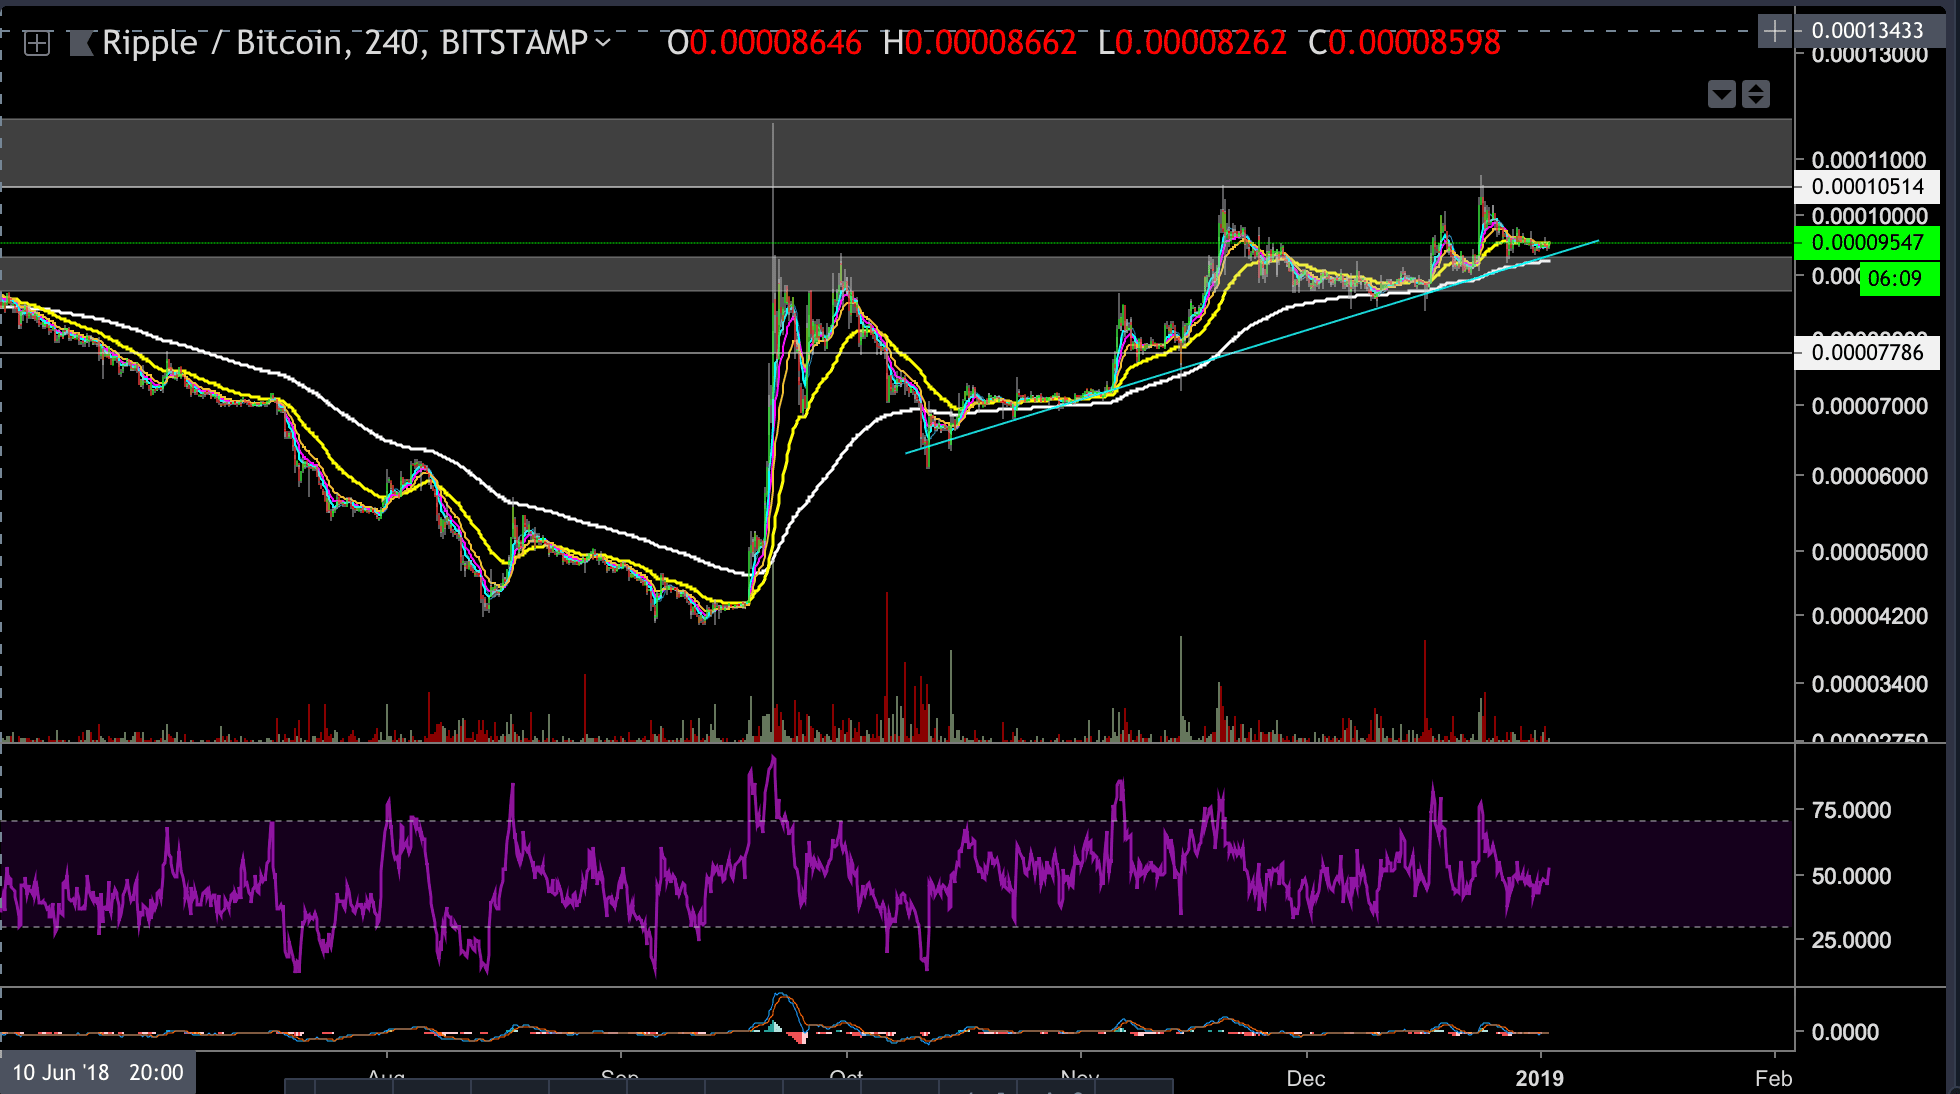
XRP-BTC Markets
On the XRP-BTC 4 hours chart nothing much has changed, whereas XRP is trading above the 0.000093 BTC support level and the blue supporting trend-line (shown on the following chart).
The next bullish target could be found at the 0.000105 BTC – 0.000115 BTC resistance level, and on the other hand, if support level gets broken, then next bearish target could be found around 0.000084 BTC or lower at the 0.000078 (200 EMA).
BitStamp XRP/BTC 4-Hour Chart