Following the bullish sentiment in the crypto markets, Ripple has broken above the $0.34 level, for the second time over the past 24 hours of trading. The cryptocurrency has now seen an impressive 8.5% weekly price spike.
It’s likely to say that Ripple has the largest inverse correlation to Bitcoin. Hence, the last bull-run of Bitcoin did cause XRP-USD to raise. However, XRP-BTC hadn’t changed much.
Ripple is still ranked on the third position of the largest cryptos by market cap as it currently holds a $13.7 billion market cap.
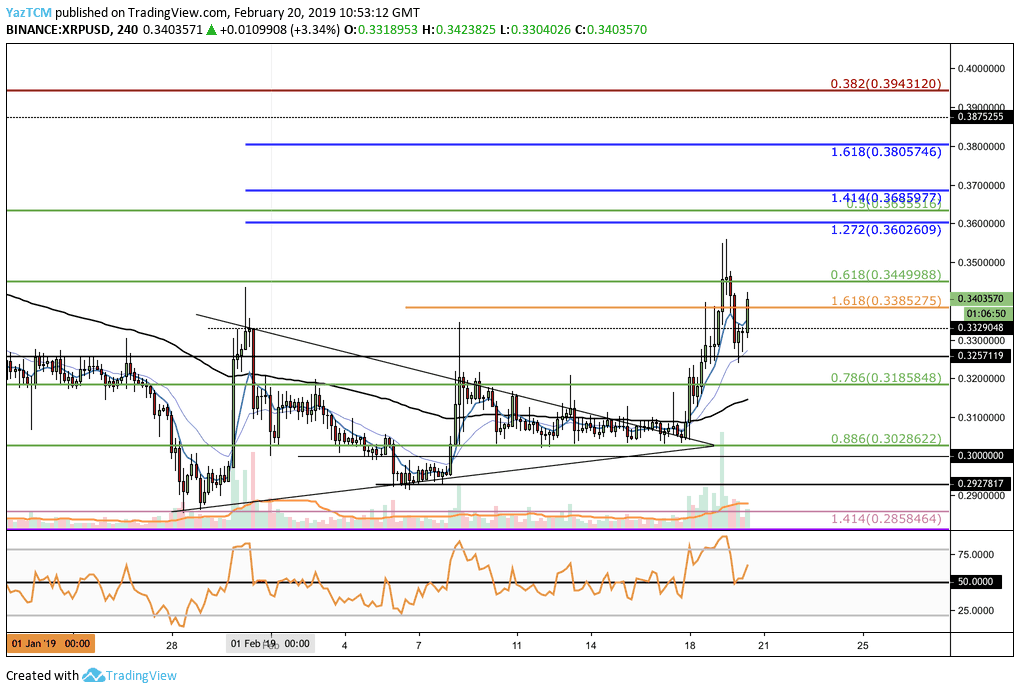
Looking At The BTC/USD 1-Day Chart:
- Ripple has broken above the symmetrical triangle outlined in our previous XRP analysis.
- Following the breakout, the market continued to surge higher into resistance at the short-term .618 Fibonacci Retracement level at $0.3449 (marked in green), then, the market fell slightly but quickly recovered as it currently trades at the $0.33 area.
- From above: The nearest resistance lies at the $0.3449 If the buyers can break above this, we can expect higher resistance to get retested for the short term .5 Fibonacci Retracement level lies at $0.3655 (marked in green).
- Further resistance lies at the short term 1.414 ($0.3685) and 1.618 ($0.3805) Fibonacci Extension levels (marked in blue).
- Significant resistance above $0.38 lies at the bearish .382 Fibonacci Retracement level around $0.3943 (marked in red).
- From below: The nearest support lies at $0.33 and $0.3257. If the sellers continue further lower, the short term .886 Fibonacci Retracement level lies at $0.3028 (marked in green and below is the $0.30 level.
- The RSI has rebounded from the 50 zone which indicates that the bulls are still in control of the market.
- The trading volume has steadily been increasing over the past days.
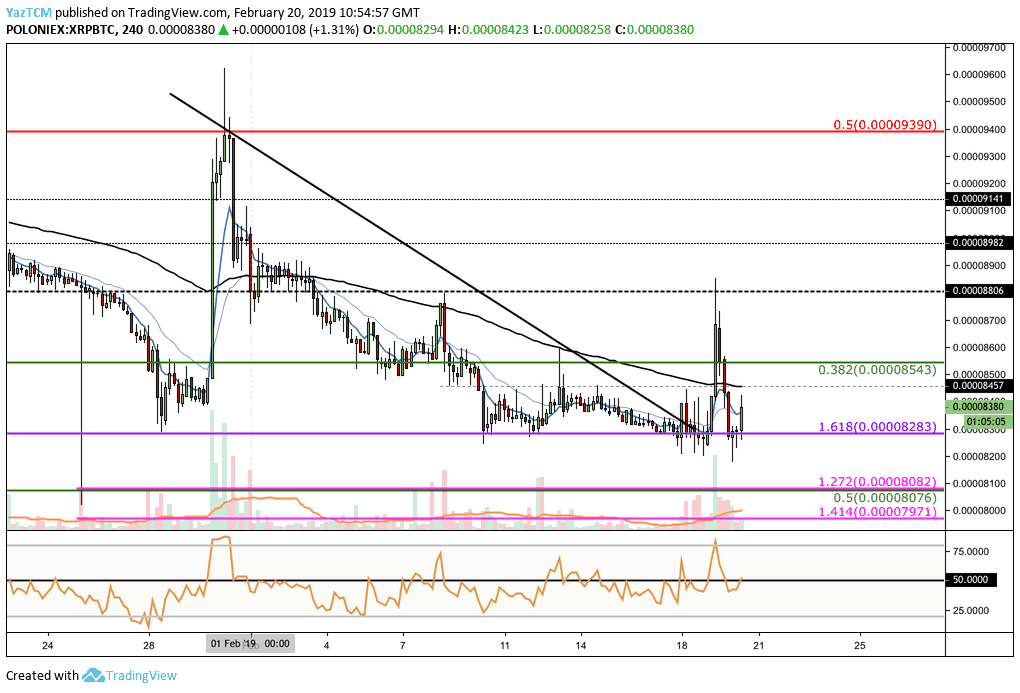
Looking At The XRP/BTC 1-Day Chart:
- XRP/BTC has also broken above the descending wedge formation. However, after reaching resistance at 8806 SAT the market fell sharply and found support at 8283 SAT.
- From above: The nearest resistance is expected at 8543 SAT followed by 8806 SAT.
- Further resistance lies at 8982 SAT and 9141 SAT levels and the bearish .5 Fibonacci Retracement level at 9390 SAT (marked in red).
- From below: The nearest significant support lies at the long-term downside 1.618 Fibonacci Extension level lies at 8283 SAT (marked in purple).
- Beneath, support lies at the short term .5 Fibonacci Retracement level lies at 8076 SAT (marked in green) and at the short-term downside 1.272 Fibonacci Extension situated in the same area.
- The RSI is about to penetrate above the 50 levels as the Bulls battle for control.
- The volume has also been increasing in this market over the past few days.
SPECIAL OFFER (Sponsored)
LIMITED OFFER 2024 for CryptoPotato readers at Bybit: Use this link to register and open a $500 BTC-USDT position on Bybit Exchange for free!
Disclaimer: Information found on CryptoPotato is those of writers quoted. It does not represent the opinions of CryptoPotato on whether to buy, sell, or hold any investments. You are advised to conduct your own research before making any investment decisions. Use provided information at your own risk. See Disclaimer for more information.
Cryptocurrency charts by TradingView.