The past 24 hours have seen a particularly volatile period of trading on the cryptocurrency market after Bitcoin poked its nose above $9,000 only to crash moments later toward the $8,200 level.
The majority of the cryptocurrency market was rocked by this volatility, including Ripple which has dropped by a total of 7% over the past 24 hours. However, XRP still remains up by a total of 10% on the week and a further 41% over the past 30 days.
Ripple remains ranked in the 3rd place amongst the top cryptocurrencies by market cap value, as it currently holds an $18.12 billion market cap valuation.
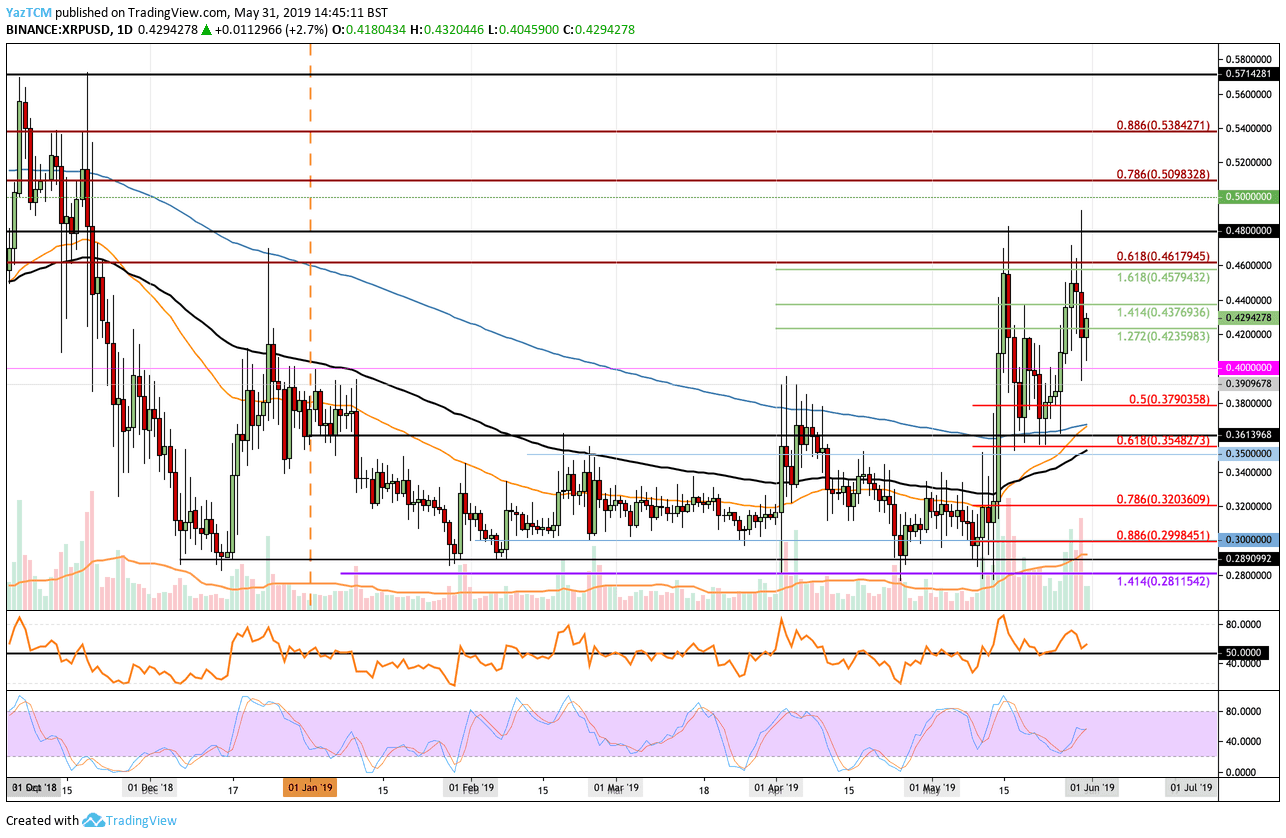
Looking at the XRP/USD 1-Day Chart:
- Since our previous XRP/USD analysis, we can see that XRP went on to surge further to reach a high above $0.49. However, the market was unable to hold above this level and closed the candle well below resistance around $0.46. The volatility seen yesterday saw XRP drop into support around the $0.40 level before rebounding higher.
- From above: The nearest level of resistance now lies at $0.4380 and then between $0.4580 and $0.4620. Above $0.4620, further resistance lies at $0.48 and $0.50. If the buyers continue above $0.50, higher resistance then lies at $0.5098, $0.52 and $0.5380.
- From below: The nearest level of support now lies at $0.42, $0.41 and $0.40. Beneath $0.40, further support lies at $0.39, $0.3790 and $0.36 (which also contains the 200 days EMA).
- The trading volume increased significantly during the volatility yesterday but has since diminished below the average level.
- The RSI has recently managed to rebound at the 50 level to indicate that the bulls remain in charge of the market momentum.
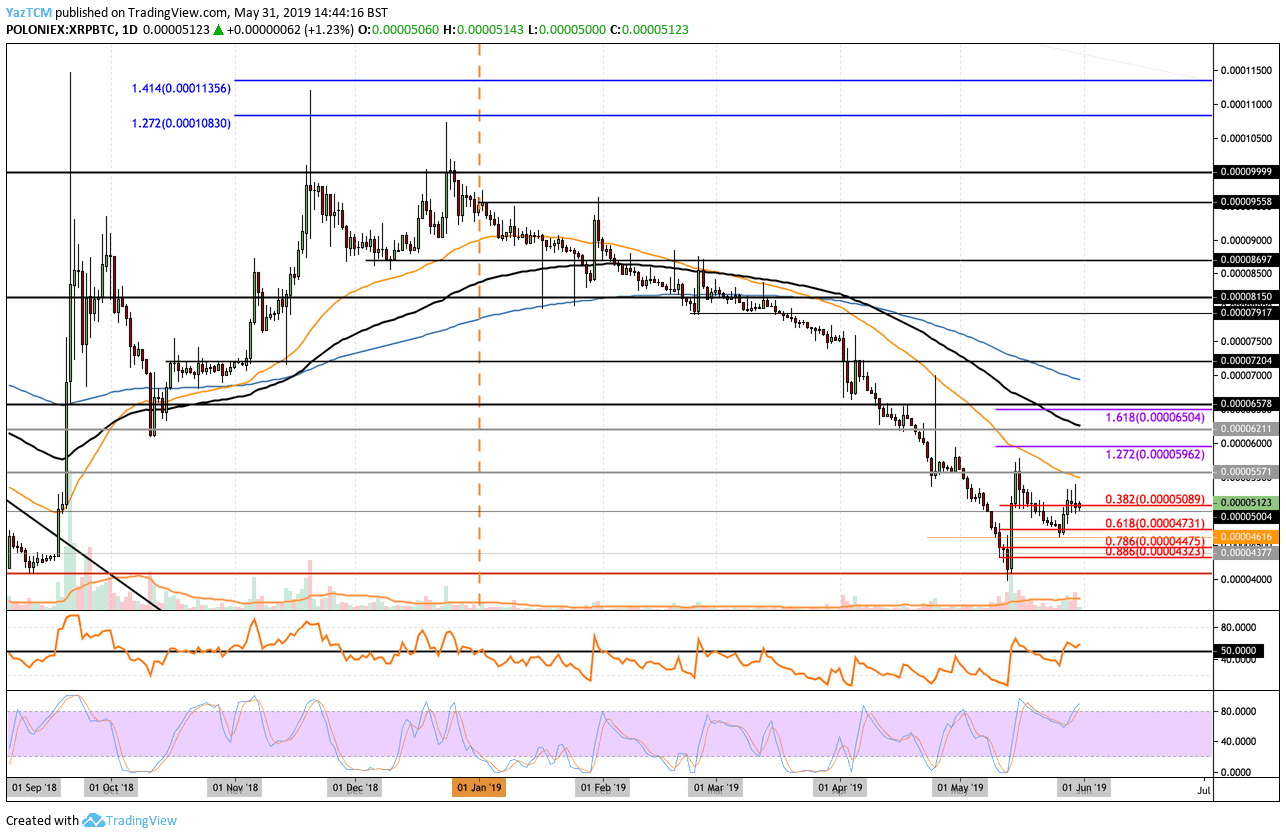
Looking at the XRP/BTC 1-Day Chart:
- Against Bitcoin, we can see that XRP has managed to climb higher above the 5000 SAT resistance region and is now using this level as support.
- From above: The nearest level of resistance now lies at 5200 SAT and 5570 SAT. Above this, further resistance lies at 5962 SAT, 6000 SAT, 6211 SAT (which contains the 100 days EMA) and 6504 SAT.
- From below: The nearest level of strong support lies at 5000 SAT. Beneath this, further support lies at 4730 SAT, 4475 SAT and 4300 SAT.
- The trading volume has increased significantly during May 2019 after the rebound at the 4000 SAT level.
- The RSI has recently broken back above 50 but the Stochastic RSI suggests that a further pullback may occur as it approaches near overbought conditions.
SPECIAL OFFER (Sponsored)
LIMITED OFFER 2024 for CryptoPotato readers at Bybit: Use this link to register and open a $500 BTC-USDT position on Bybit Exchange for free!
Disclaimer: Information found on CryptoPotato is those of writers quoted. It does not represent the opinions of CryptoPotato on whether to buy, sell, or hold any investments. You are advised to conduct your own research before making any investment decisions. Use provided information at your own risk. See Disclaimer for more information.
Cryptocurrency charts by TradingView.