XRP saw a small decline of around 3% over the past 24 hours and it currently trades at $0.2705. The cryptocurrency has started to pull back slightly after surging by 9% over the past week of trading. During the first week of October, XRP has been performing very well as it attempts to make its way back to the $0.30 level.
XRP is the second-largest cryptocurrency with a market cap of $11.68 billion.
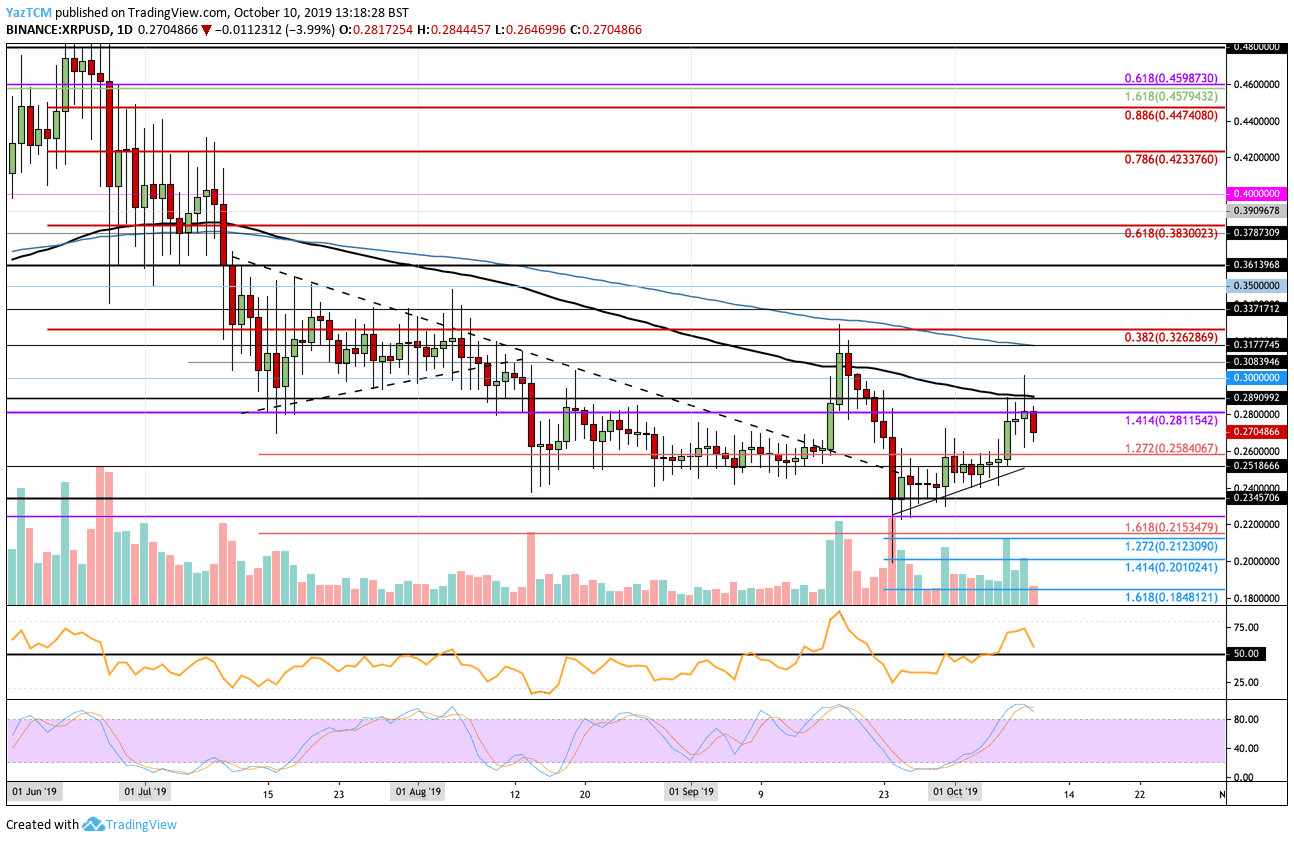
Looking at the XRP/USD 1-Day Chart:
- Since our previous XRP/USD analysis, XRP continued meeting resistance at the $0.2811 level. The coin spiked higher into the $0.30 level in yesterday’s trading session, however, XRP was still unable to close above the $0.2811 resistance. The 3% decrease today has caused XRP to roll over toward $0.27.
- From above: The nearest level of resistance lies at $0.2811. Above this, resistance lies at $0.2890 (100-days EMA) and $0.30. If the bulls can penetrate above $0.30, higher resistance is expected at $0.308, $0.3177 (200-days EMA), $0.3262, and $0.3371.
- From below: The nearest level of support lies at $0.27. Beneath this, support is found at $0.26, $0.2584, $0.25, and the September low-day closing price of $0.2345. Further support is expected at $0.22, $0.2153, $0.21230, and $0.21.
- The trading volume has seen an increase during October.
- The RSI is above the 50 level but is pointing downward which could suggest a small retracement. However, if the RSI can remain above 50, we can expect XRP to continue to climb toward $0.30. The Stochastic RSI is primed for a bearish crossover in overbought conditions which is another signal for a potential short term retracement.
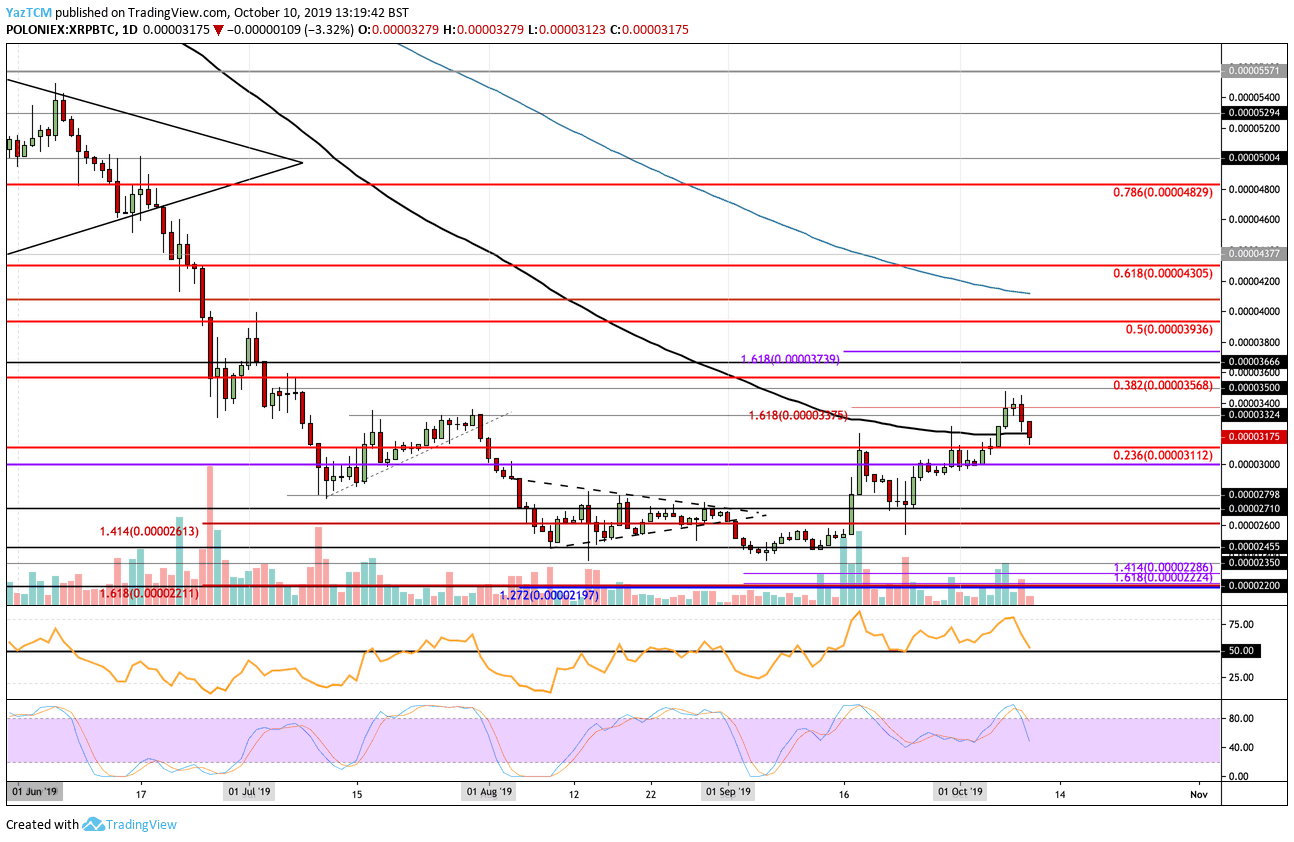
Looking at the XRP/BTC 1-Day Chart:
- Against Bitcoin, XRP failed to make any grounds above 3400 SAT and started to fall. XRP recently found support at the 3112 SAT level as it currently trades along the 100-days EMA.
- From above: The nearest level of resistance lies at 3400 SAT. Above this, resistance is found at 3500 SAT and 3568 SAT (bearish .382 Fib Retracement). Higher resistance can be found at 3666 SAT, 3739 SAT, and 3936 SAT (bearish .5 Fib Retracement).
- From below: The nearest levels of support lie at 3112 SAT and 3000 SAT. Beneath this, support can be found at 2900 SAT, 2798 SAT, 2710 SAT, 2600 SAT, and 2455 SAT.
- The trading volume has started to decline over the past couple of days.
- The RSI has returned to the 50 level which shows indecision within the market. If the RSI falls beneath the 50 level, we can expect the bears to take over the market momentum.
SPECIAL OFFER (Sponsored)
LIMITED OFFER 2024 for CryptoPotato readers at Bybit: Use this link to register and open a $500 BTC-USDT position on Bybit Exchange for free!
Disclaimer: Information found on CryptoPotato is those of writers quoted. It does not represent the opinions of CryptoPotato on whether to buy, sell, or hold any investments. You are advised to conduct your own research before making any investment decisions. Use provided information at your own risk. See Disclaimer for more information.
Cryptocurrency charts by TradingView.