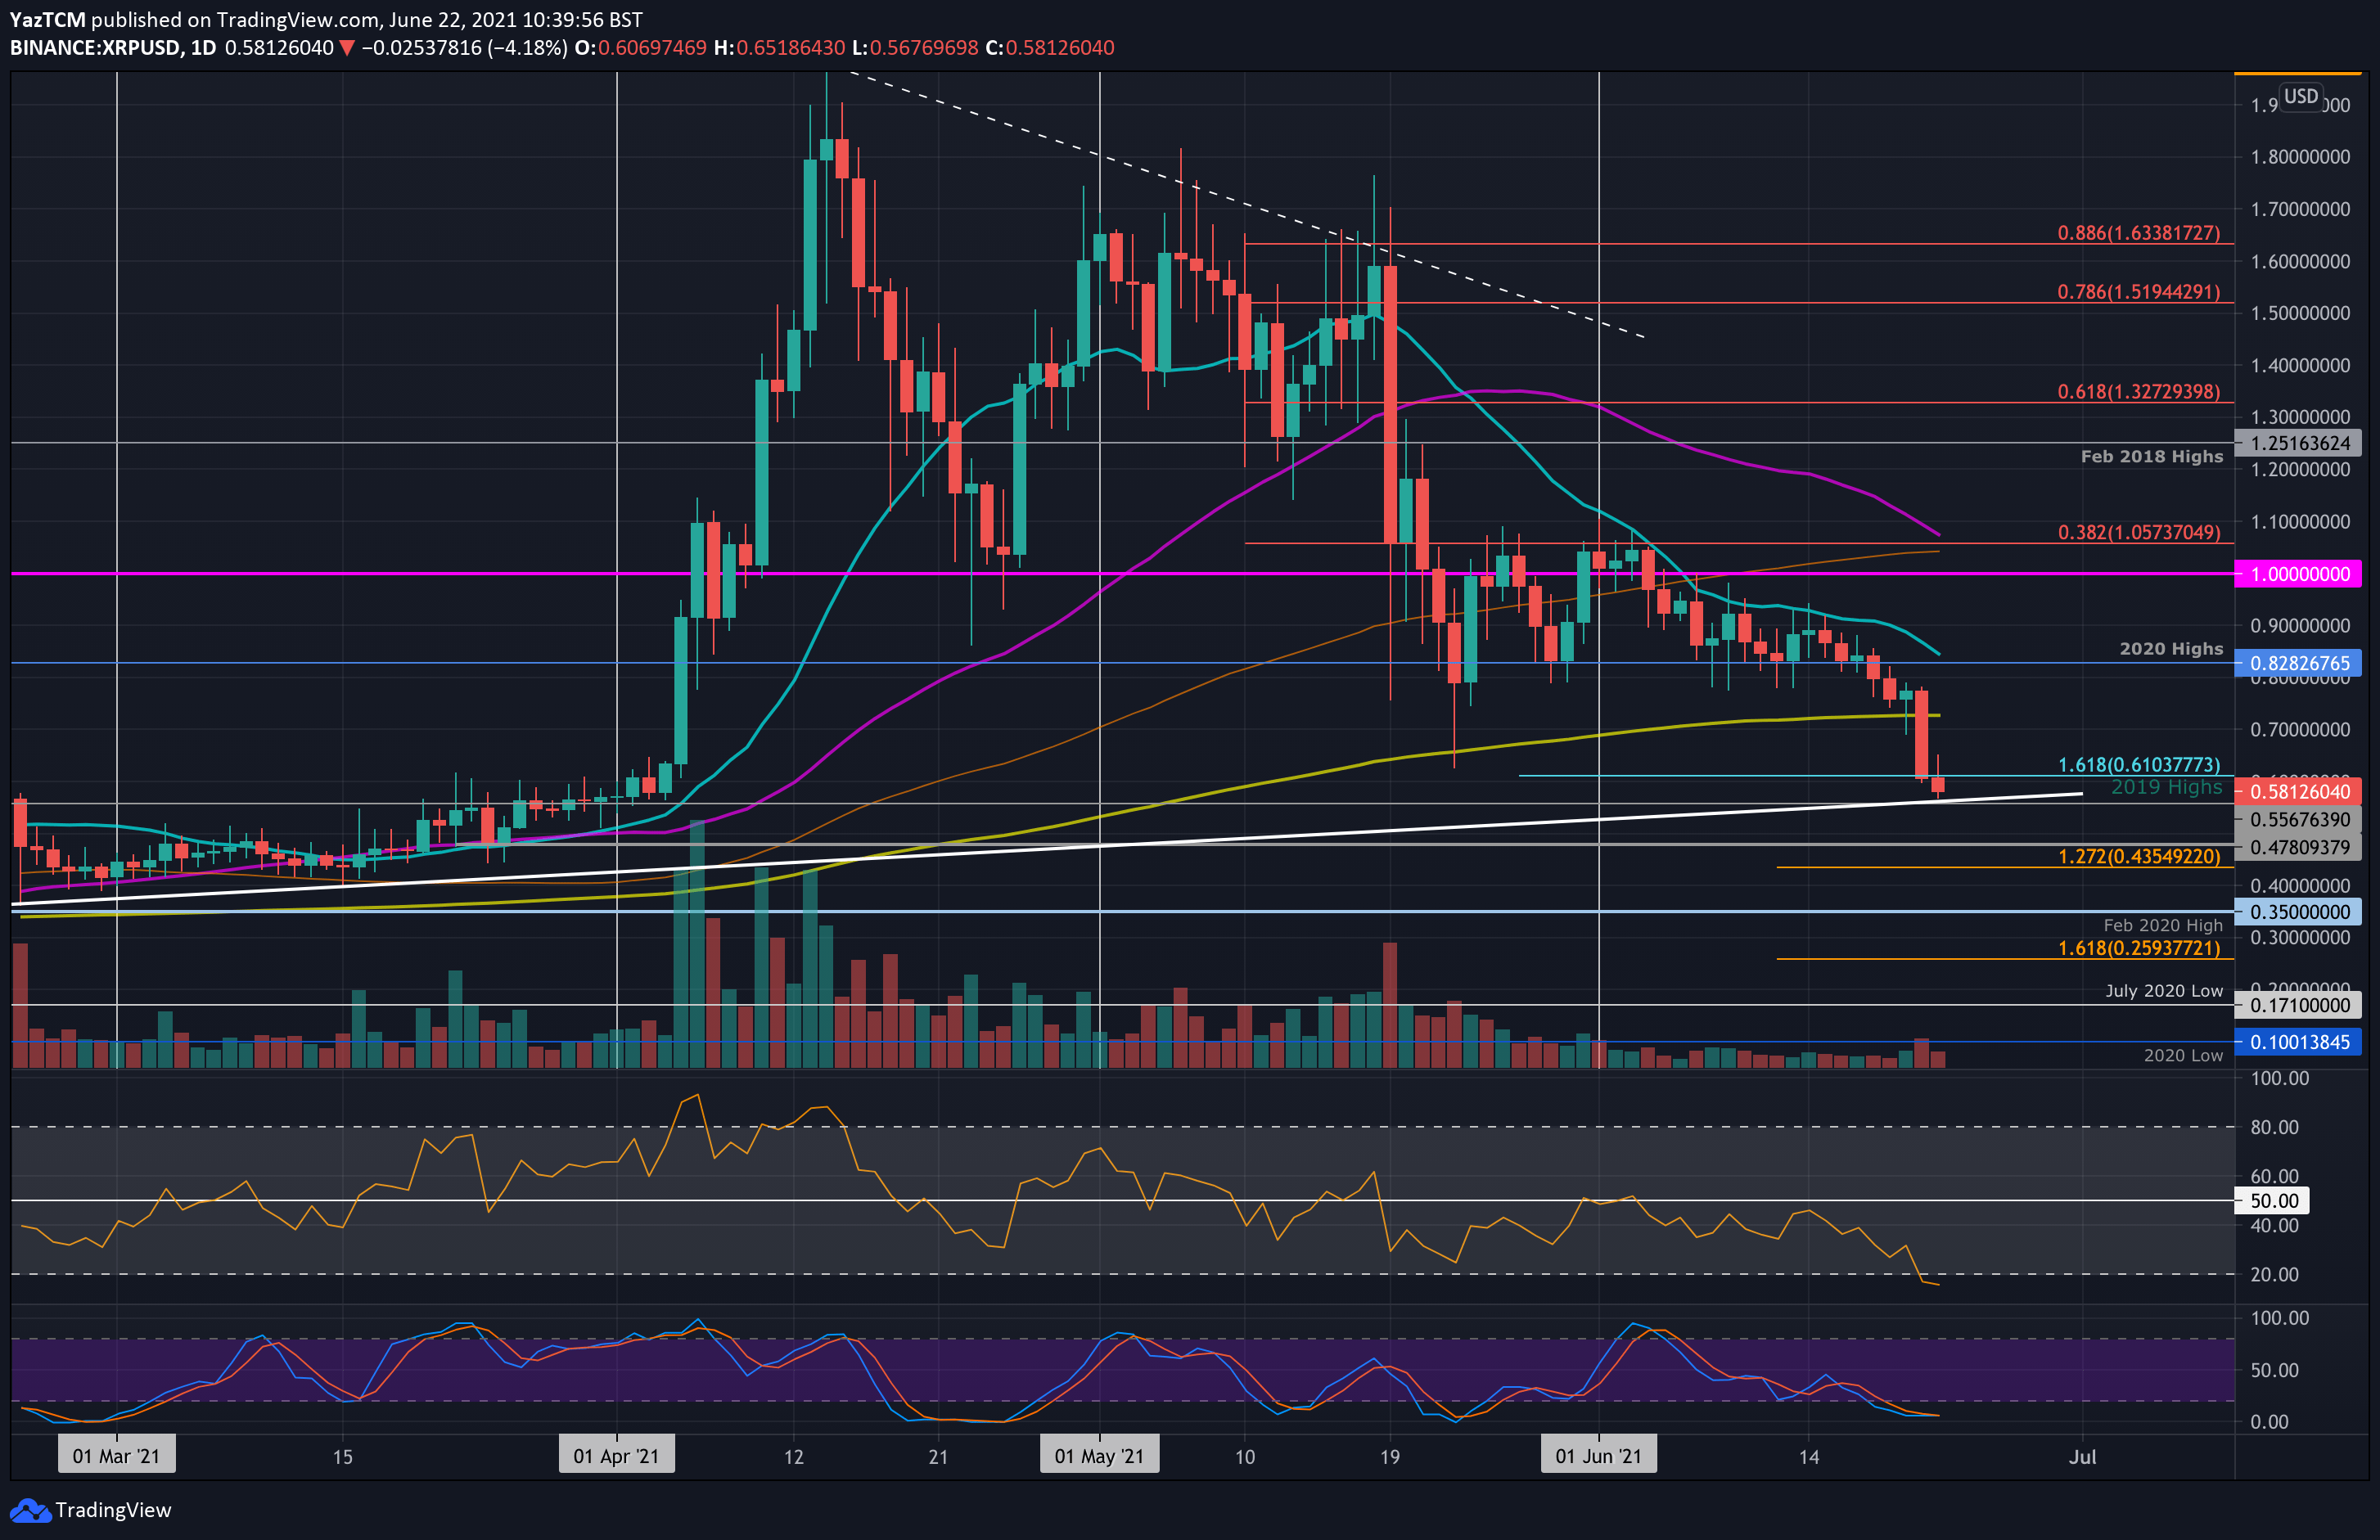
XRP/USD Daily Chart. Source: TradingView.
Key Support Levels: $0.56, $0.5, $0.478.
Key Resistance Levels: $0.61, $0.71, $0.8282.
XRP was doing well to hold the support at the 2020 high at around $0.82 throughout June. However, the bears finally managed to penetrate beneath the support over the weekend after testing it numerous times.
Yesterday, XRP fell beneath the 200-day MA level at around $0.72 and plummeted into support at $0.61 (downside 1.618 Fib Extension). Today, the selling continued as XRP fell toward the 2019 highs at around $0.56. The support there is further bolstered by a long-term trend line that extends back to early February.
Looking ahead, if the sellers break $0.56, the first support lies at $0.5. This is followed by $0.478, $0.435 (downside 1.272 Fib Extension), $0.4, and $0.25 (Feb 2020 highs).
On the other side, the first resistance lies at $0.61. This is followed by $0.71 (200-day MA), $0.8282 (2020 High & 20-day MA), and $0.9.
The daily RSI is extremely oversold and is showing the most bearish momentum since December 2020. This shows that the bears should be overextended, and a reversal could be expected soon.
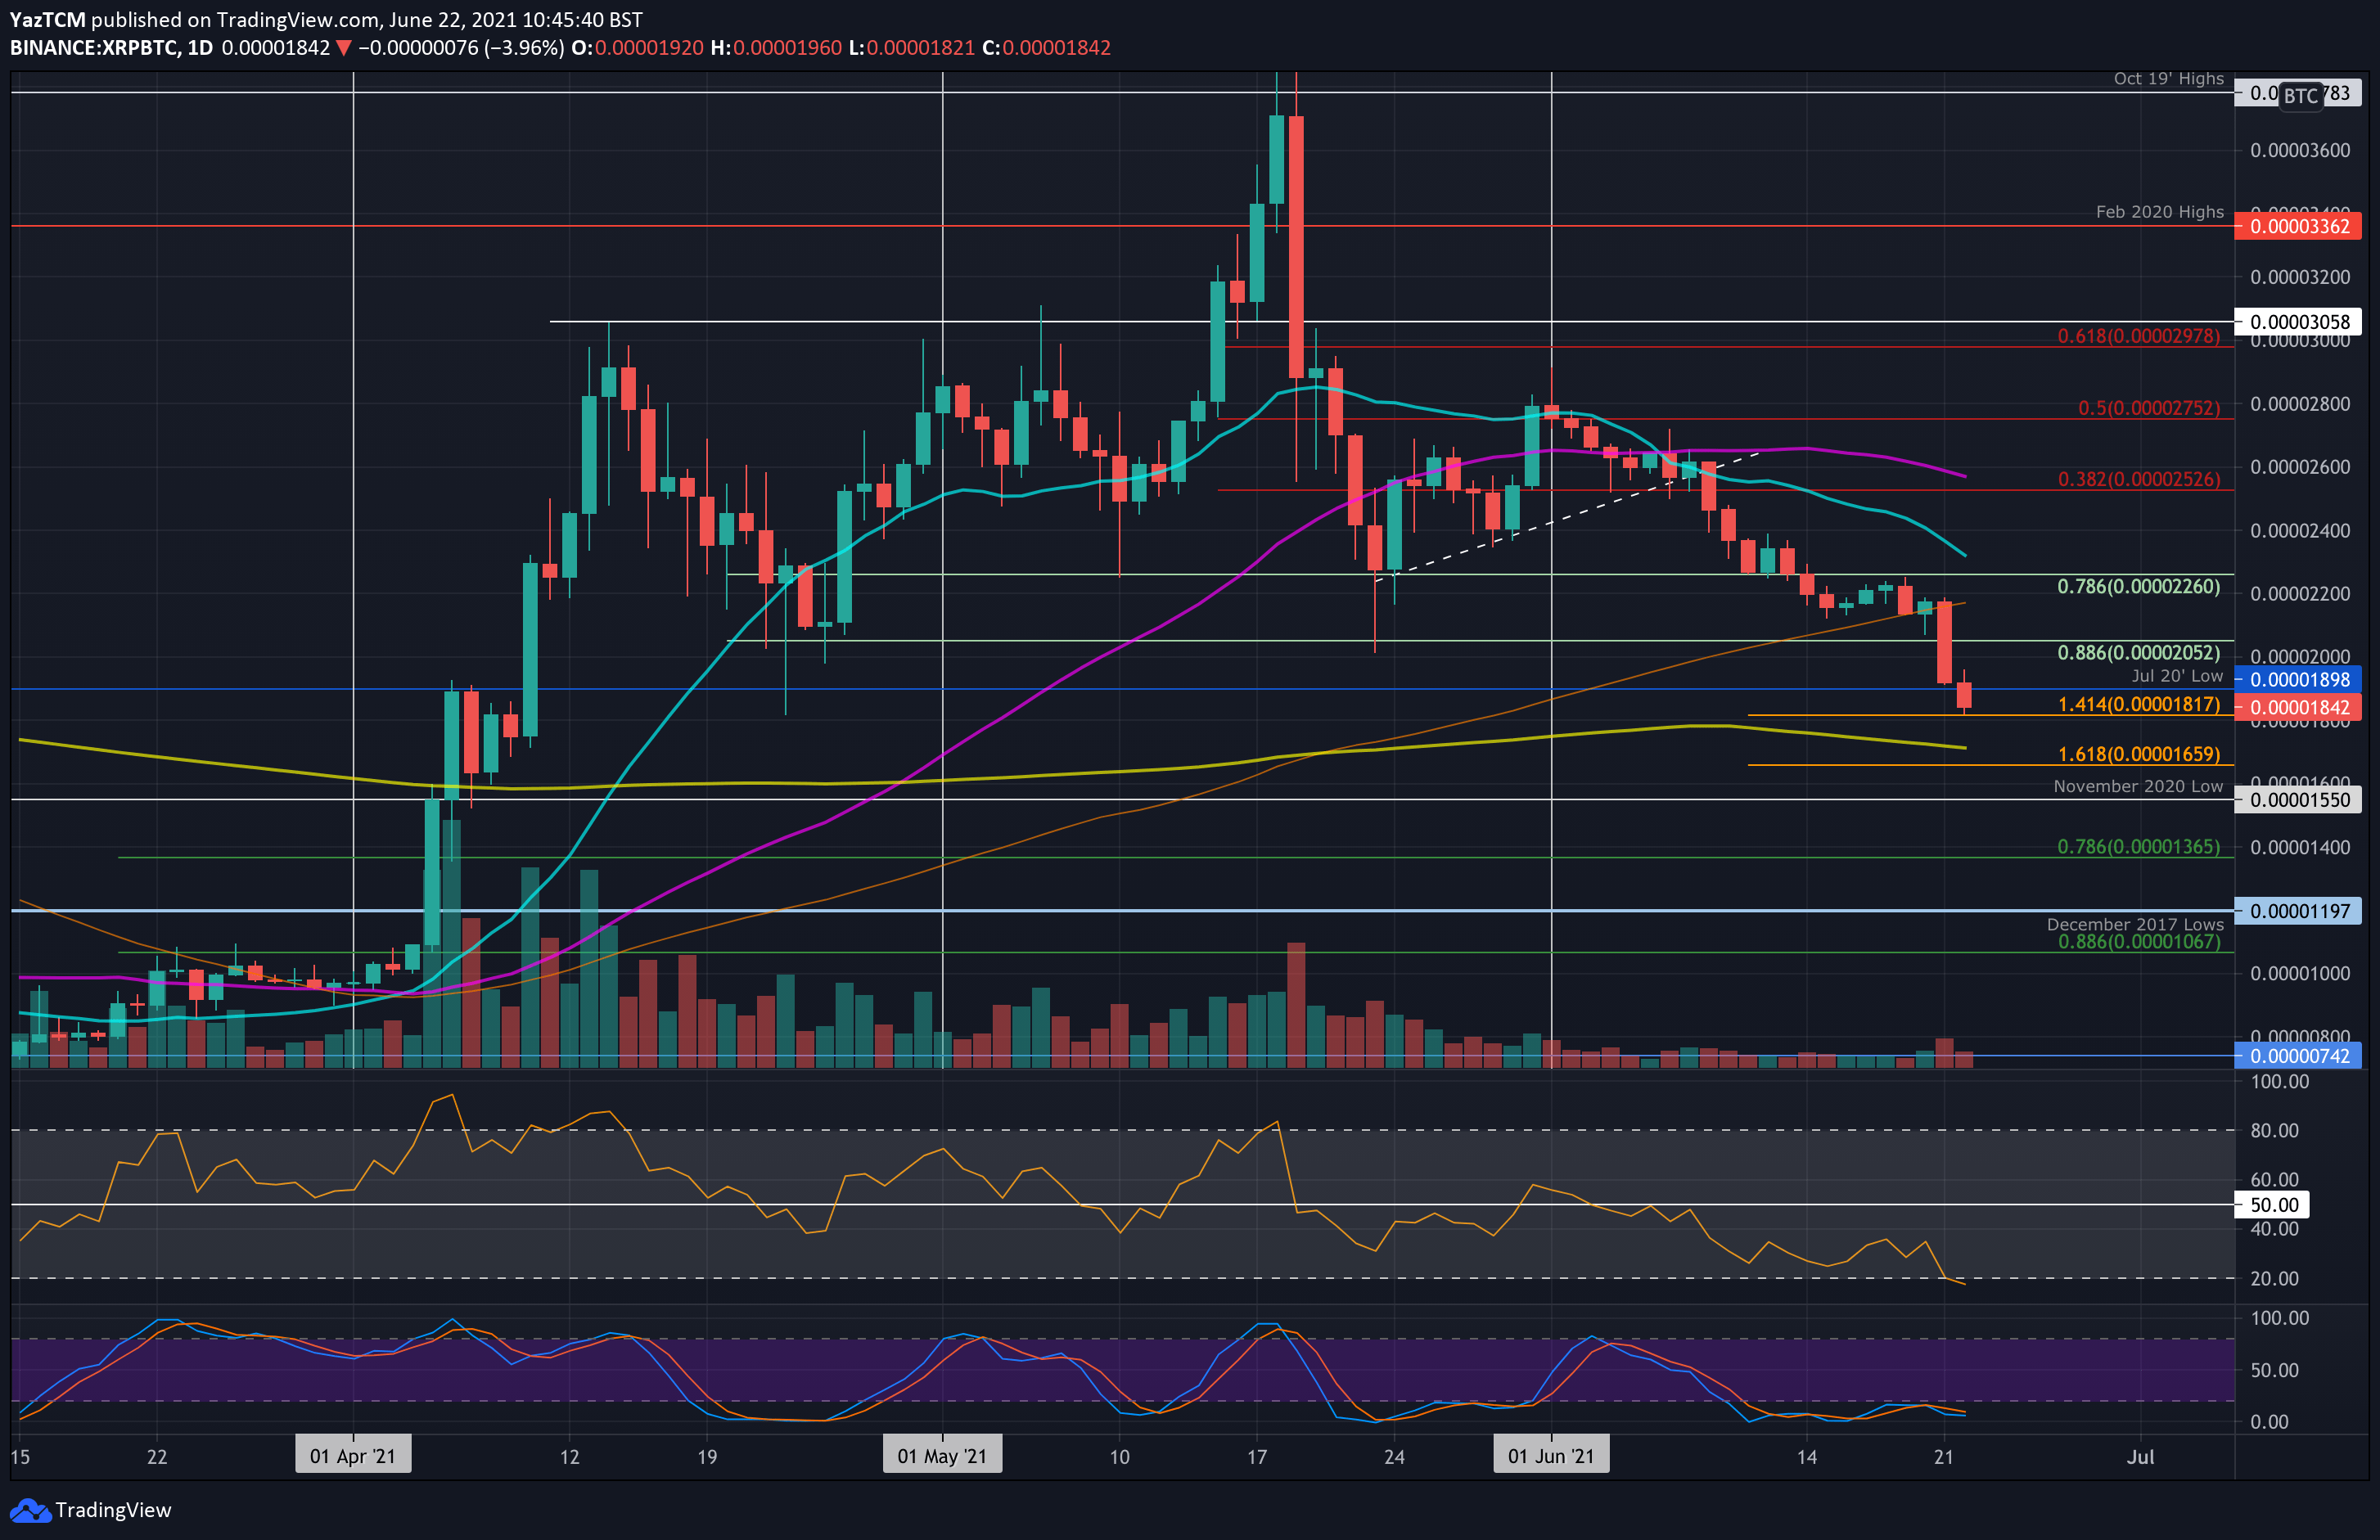
Key Support Levels: 1820 SAT, 1700 SAT, 1660 SAT.
Key Resistance Levels: 1900 SAT, 2000 SAT, 2200 SAT.
Against BTC, XRP broke the support at the 100-day MA yesterday as it fell from 2150 SAT and broke beneath 2000 SAT to hit the July 2020 lows at 1900 SAT.
It continued to drop today as it fell into support at 1820 SAT (downside 1.414 Fib Extension).
Looking ahead, if the sellers break 1820 SAT, the first support lies at 1700 SAT (200-day MA). This is followed by 1660 SAT (downside 1.618 Fib Extension), 1600 SAT, and 1550 SAT (November 2020 lows).
On the other side, the first resistance lies at 1900 SAT (July 20’ lows). This is followed by 2000 SAT, 2200 SAT (100-day MA), and 2300 SAT (20-day MA).
Likewise, the RSI is now showing extremely oversold conditions as it sits at levels not seen since December 2020. This indicates that the bears should be a little overextended now.