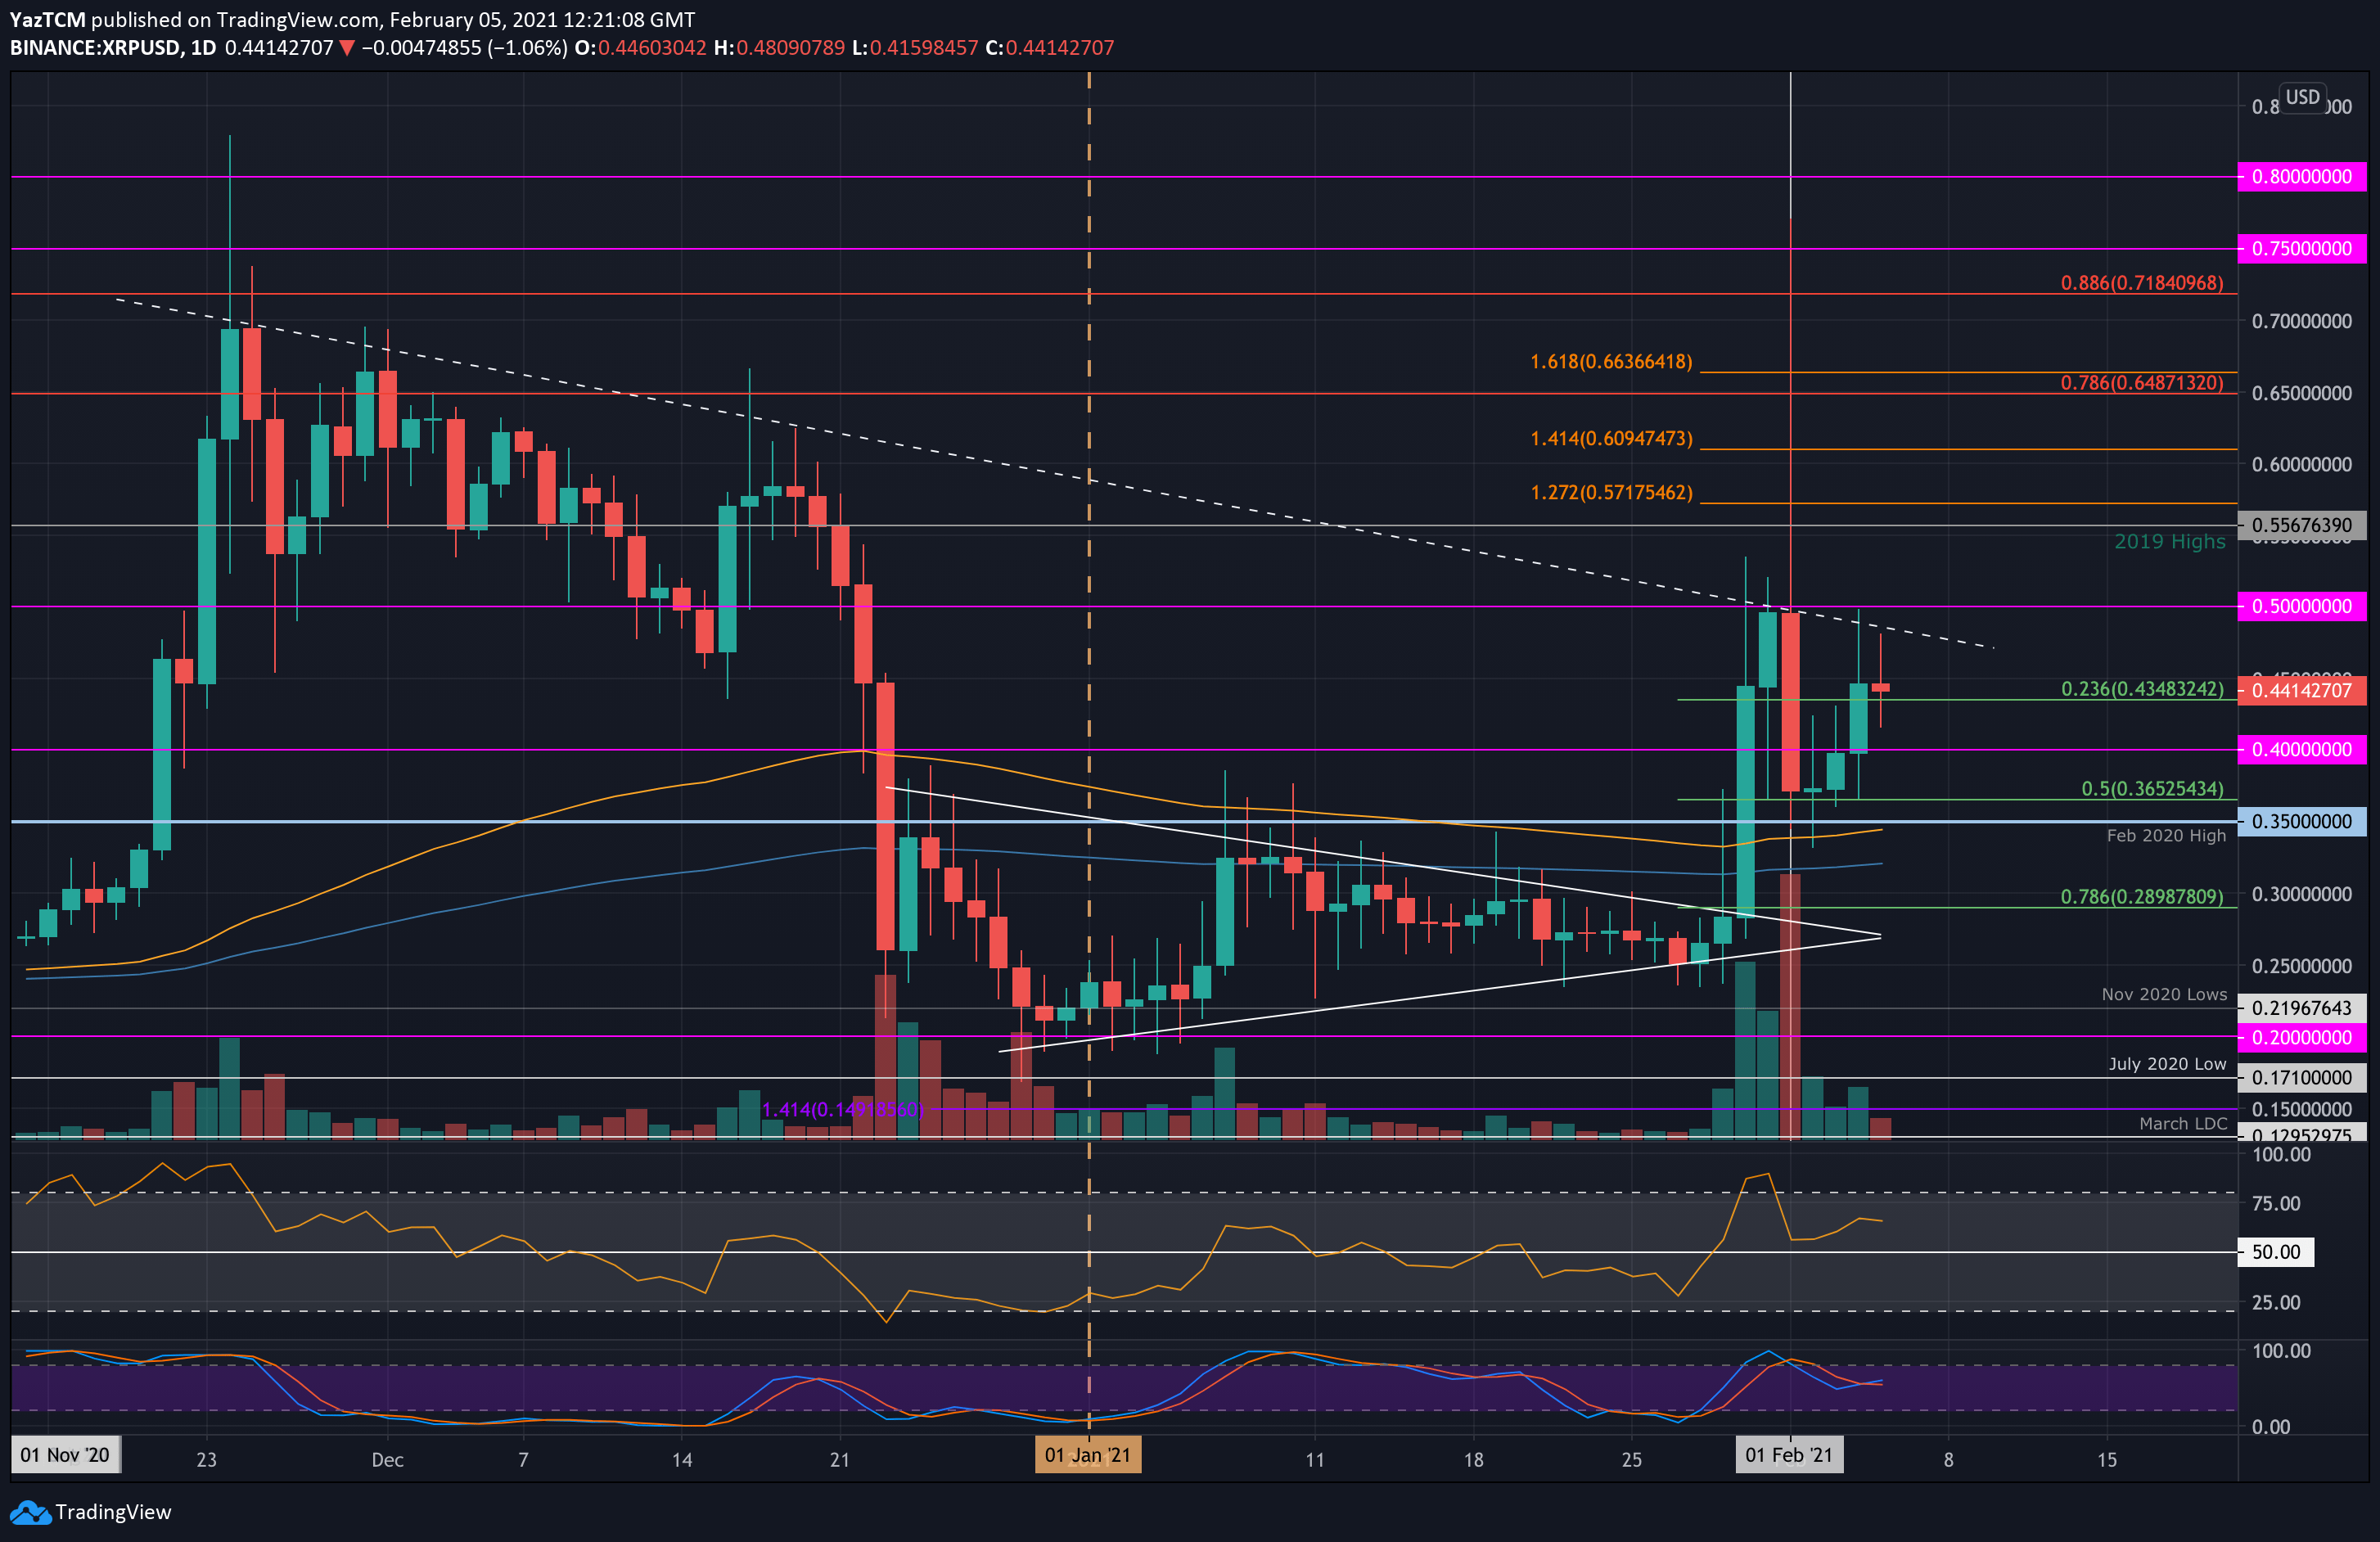
XRP/USD Daily Chart. Source: TradingView
Key Support Levels: $0.434, $0.4, $0.365.
Key Resistance Levels: $0.48, $0.5, $0.556.
XRP is now up by a whopping 60% over the past week. The coin had dropped lower from the opening price of $0.5 on Monday as it slipped into the .5 Fib support at $0.365. It managed to hold this support over the past few days until rebounding higher yesterday.
It managed to spike as high as $0.5 yesterday but eventually closed the daily candle at $0.45. There is strong resistance around $0.5, provided by a descending trend line that dates back to early December 2020.
A breakout above $0.5 is likely to send XRP much higher toward the December 2020 highs.
Looking ahead, the first resistance lies at the descending trend line, around $0.48. This is followed by $0.5, $0.556 (2019 Highs), $0.571 (1.272 Fib Extension), $0.609 (1.414 Fib Extension), and $0.658 (bearish .786 Fib).
On the other side, the first support lies at $0.434 (.236 Fib). This is followed by $0.4, $0.365 (.5 Fib), $0.35 (Feb 2020 high), and $0.3.
The daily RSI remains above 60, indicating the bulls are still in charge of the market momentum.
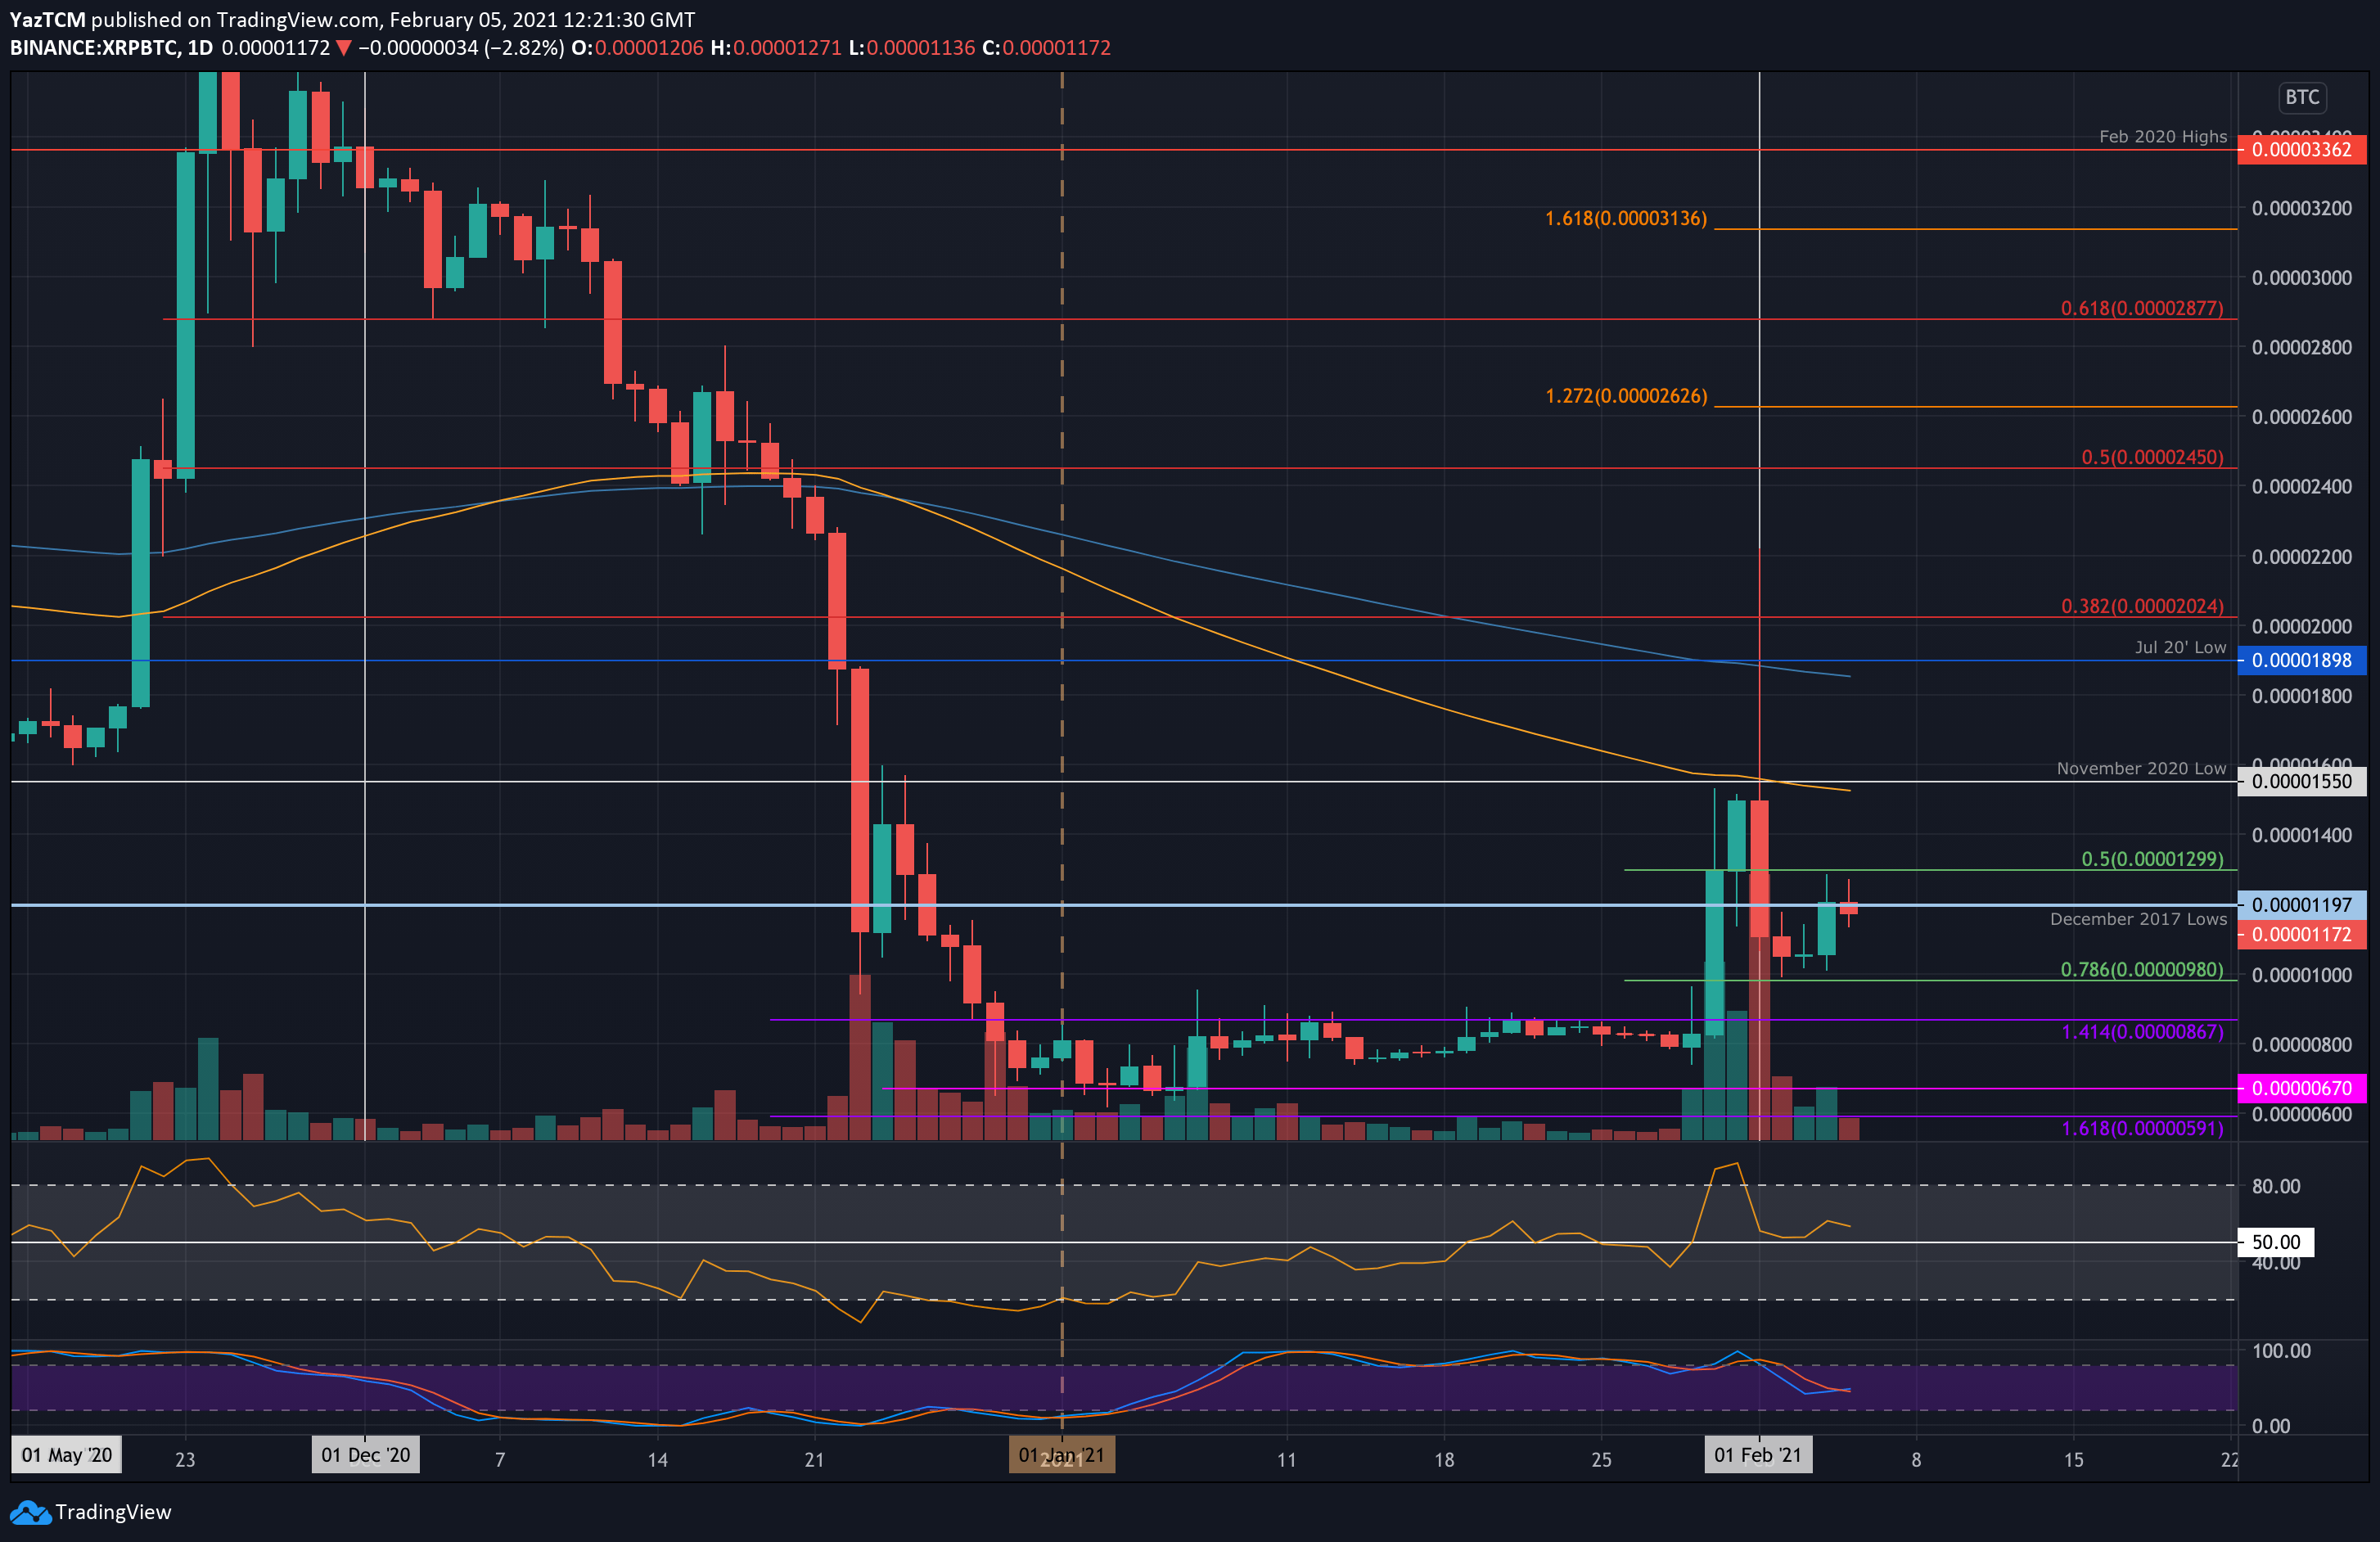
Key Support Levels: 1000 SAT, 980 SAT, 867 SAT.
Key Resistance Levels: 1200 SAT, 1550 SAT, 1900 SAT.
Against Bitcoin, XRP also fell lower from 1550 SAT on Monday. It went on to find support at 980 SAT through the week and held above this level. Yesterday, it rebounded and started to push higher, reaching as high as 1300 SAT.
However, XRP could not close a daily candle above 1200 SAT (December 2017 lows) and is attempting to breach this resistance today.
XRP/BTC would need to break the resistance at 1900 SAT (200-days EMA) to turn bullish again.
Moving forward, the first resistance lies at 1200 SAT (December 2017 lows). This is followed by resistance at 1550 SAT (November 2020 low & 100-days EMA) and 1900 SAT (July 2020 low & 200-days EMA).
On the other side, the first support lies at 1000 SAT. This is followed by 980 SAT (.786 Fib), 867 SAT (previous range resistance), 750 SAT, and 670 SAT (previous range support).
The RSI is marginally above the midline, indicating weak bullish momentum within the market. It would need to start rising for XRP to head back above 1550 SAT.