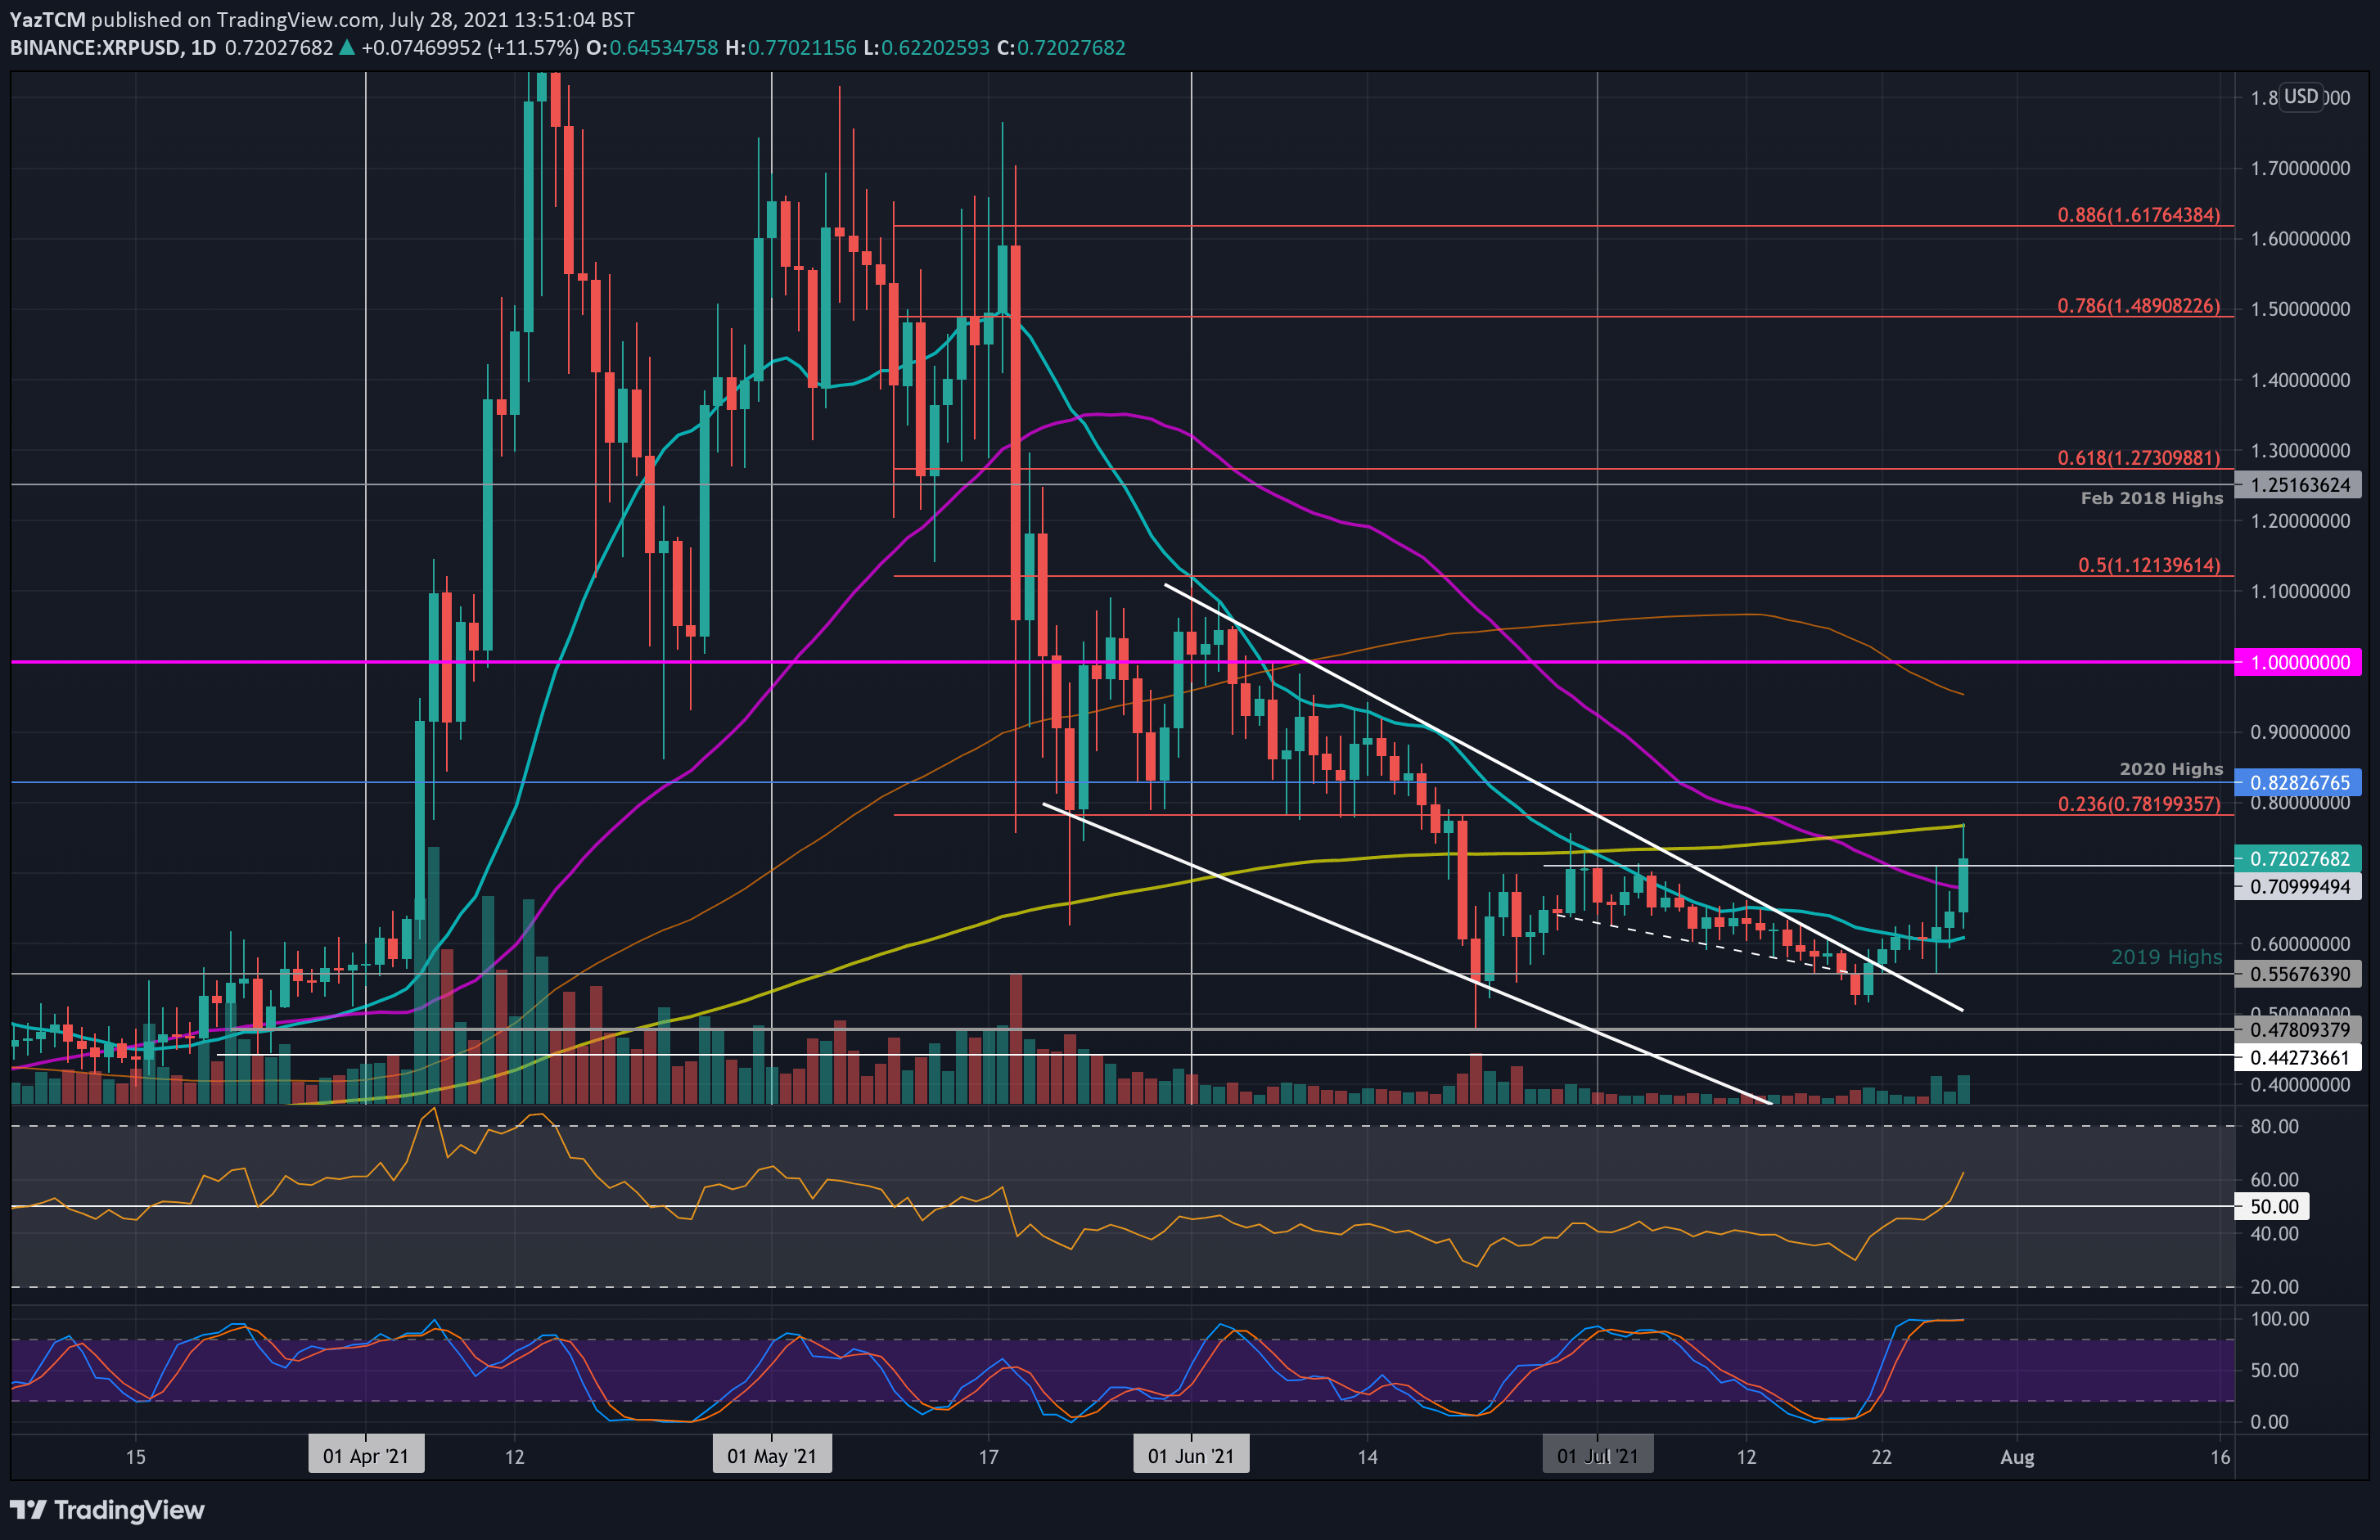
XRP/USD Daily Chart. Source: TradingView.
Key Support Levels: $0.7, $0.679, $0.6.
Key Resistance Levels: $0.768-$0.782, $0.8282, $0.9.
XRP saw an impressive 10% gain today after announcing a remittance corridor between Japan and the Philipines. It had surged up to 15% but has since retraced a bit. In addition, the coin managed to break the 20-day MA level at $0.6 on Monday and has since continued above it.
Before this, XRP was trading inside a descending wedge formation which was penetrated last week after a double-bottom formed at around $0.51.
Today’s price hike allowed XRP to pass $0.72 and reach as high as $0.768, where it found resistance at the 200-day MA. It has since dropped to around $0.72.
Looking ahead, the first resistance lies between $0.768 (200-day MA) and $0.782 (bearish .236 Fib). This is followed by $0.8282 (2020 high), $0.9, $0.95 (100-day MA), and $1.00.
On the other side, the first support lies at $0.7. This is followed by $0.679 (50-day MA), $0.6 (20-day MA), and $0.556 (2019 highs).
The RSI is now above the 60 level for the first time since early May. This indicates the bullish momentum is the highest since then, and it is growing stronger.
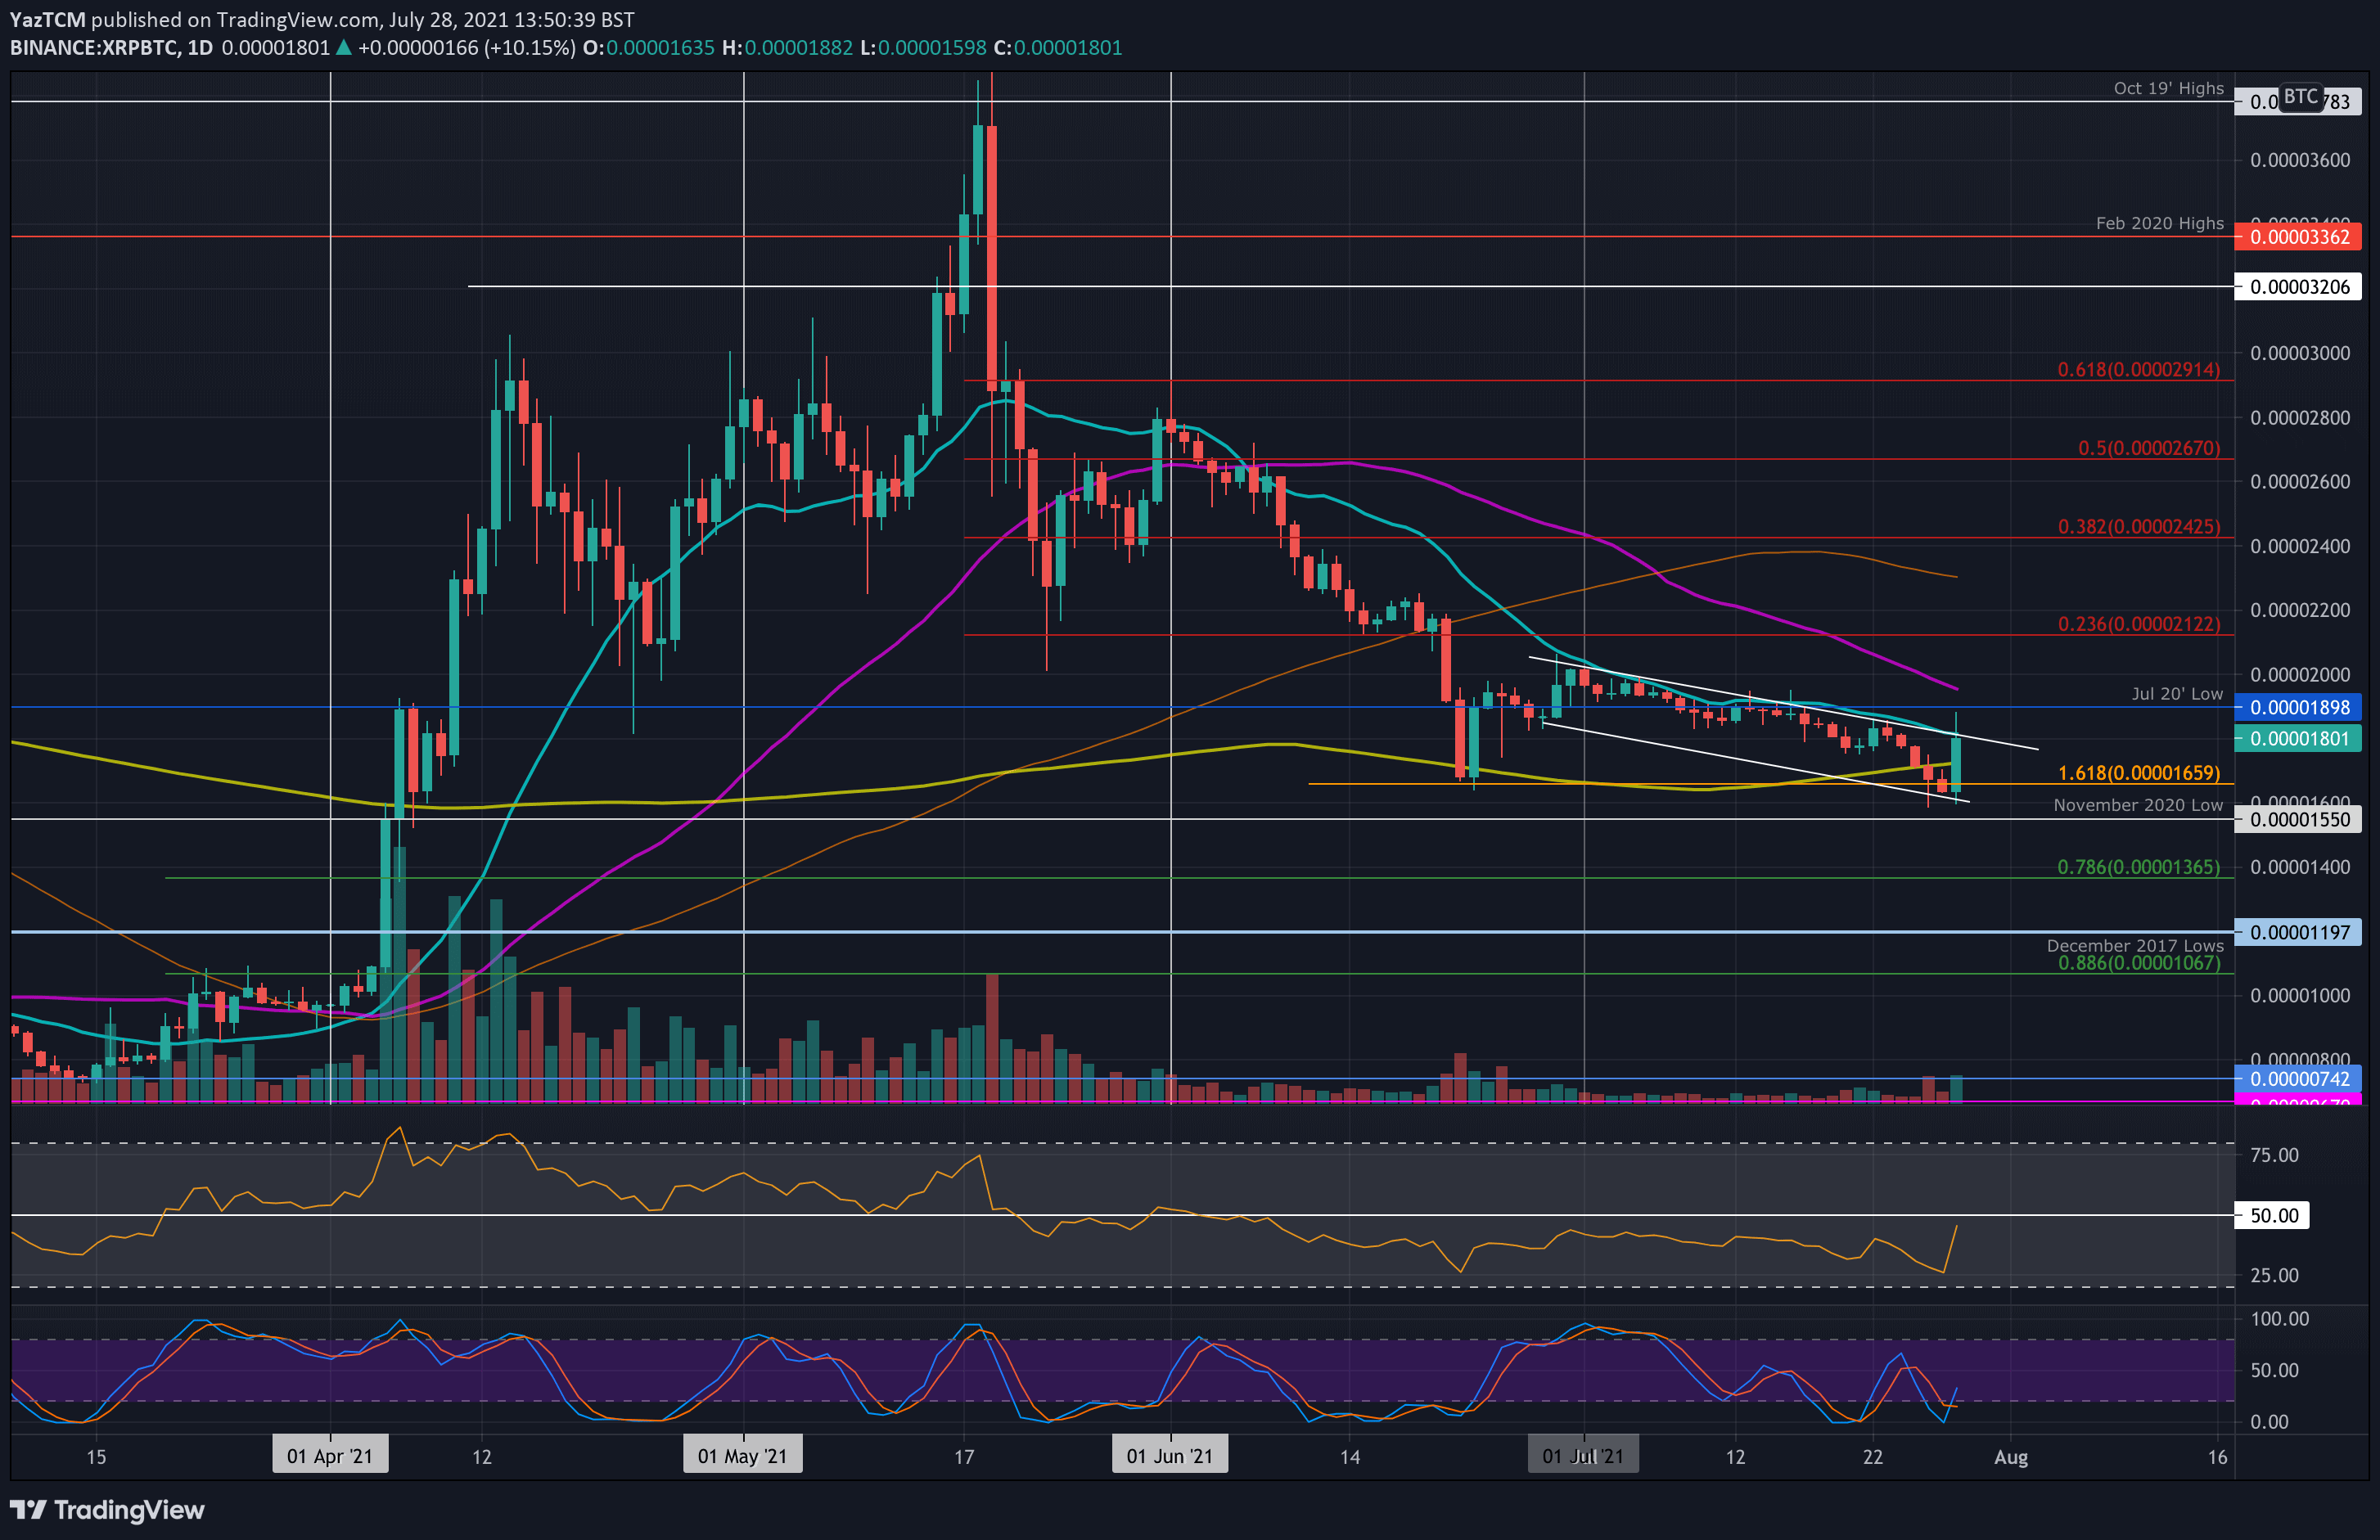
Key Support Levels: 1730 SAT, 1660 SAT, 1600 SAT.
Key Resistance Levels: 1800 SAT, 1900 SAT, 1960 SAT.
Against BTC, XRP hit a fresh three-month low this week after reaching 1600 SAT. The cryptocurrency has traded inside a descending price channel since the start of July. The recent drop to 1600 SAT allowed the market to find support at the lower boundary of the price channel.
Today, XRP rebounded from 1600 SAT to reach as high as 1890 SAT. Unfortunately, it is struggling to stay above the resistance at the upper angle of the price channel around 1800 SAT, which is further bolstered by the 20-day MA level.
Looking ahead, the first resistance lies at 1800 SAT (20-day MA). This is followed by 1900 SAT (July 2020 low), 1960 SAT (50-day MA), 2000 SAT, and 2120 SAT (bearish .236 Fib).
On the other side, the first support lies at 1730 SAT (200-day MA), 1660 SAT, 1600 SAT, and 1550 SAT (Nov 2020 low).
The RSI rebounded from near oversold conditions. It still remains beneath the midline, but the recent uptick indicates the bearish momentum might be weakening.