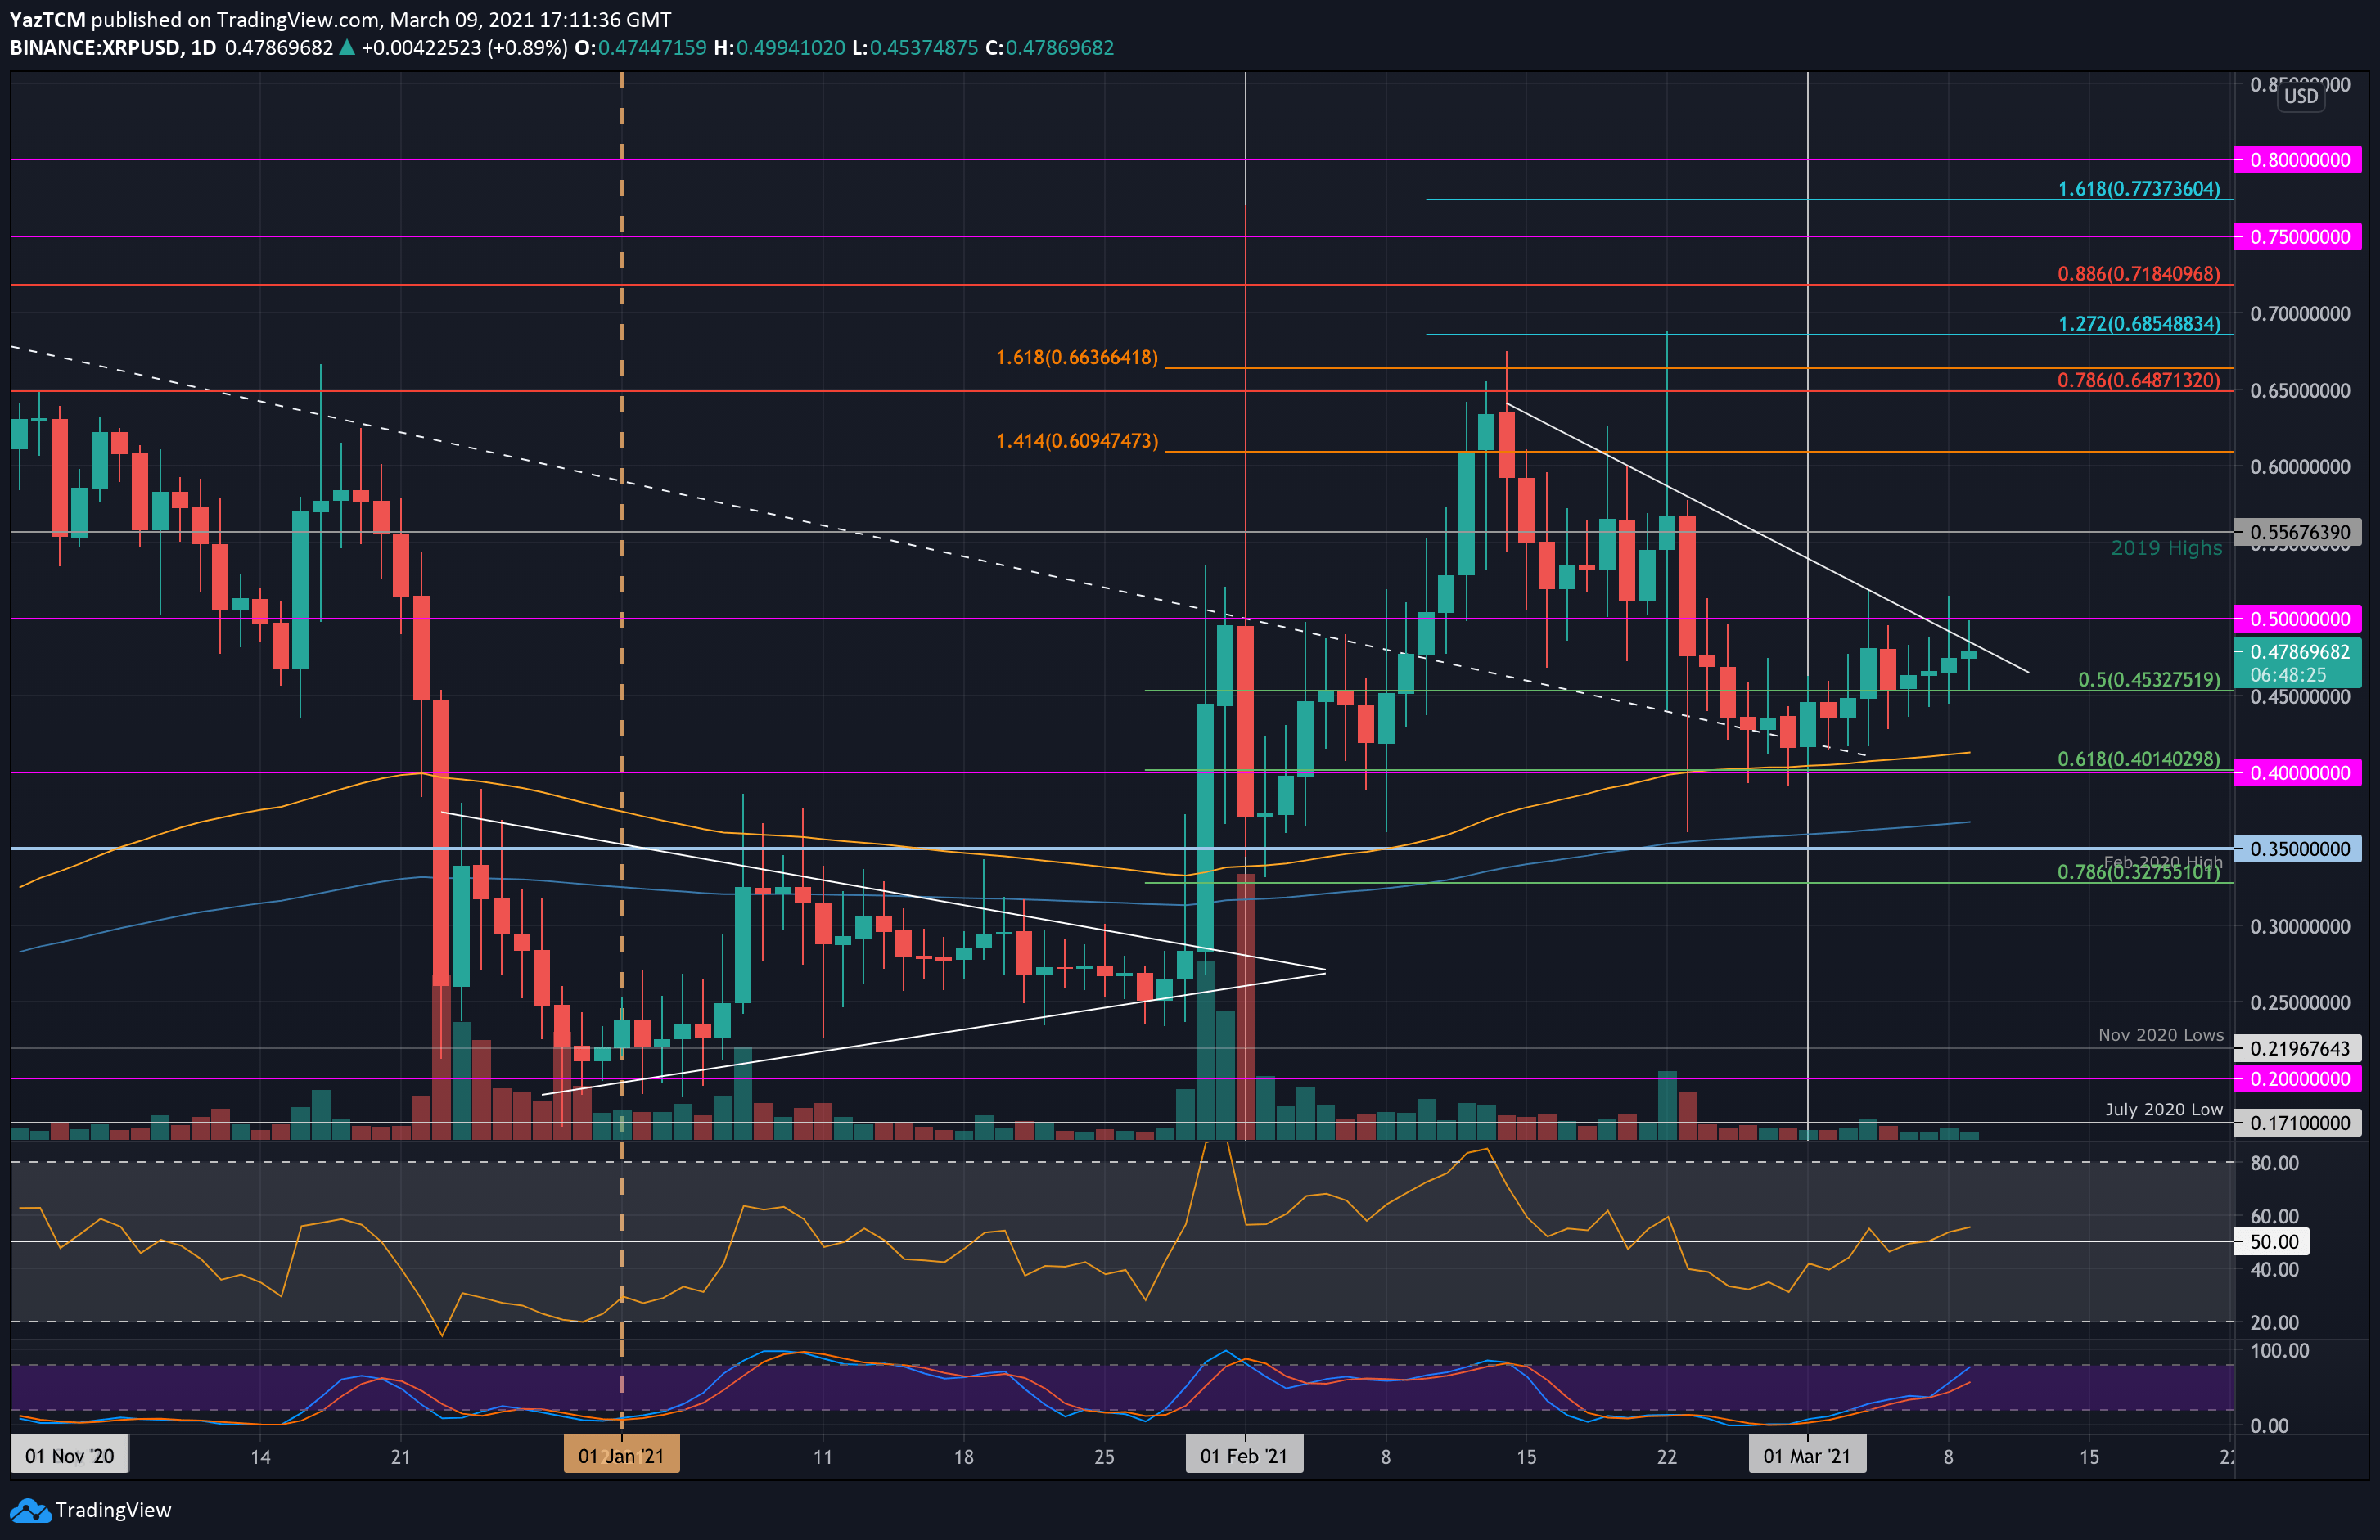
XRP/USD Daily Chart. Source: TradingView
Key Support Levels: $0.45, $0.41, $0.4.
Key Resistance Levels: $0.5, $0.556, $0.6.
XRP is currently trading inside a falling wedge pattern as it attempts to break the upper boundary. The coin had dropped lower from $0.56 in the last days of February as it collapsed into the support near $0.4 (the 100-day EMA line).
It then rebounded from $0.4 at the beginning of this month and has since found solid support at $0.45 (.5 Fib) over the past six days. However, XRP is still struggling to close a daily candle above $0.5.
Looking ahead, the first level of support lies at the upper boundary of the wedge. This is followed by resistance at $0.5. Beyond $0.5, next resistance levels lie sat $0.556 (2019 Highs), $0.6, and $0.648 (bearish .786 Fib).
On the other side, the first level of support lies at $0.45 (.5 Fib). This is followed by $0.41 (100-days EMA), $0.4 (.618 Fib), and $0.37 (200-days EMA).
The RSI is just poking above the midline, indicating indecision within the market. To break resistance at $0.5, the RSI must rise higher to indicate increased bullish momentum.
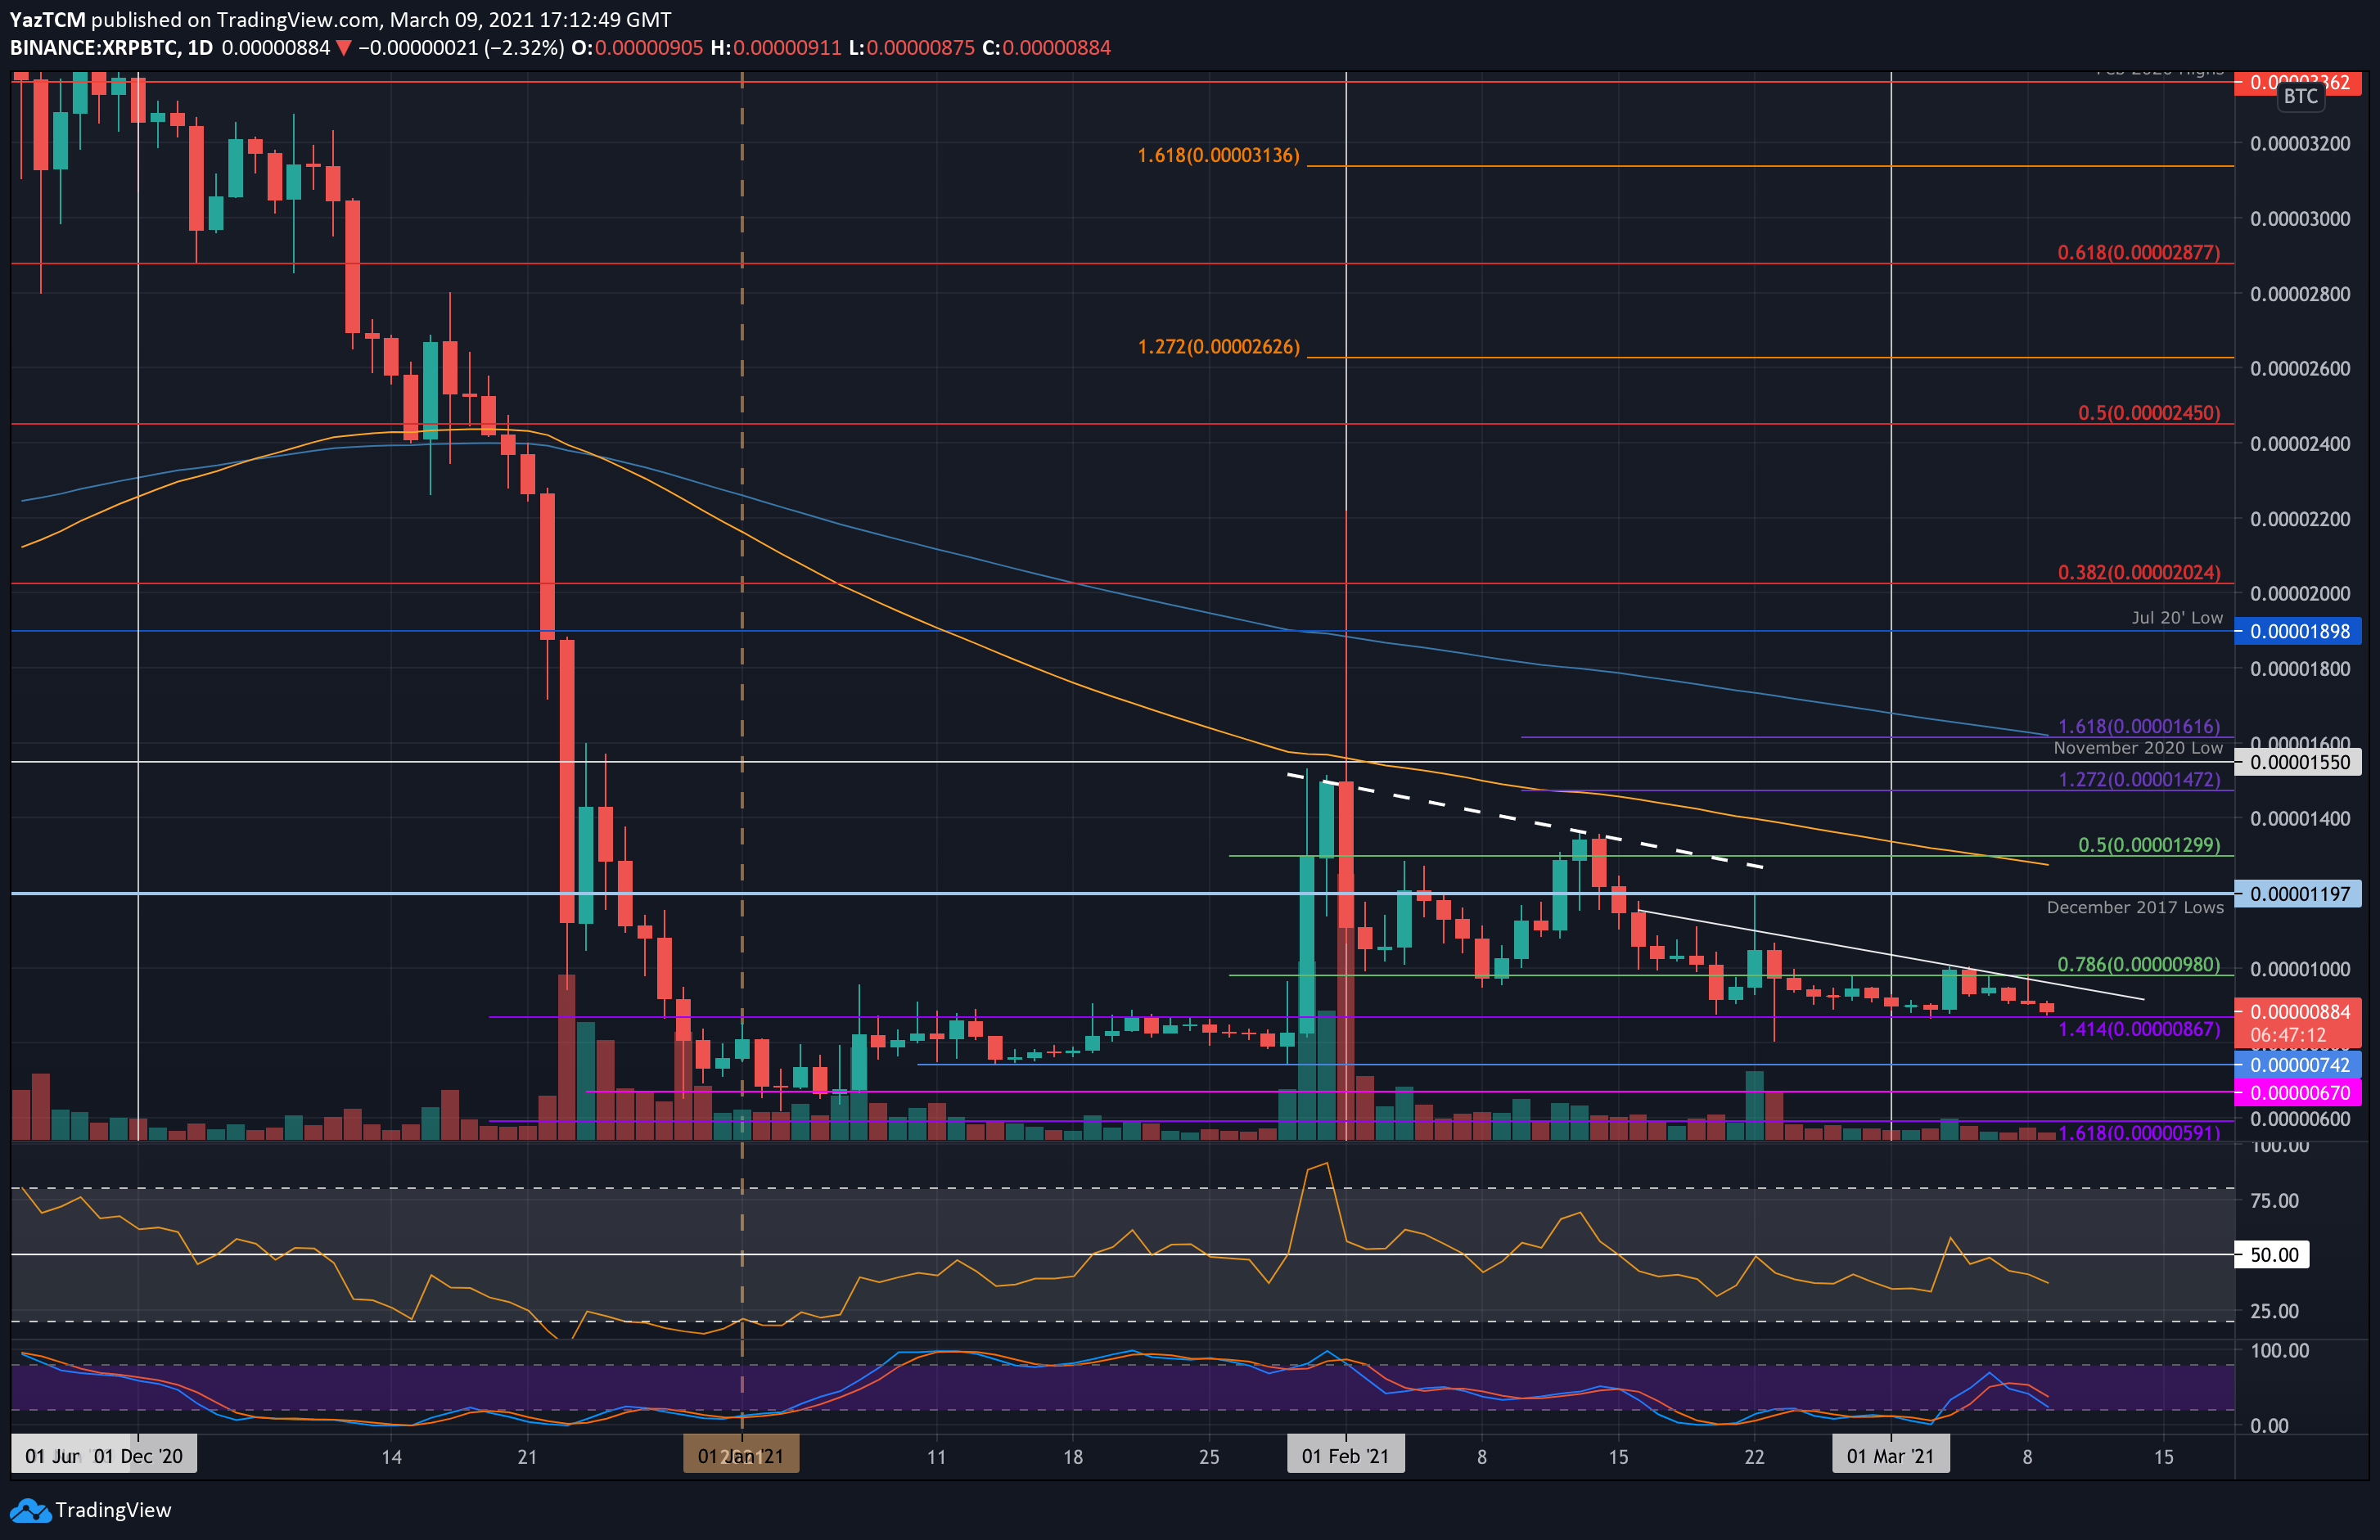
Key Support Levels: 867 SAT, 800 SAT, 742 SAT.
Key Resistance Levels: 1000 SAT, 1200 SAT, 1300 SAT.
Against Bitcoin, XRP recently started to form a descending triangle formation. The base of this triangle lies at 867 SAT, which was the upper boundary resistance for the trading range during January 2021.
The coin has made two attempts in March to break above the upper angle of the triangle and had failed on both occasions. Nevertheless, it is currently trading inside the triangle, but bearish triangles tend to break to the downside.
Moving forward, the first level of resistance lies at the upper angle of the triangle. This is followed by 1000 SAT, 1200 SAT (December 2017 lows), 1300 SAT (100-days EMA), and 1550 SAT (November 2020 lows).
On the other side, the first level of support lies at the base of the triangle at 867 SAT. This is followed by 800 SAT, 742 SAT, and 670 SAT (the lower boundary of January’s trading range).
The RSI is well beneath the midline, indicating the bears are in charge of the market momentum. If the RSI continues to dive, XRP can certainly be expected to break the lower boundary of the current triangle.