The price of Ripple’s XRP token has seen a small decrease of 1.21% over the past 24 hours, but it has managed to remain above the $0.42 support level and is currently trading around $0.43. XRP had previously broken toward the upside but failed to make ground above the $0.46 resistance level, causing it to drop to $0.43. This is despite the seemingly major announcement that Ripple recently entered into a strategic partnership with major money transfer giant MoneyGram.
XRP has now seen an 8.36% price rise over the past 7 days, with a further 35% price increase over the past 3 months. The cryptocurrency is currently the third-largest by market capitalization, boasting a market cap of approximately $18.33 billion.
Looking at the XRP/USD 1-day chart:
- Since our last XRP/USD analysis, XRP has broken above the previous short-term symmetrical triangle pattern on the 4-hour chart and continued to climb higher. However, XRP was unable to overcome resistance at $0.46 and has since fallen to $0.43.
- From above: The nearest level of resistance now lies at $0.4375 followed by the resistance at $0.46. The resistance at $0.46 is particularly strong and caused problems for the bulls back in May 2019. Above $0.46, the next levels of resistance lie at $0.48 and $0.50. Above $0.50, further resistance is found at $0.508, $0.52, $0.5375, and $0.55.
- From below: The nearest level of support now lies at $0.42. Beneath this, we can expect support at the 2-month-old established rising trend line. Below the trend line, further support lies at $0.40, $0.39, and $0.3790. If the selling continues, then more support is located at $0.36, $0.3550, and $0.35.
- The trading volume has been fairly high during June and remains above average.
- The Stochastic RSI has recently reached overbought conditions, which could suggest that the market may be a little overbought.
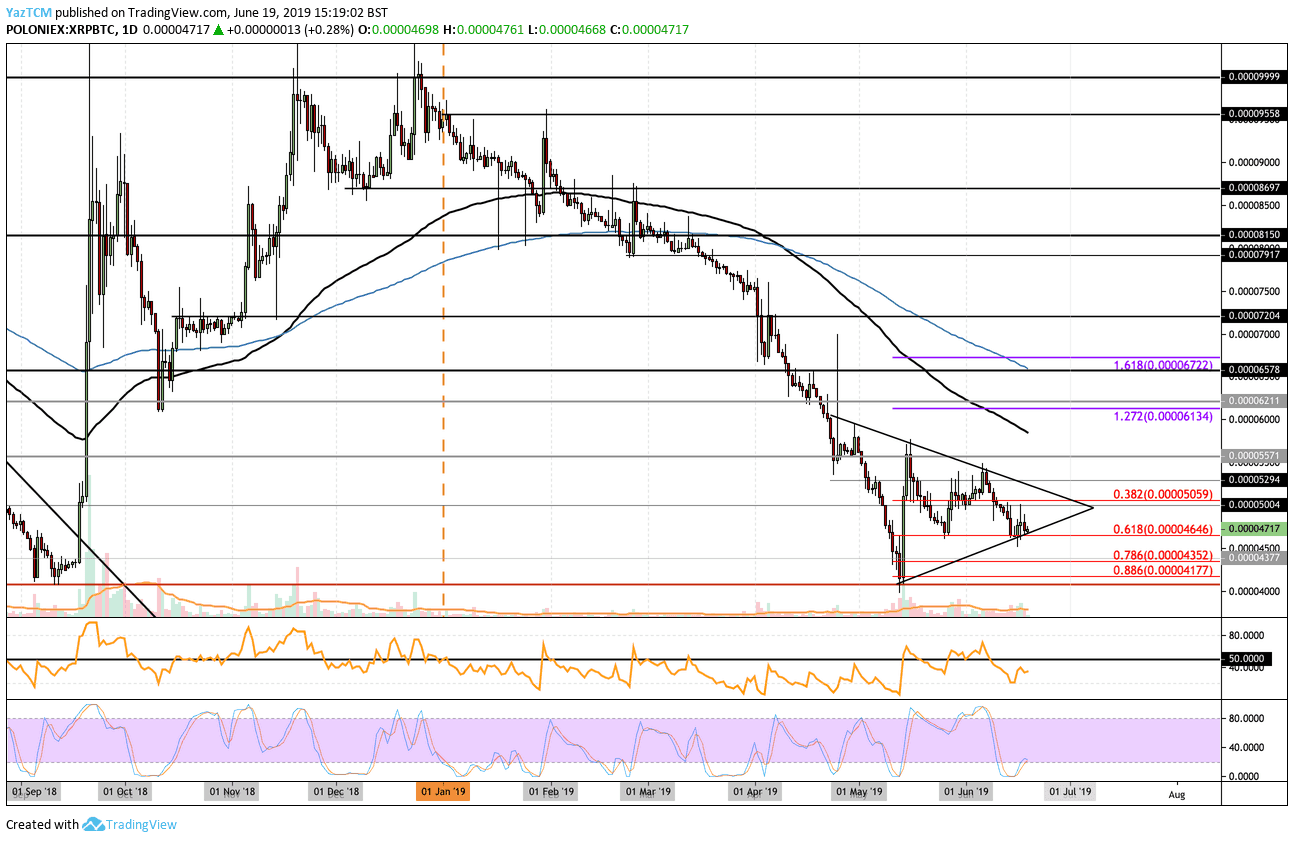
Looking at the XRP/BTC 1-day chart:
- Against Bitcoin, XRP is really struggling to make any movement above the 5,000 satoshi level. It is currently trading at 4,717 sat as it rests at support provided by the lower boundary of an acute symmetrical triangle.
- From above: The nearest level of resistance lies at 5,000 sat. Above this, we can expect resistance at 5,100 sat and then at the upper boundary of the triangle. If the buying continues above the triangle, further resistance lies at 5,300 sat, 5,570 sat, 6,000 sat, and 6,200 sat.
- From below: The nearest level of support now lies at the lower boundary of the triangle. If the selling breaks below the triangle, support then lies at 4,500 sat, 4,352 sat, 4,200 sat, and 4,000 sat.
- The Stochastic RSI recently produced a crossover above signal, indicating that the bulls may be ready to take over the market momentum pretty soon.
SPECIAL OFFER (Sponsored)
LIMITED OFFER 2024 for CryptoPotato readers at Bybit: Use this link to register and open a $500 BTC-USDT position on Bybit Exchange for free!
Disclaimer: Information found on CryptoPotato is those of writers quoted. It does not represent the opinions of CryptoPotato on whether to buy, sell, or hold any investments. You are advised to conduct your own research before making any investment decisions. Use provided information at your own risk. See Disclaimer for more information.
Cryptocurrency charts by TradingView.