XRP/USD:
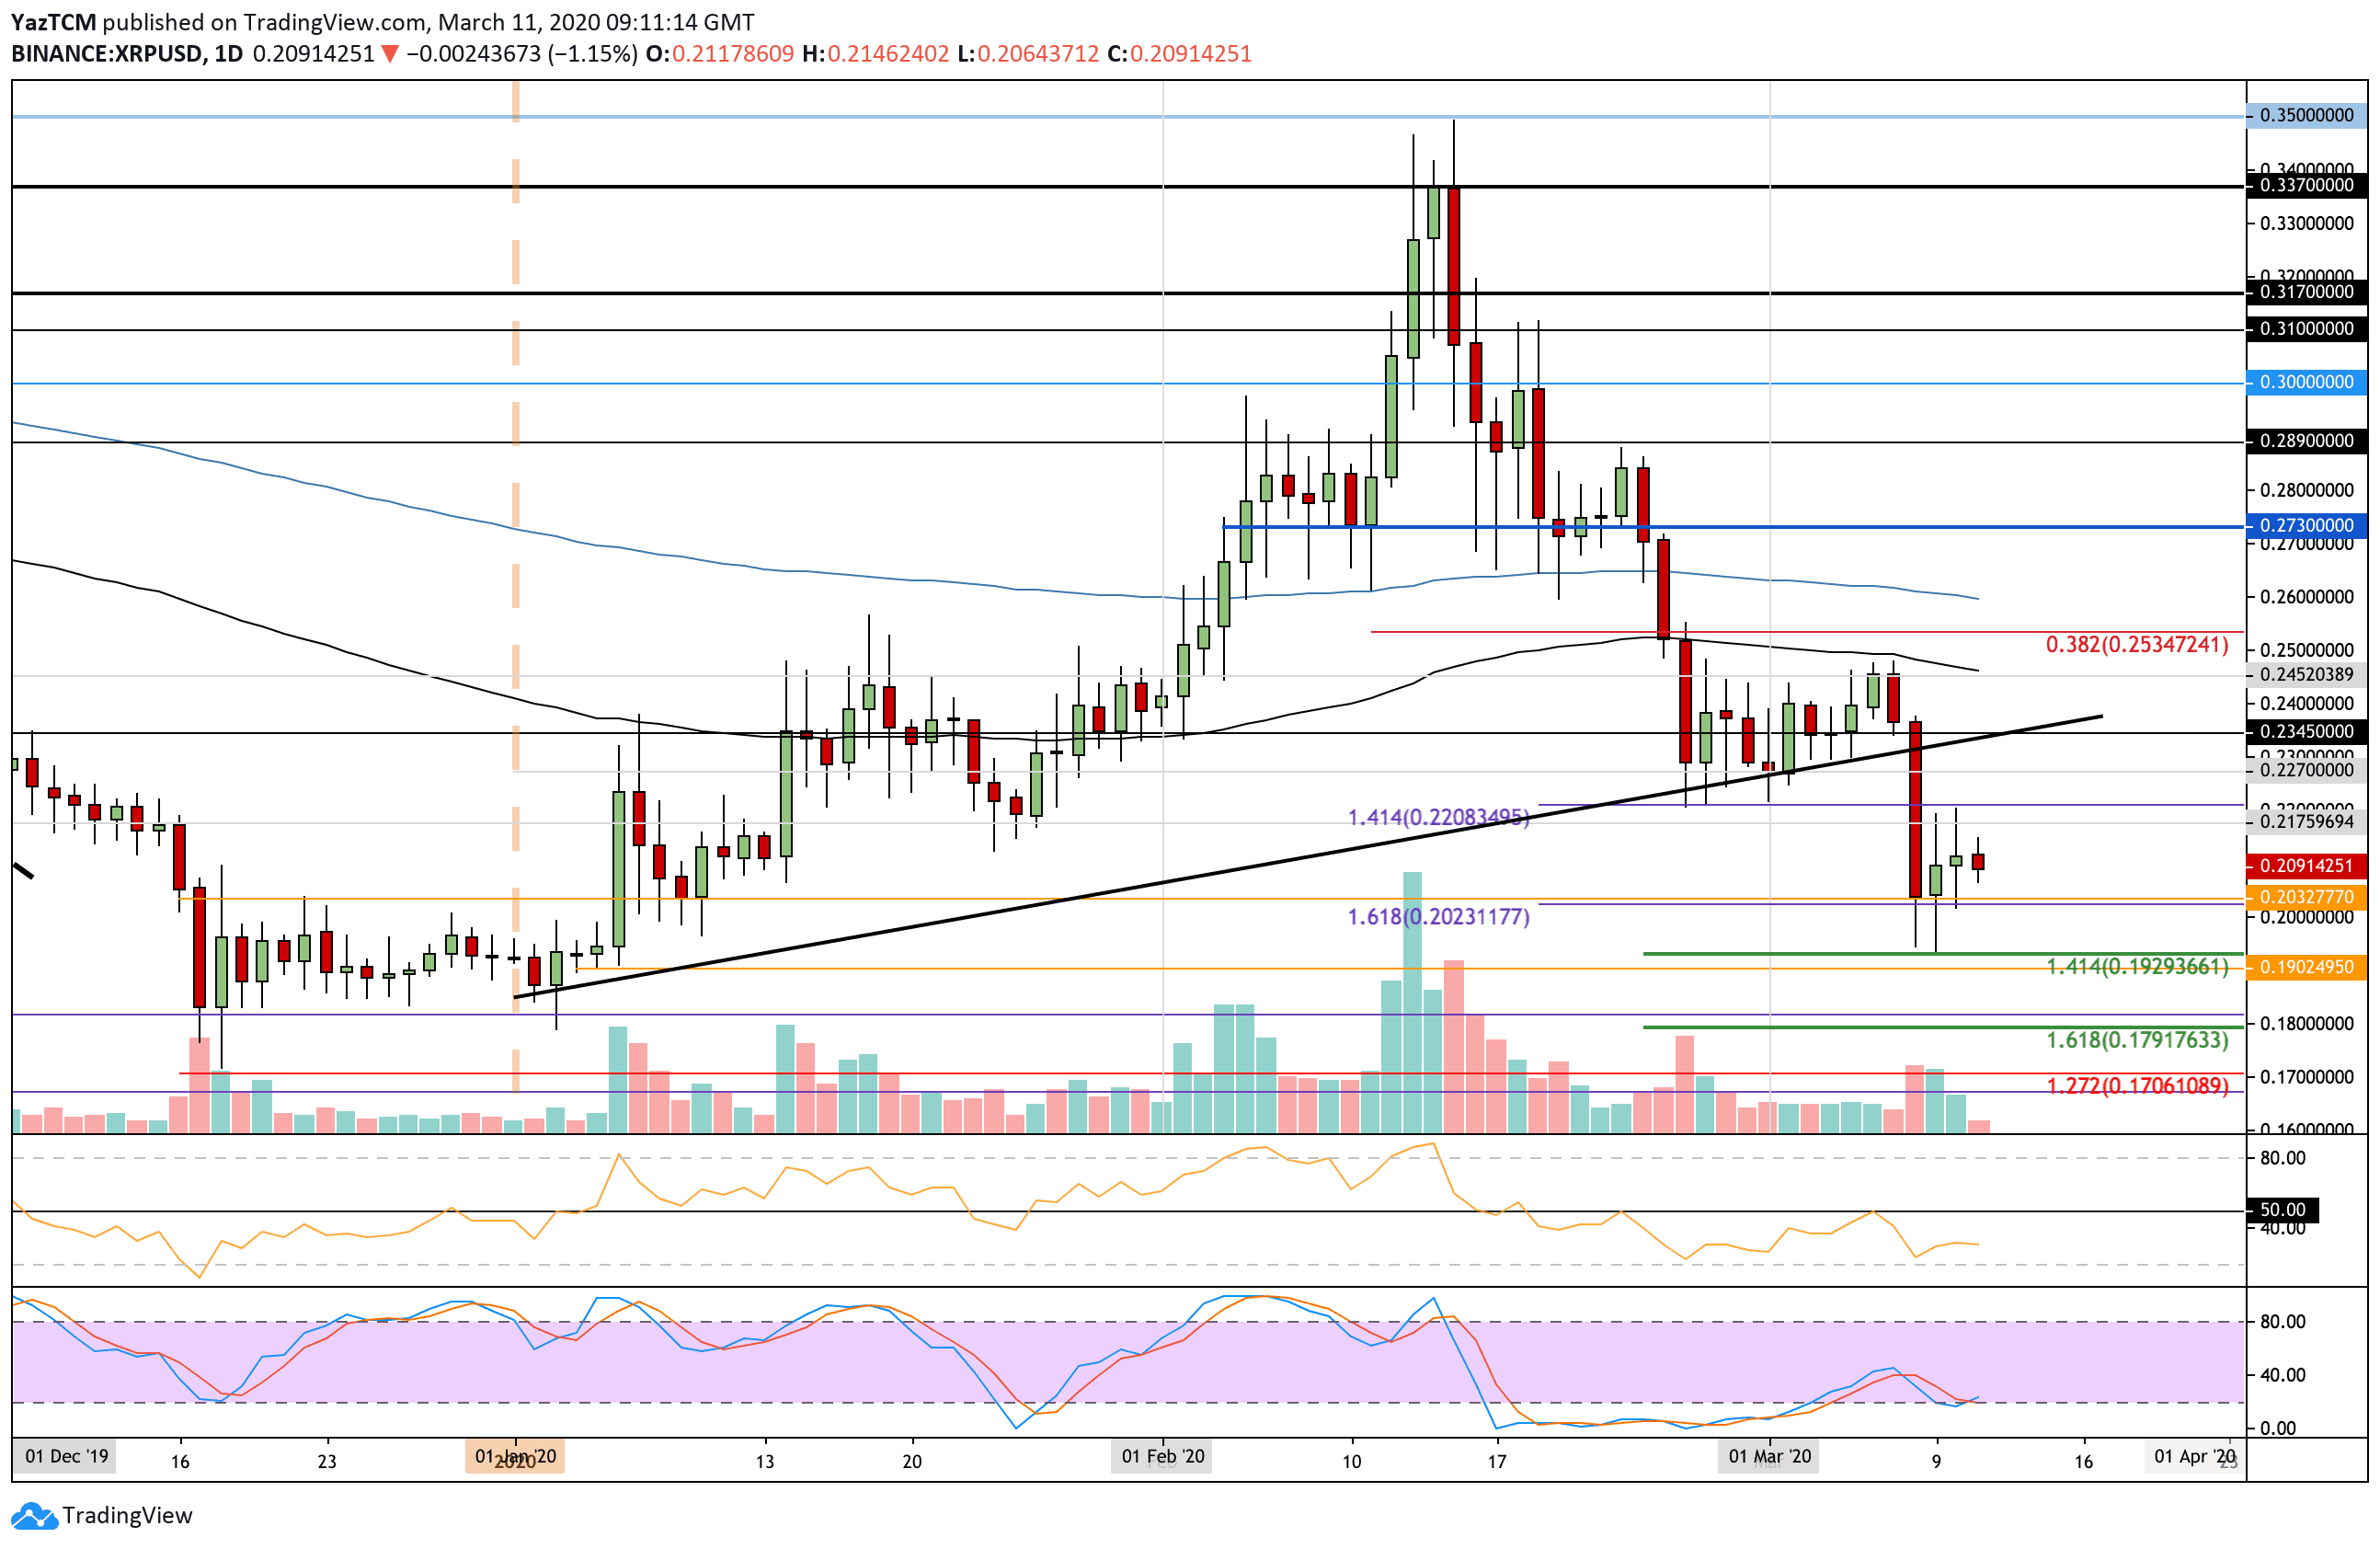
Support: $0.20, $0.195, $0.19.
Resistance: $0.22, $0.227, $0.235.
XRP/BTC:
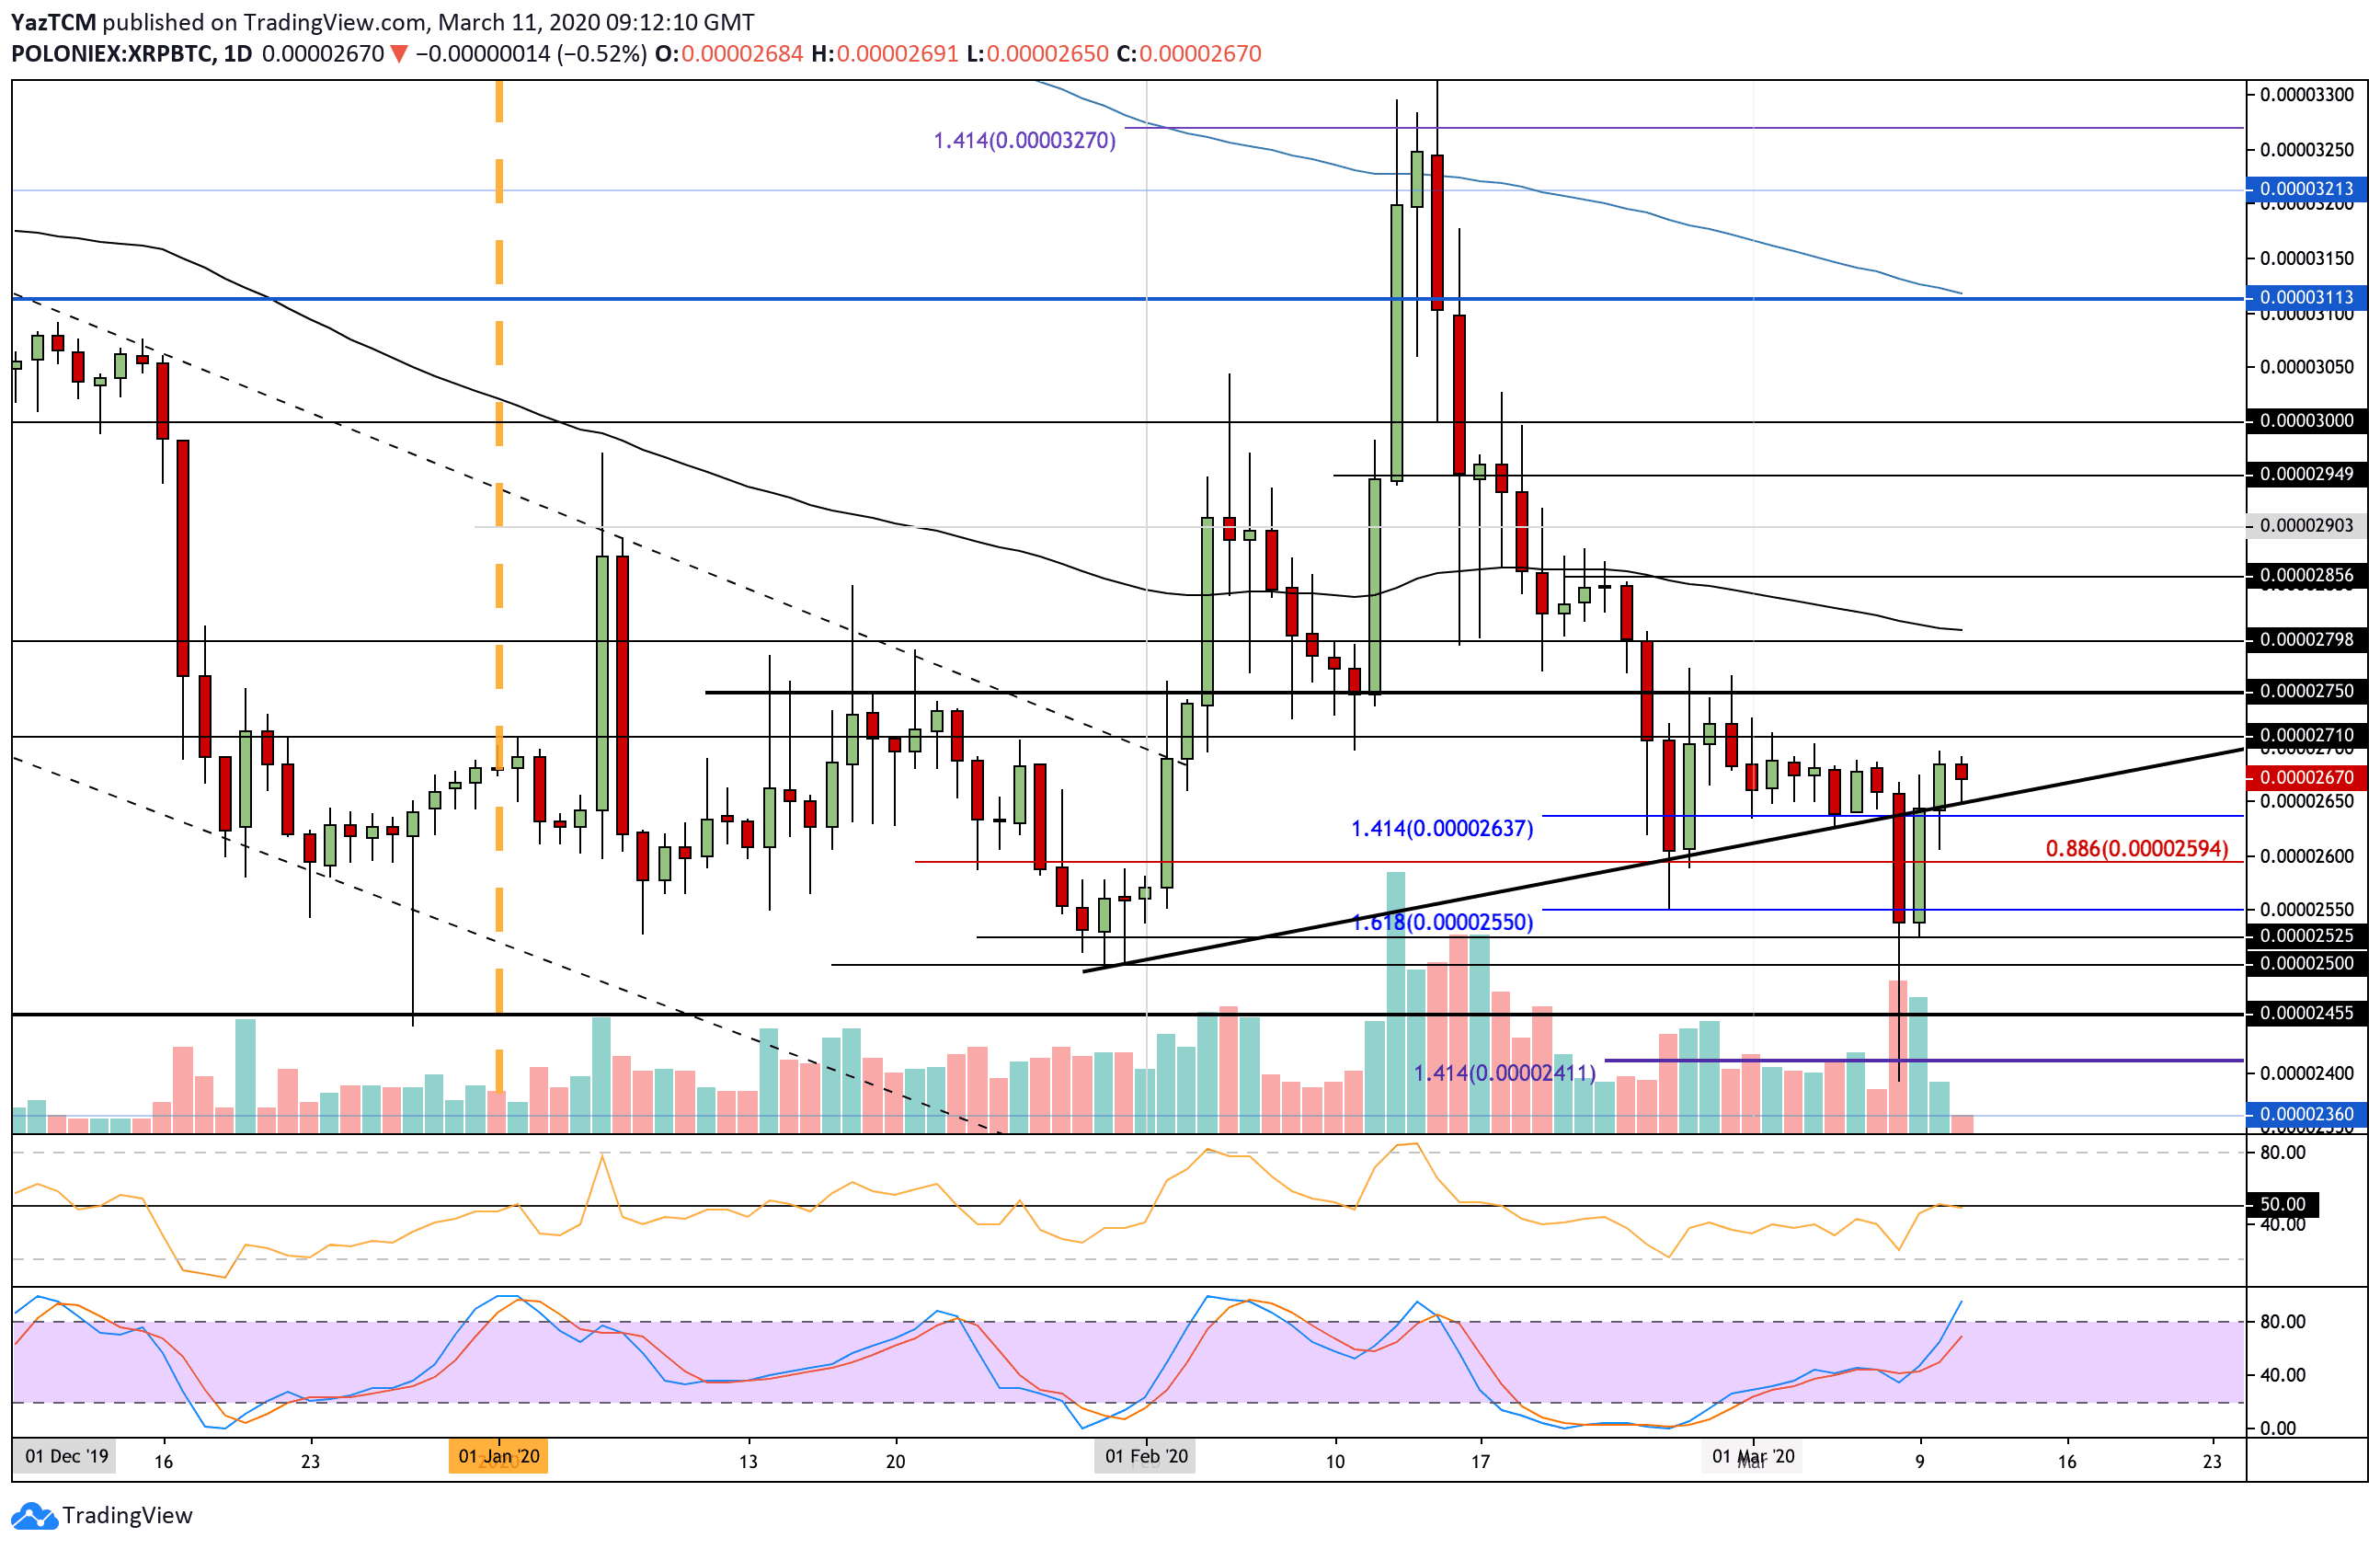
Support: 2640 SAT, 2600 SAT, 2550 SAT.
Resistance: 2710 SAT, 2750 SAT, 2800 SAT.
Since our latest analysis, XRP continued to climb higher from the $0.20 support as it reached a high of $0.22. The coin was unable to break above the latter level, which caused it to drop to the current price of $0.209.
XRP is pretty stable at the moment; however, if it falls and closes beneath the $0.20 level, it may continue to head lower and fall beneath $0.17. The trading volume is showing no signs of increase, which is often a sign that a significant move in either direction is imminent.
If the sellers push lower, the first level of support lies at $0.20. Beneath this, further support is found at $0.193 (downside 1.414 Fib Extension), $0.19, and $0.179 (downside 1.618 Fib Extension).
From above, the nearest level of resistance lies at $0.218. This is followed by resistance at $0.22, $0.227, and $0.235.
The RSI has been recently rising; however, it is starting to flatline. If it can continue to climb toward the 50 levels this will show that someone is accumulating. Additionally, the Stochastic RSI is attempting a bullish crossover signal at the oversold territory.
Against Bitcoin, XRP managed to continue higher above the mid-term rising trend line as it climbed to the high of 2700 SAT. It is now confirming the trend line as support as XRP trading around 2670 SAT.
The fact that XRP managed to break back above the trend line now puts XRP/BTC into a neutral trading condition. It would need to drop back beneath 2600 SAT to turn bearish again.
If the bulls continue higher, the first level of resistance lies at 2710 SAT. The next resistance lies at 2750 SAT, 2800 SAT, and 2855 SAT.
From below, the first level of support lies at the trend line. Beneath this, support lies at 2640 SAT, 2600 SAT, and 2550 SAT. If they continue beneath this, additional support is found at 2525 SAT, 2500 SAT, and 2455 SAT.
The RSI has risen back into the 50 level as the selling momentum fades. However, it trades directly at the 50 line, which shows indecision within the market. It could go in either direction with a break below, sending XRP lower or a break above sending XRP higher.