XRP has managed to remain pretty stable against the USD after increasing by 1.76% over the past week to reach the current price of $0.2568. The cryptocurrency had broken beneath a major support level during early-August after falling below the $0.30 level. However, after shattering this support, XRP is holding strong against the USD but is showing major signs of weakness against BTC.
XRP remains the third-largest cryptocurrency with a market cap of $11.06 billion.
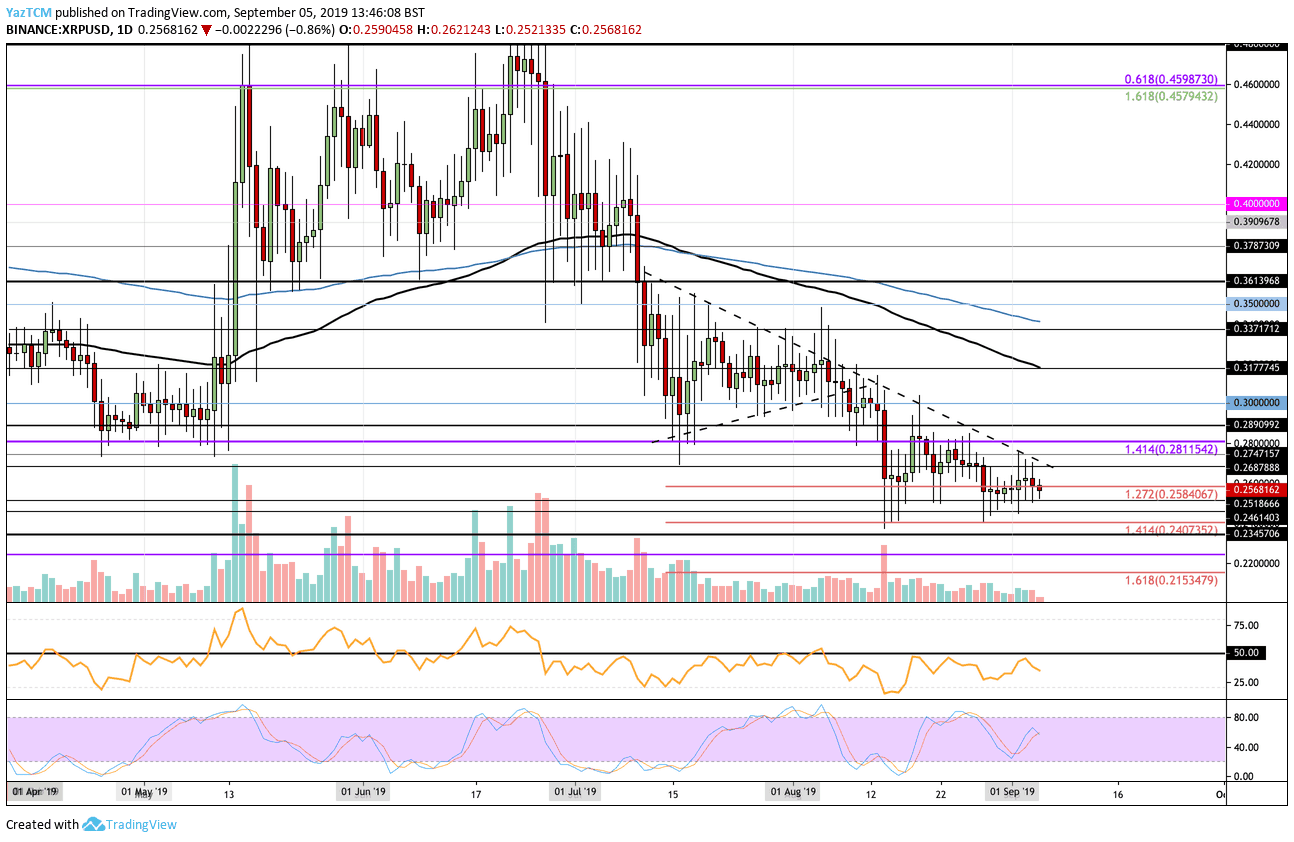
Looking at the XRP/USD 1-Day Chart:
- Since our previous XRP/USD analysis, XRP remained positively stable. Any spike lower is immediately bought up as XRP continues to trade above $0.25. XRP is still suppressed by a falling resistance trend line which will be the first mountain of resistance to overcome for a recovery.
- From above: The nearest level of resistance lies at $0.27 where the falling trend line is located. Higher resistance is found at $0.2811, $28.90, and $0.30. If the bulls break back above $0.30, further resistance is expected around $0.3177 (100-days EMA), $0.32, and $0.34 (200-days EMA).
- From below: The nearest levels of support lie at $0.2519 and $0.25. Beneath this, support is found at $0.2461, $0.24, $0.2345, and $0.23.
- The trading volume remains low but at the average level for the past 2 months.
- The RSI has recently turned away from the 50 level to indicate the bears remain in control over the market momentum.
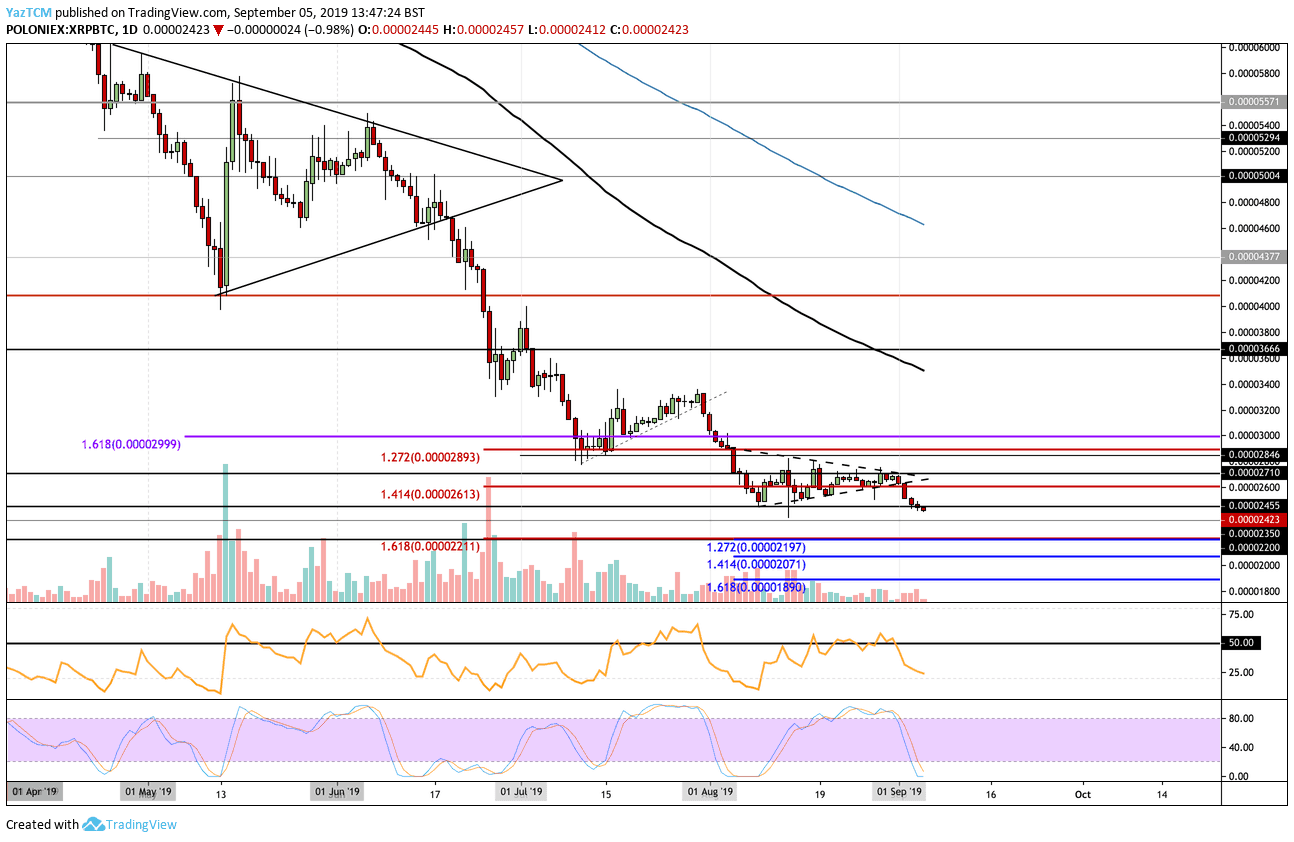
Looking at the XRP/BTC 1-Day Chart:
- Against Bitcoin, XRP has fallen beneath the previous symmetrical triangle. XRP continued to travel beneath the support at 2455 SAT to reach the current level at 2423 SAT.
- From above: If the bulls break back above 2455 SAT, higher resistance is located at 2600 SAT, 2710 SAT, 2900 SAT, and 3000 SAT.
- From below: The nearest level of support beneath 2400 SAT is expected at 2350 SAT. Beneath this, support is found at 2211 SAT, 2197 SAT, 2100 SAT, and 2171 SAT.
- The trading volume remains low and is decreasing.
- The RSI has plummetted beneath the 50 level which shows strong bearish momentum. However, the Stochastic RSI is in extreme oversold conditions and is primed for a bullish crossover signal which could allow XRP/BTC to see a slight rebound.
SPECIAL OFFER (Sponsored)
LIMITED OFFER 2024 for CryptoPotato readers at Bybit: Use this link to register and open a $500 BTC-USDT position on Bybit Exchange for free!
Disclaimer: Information found on CryptoPotato is those of writers quoted. It does not represent the opinions of CryptoPotato on whether to buy, sell, or hold any investments. You are advised to conduct your own research before making any investment decisions. Use provided information at your own risk. See Disclaimer for more information.
Cryptocurrency charts by TradingView.