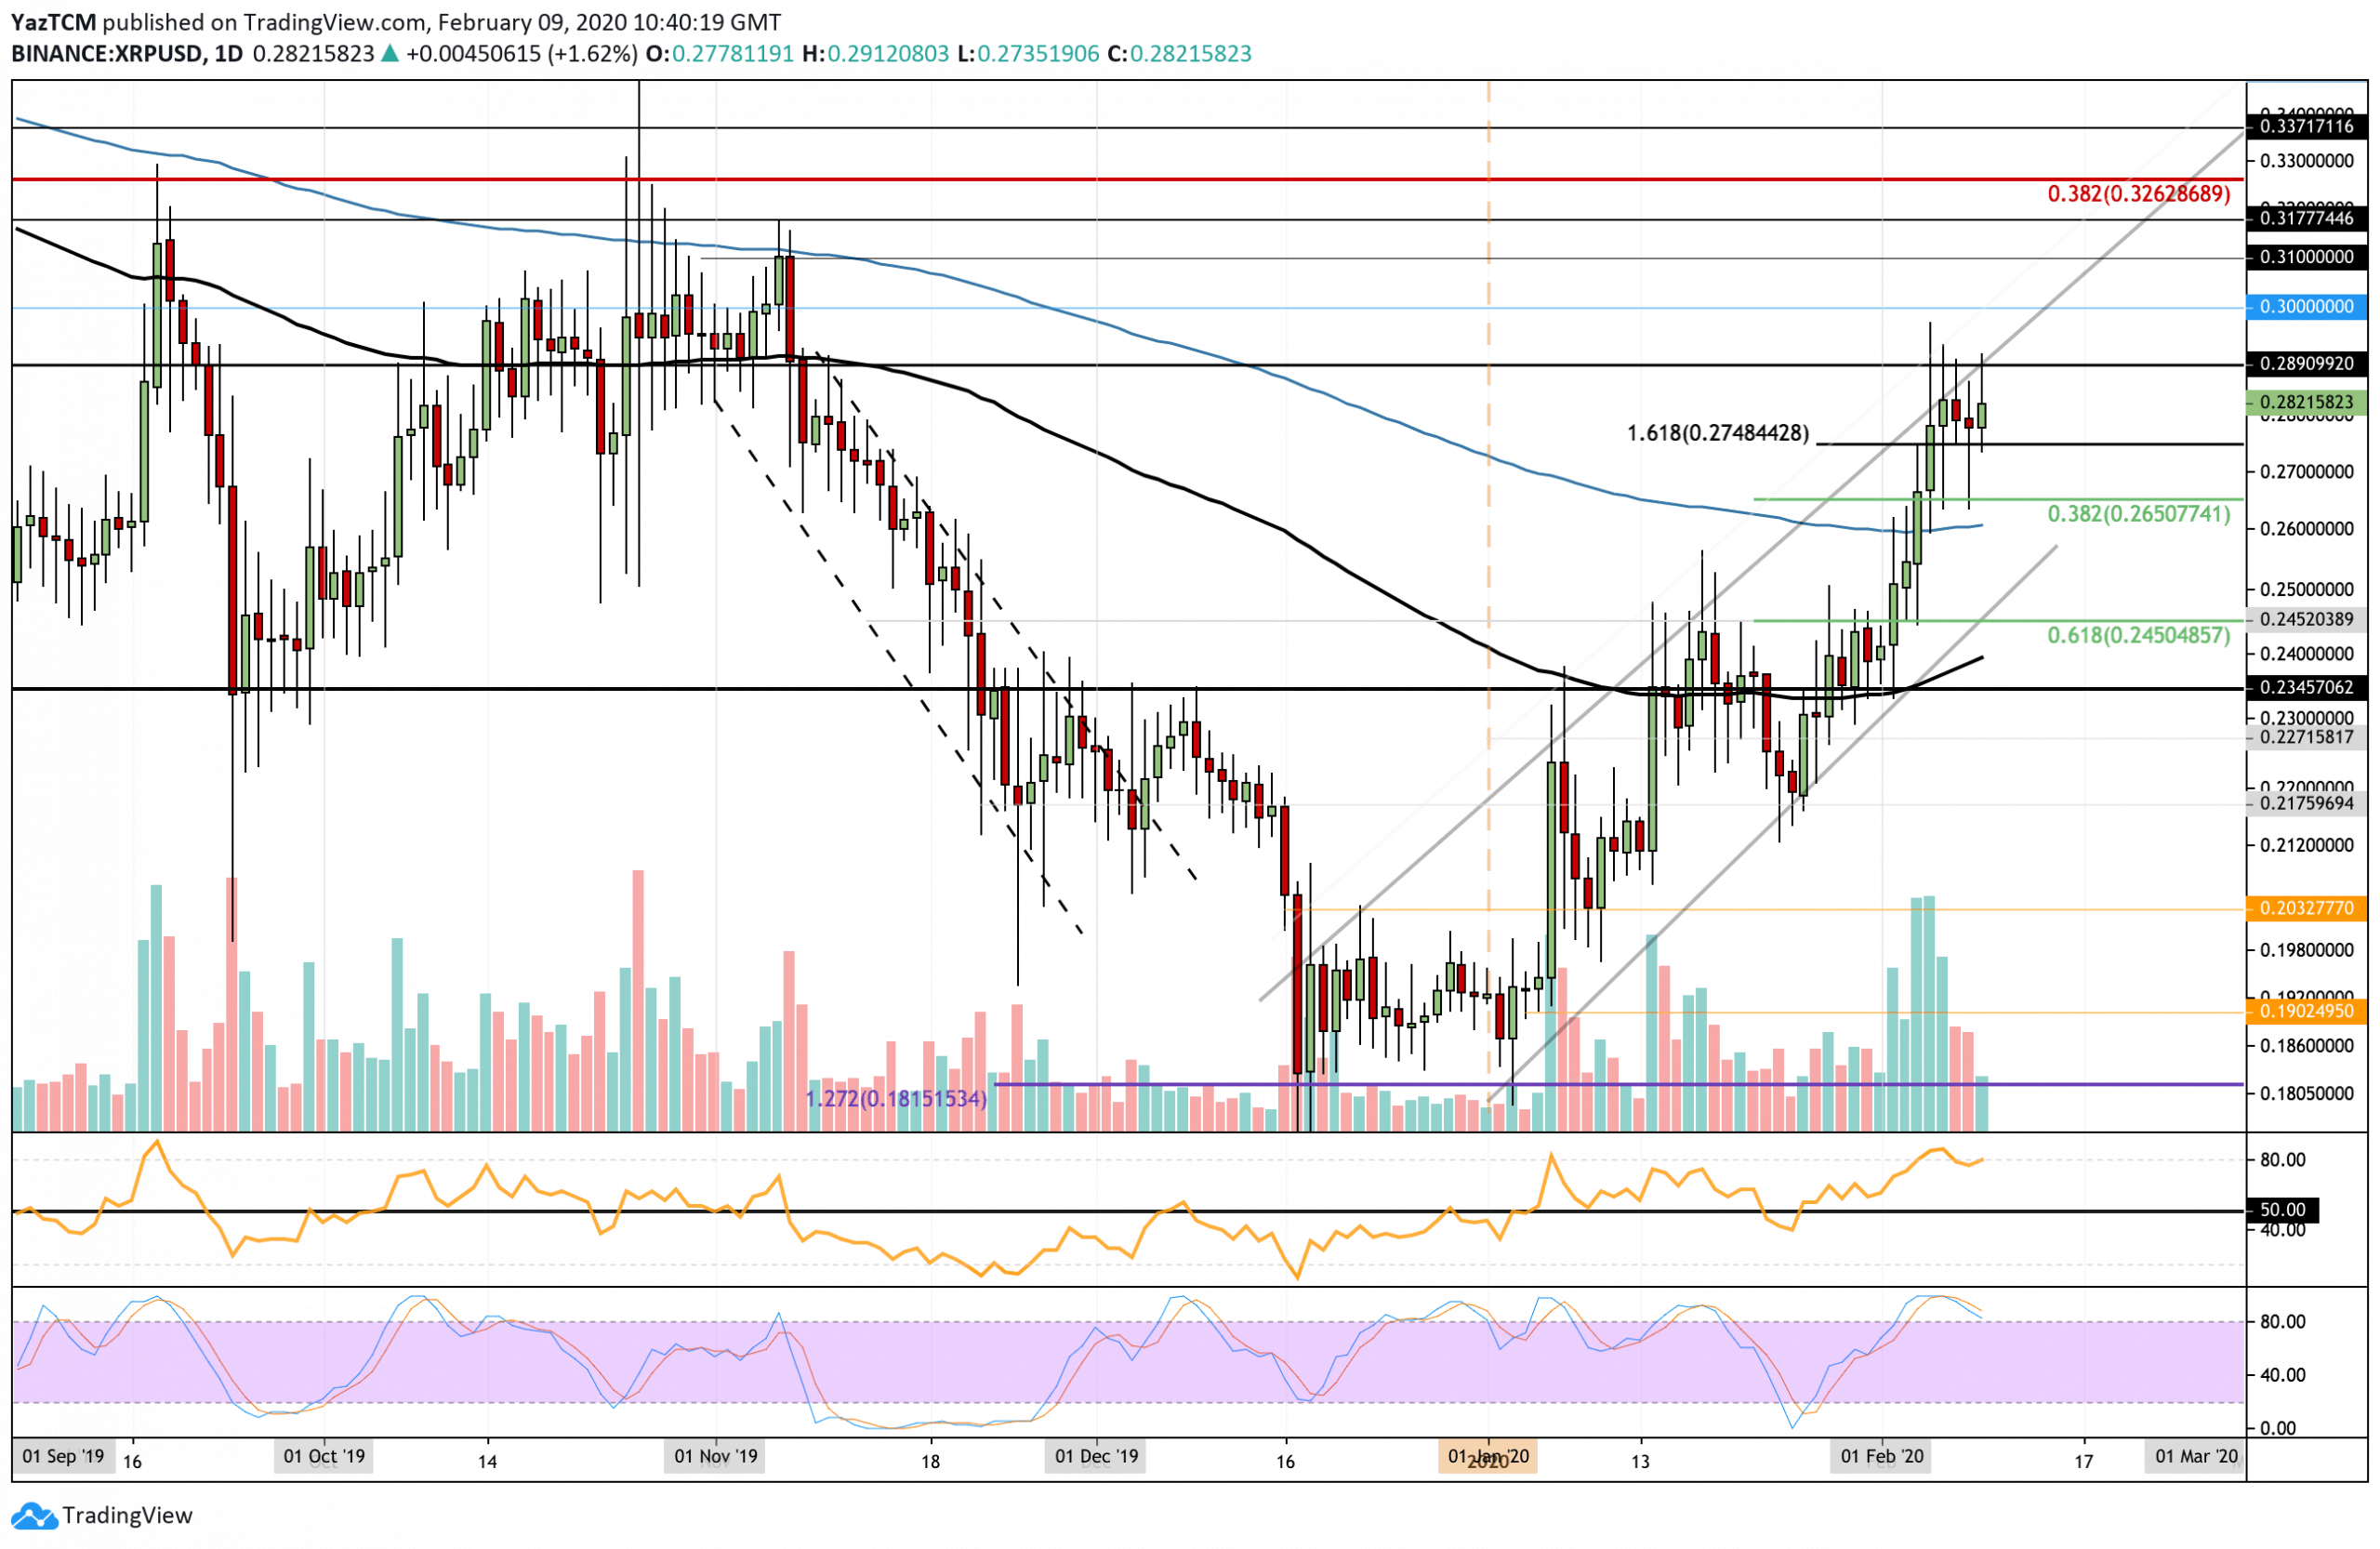
XRP/USD:
Support: $0.265, $0.26, $0.245.
Resistance: $0.289, $0.30, $0.31.
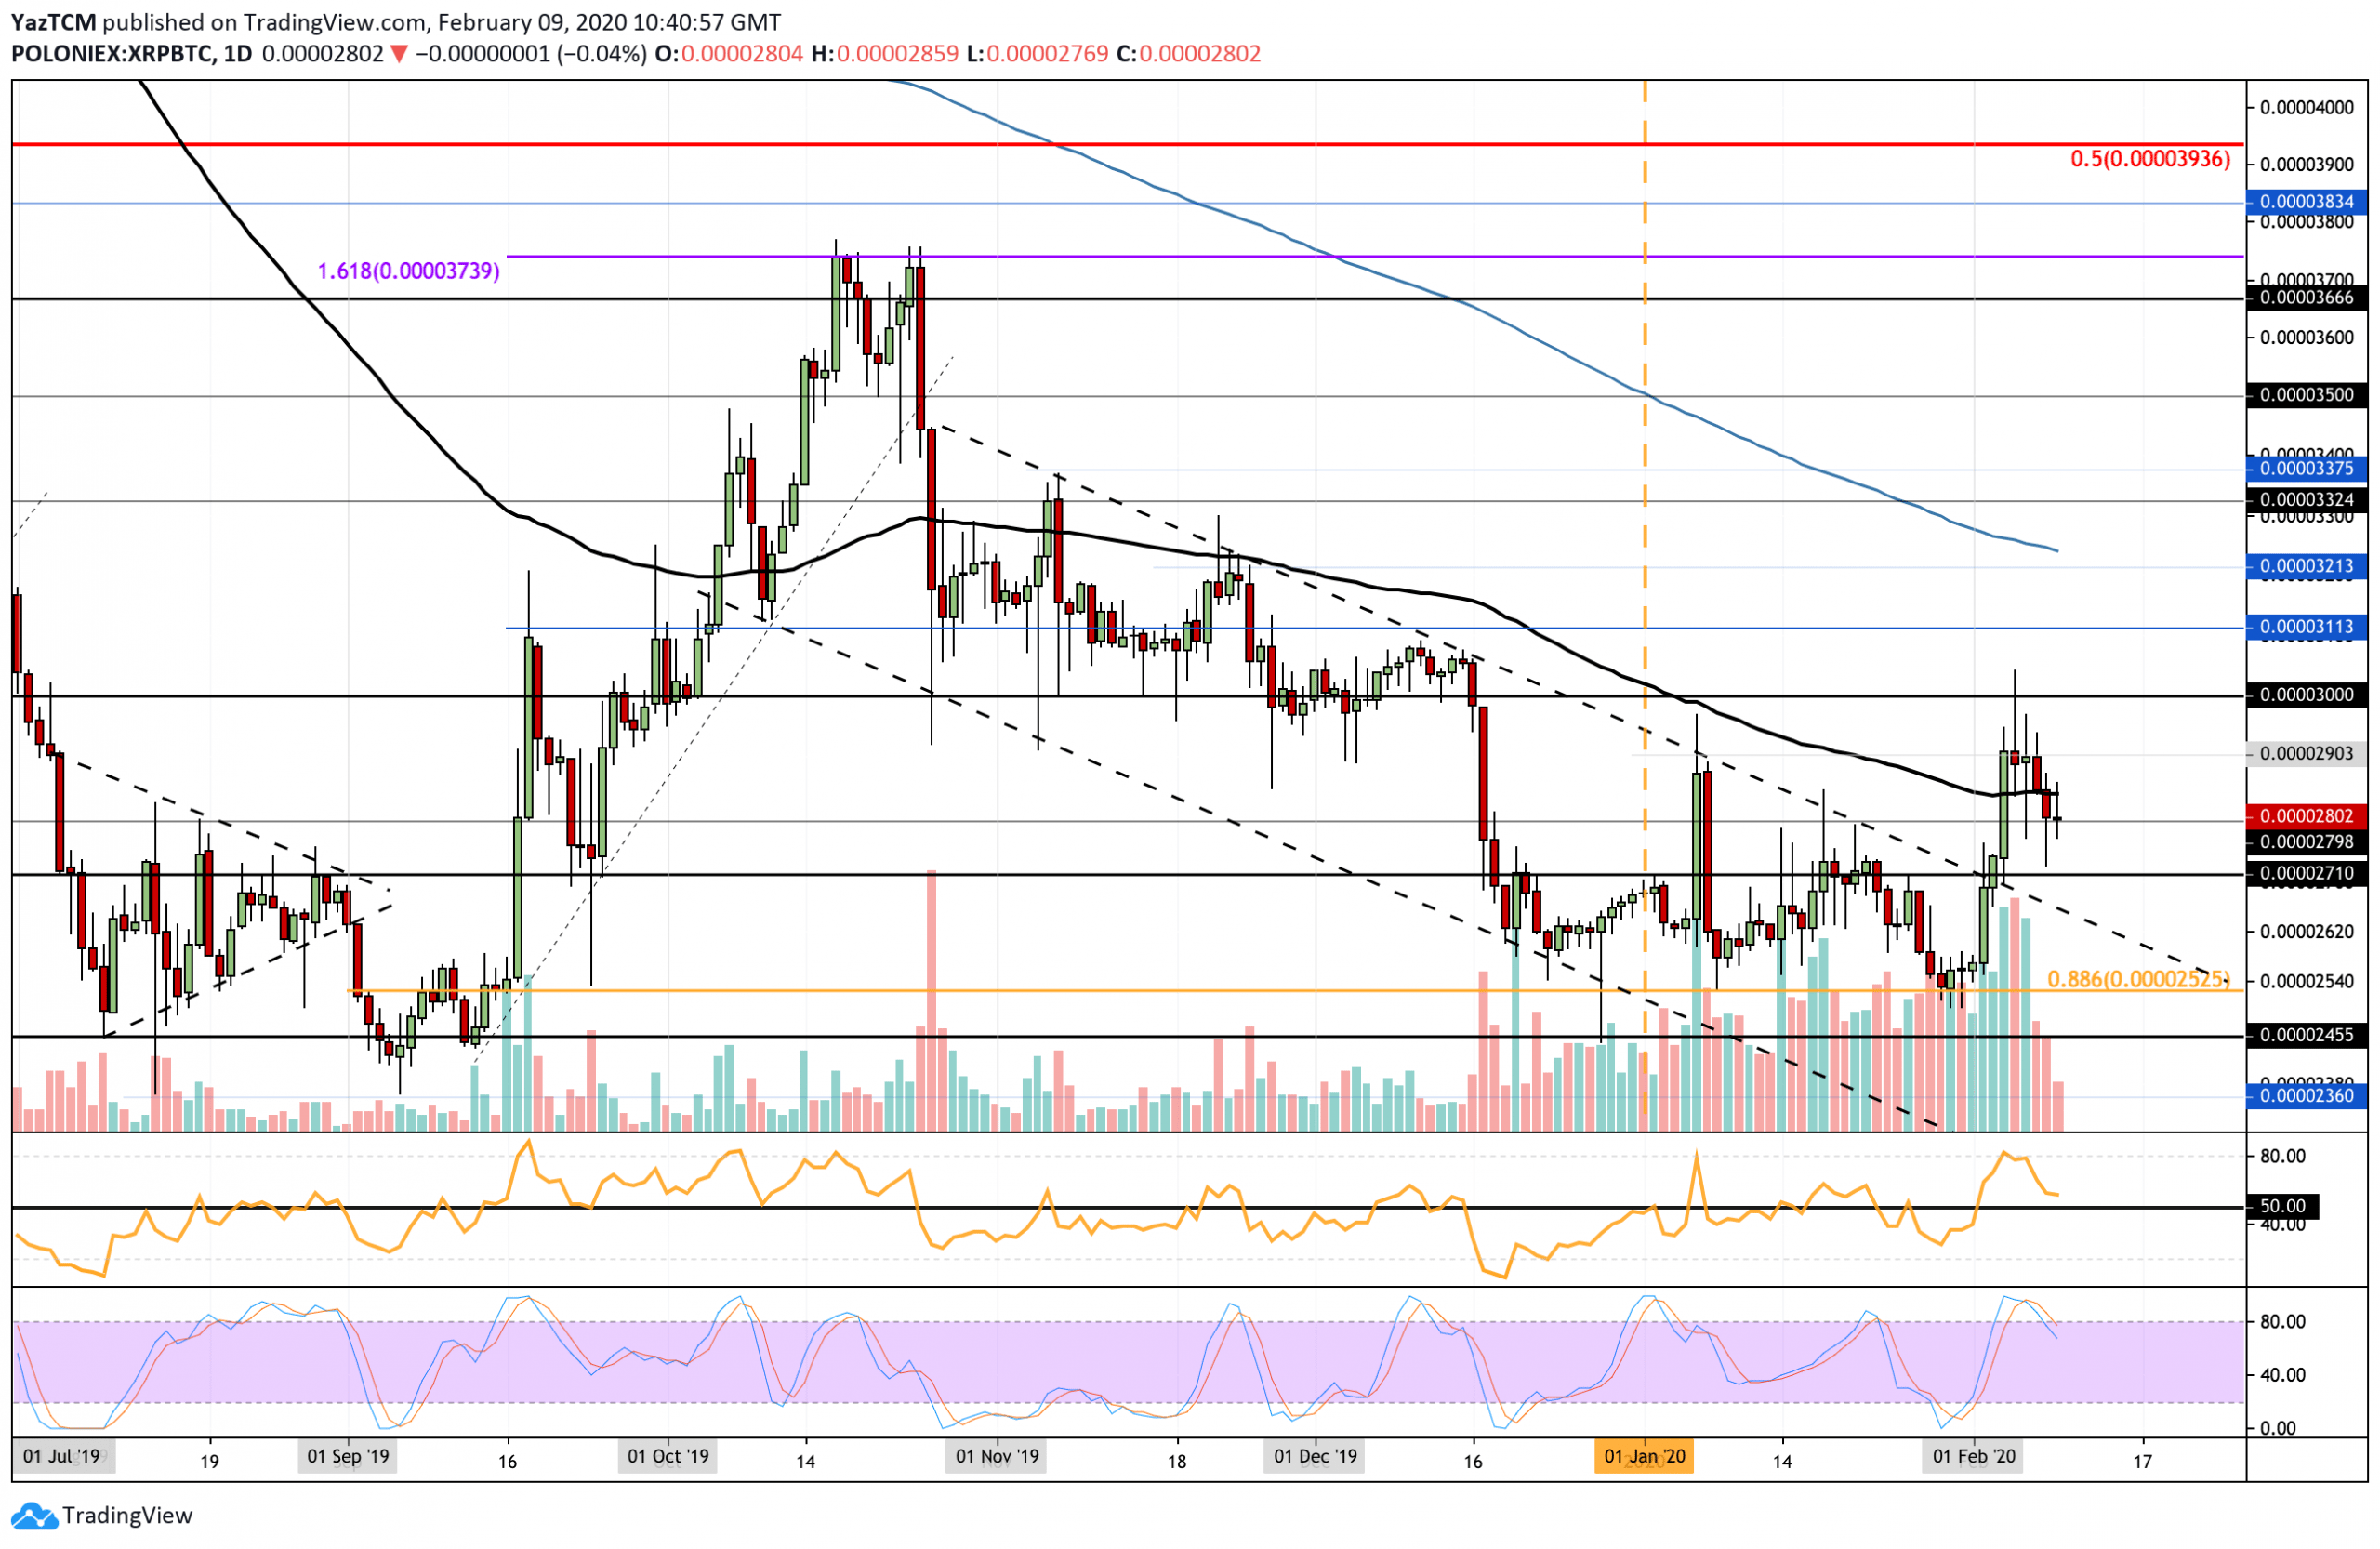
XRP/BTC:
Support: 2710 SAT, 2600 SAT, 2525 SAT.
Resistance: 2850 SAT, 2900 SAT, 3000 SAT.
Since our last analysis, XRP continued to find resistance at the upper boundary of the ascending price channel as well as at $0.289. Nevertheless, XRP continues to remain strongly supported at $0.277 and would need to fall beneath this to head lower.
XRP must break above the resistance at $0.289 to continue this bullish drive higher. However, if it falls beneath $0.26 (200-days EMA), the market would turn neutral, and a drop beneath the lower boundary of the ascending price channel would turn it bearish.
The latest price increase can only be attributed to the fact that Bitcoin managed to climb by a small 3% to finally break back above the $10,000 level in today’s trading session.
If the sellers push beneath $0.275, support then lies at $0.265 and $0.26 (200-days EMA). Beneath this, additional support can be found at $0.245 (.618 Fib retracement) and $0.235.
On the other hand, if the bulls break above $0.289 and the upper boundary of the ascending price channel, the first level of strong resistance lies at $0.30. Above this, higher resistance is located at $0.31 and $0.317.
The RSI recently dropped from overbought conditions as it straddles the 80 level. Additionally, the Stochastic RSI recently produced a bearish crossover signal, which should send the market lower if it follows through and drops further.
Against Bitcoin, XRP rolled over from the 3000 SAT resistance level and started to fall. It dropped beneath support at 2900 SAT and the 100-days EMA to land at the 2800 SAT level.
XRP is still above the opening price for 2020. However, if it continues to drop, we might see it heading to the 2020 low at 2525 SAT.
The failure to break 3000 SAT and the consequential drop beneath the 100-days EMA leads to XRP turning into a neutral trading condition. To become bullish, it better break above the resistance at 3000 SAT.
If the sellers break beneath 2800, SAT support lies at 2710 SAT. Beneath this, additional support lies at 2600 SAT and 2525 SAT (2020 lows). A drop beneath this would turn XRP extremely bearish against Bitcoin.
On the other hand, if the bulls can rebound at 2710 SAT, resistance will lie at 2800 SAT, 2850 SAT (100-days EMA), and 2900 SAT. The 3000 SAT region will provide additional strong resistance moving forward from here.
The RSI has dopped lower from overbought conditions as it approaches the 50 level. This signals that the previous bullish momentum is quickly fading, and if it drops beneath 50, the bears will take control. The Stochastic RSI confirms the fading bullish pressure after a bearish crossover signal was witnessed after XRP failed to break 3000 SAT.