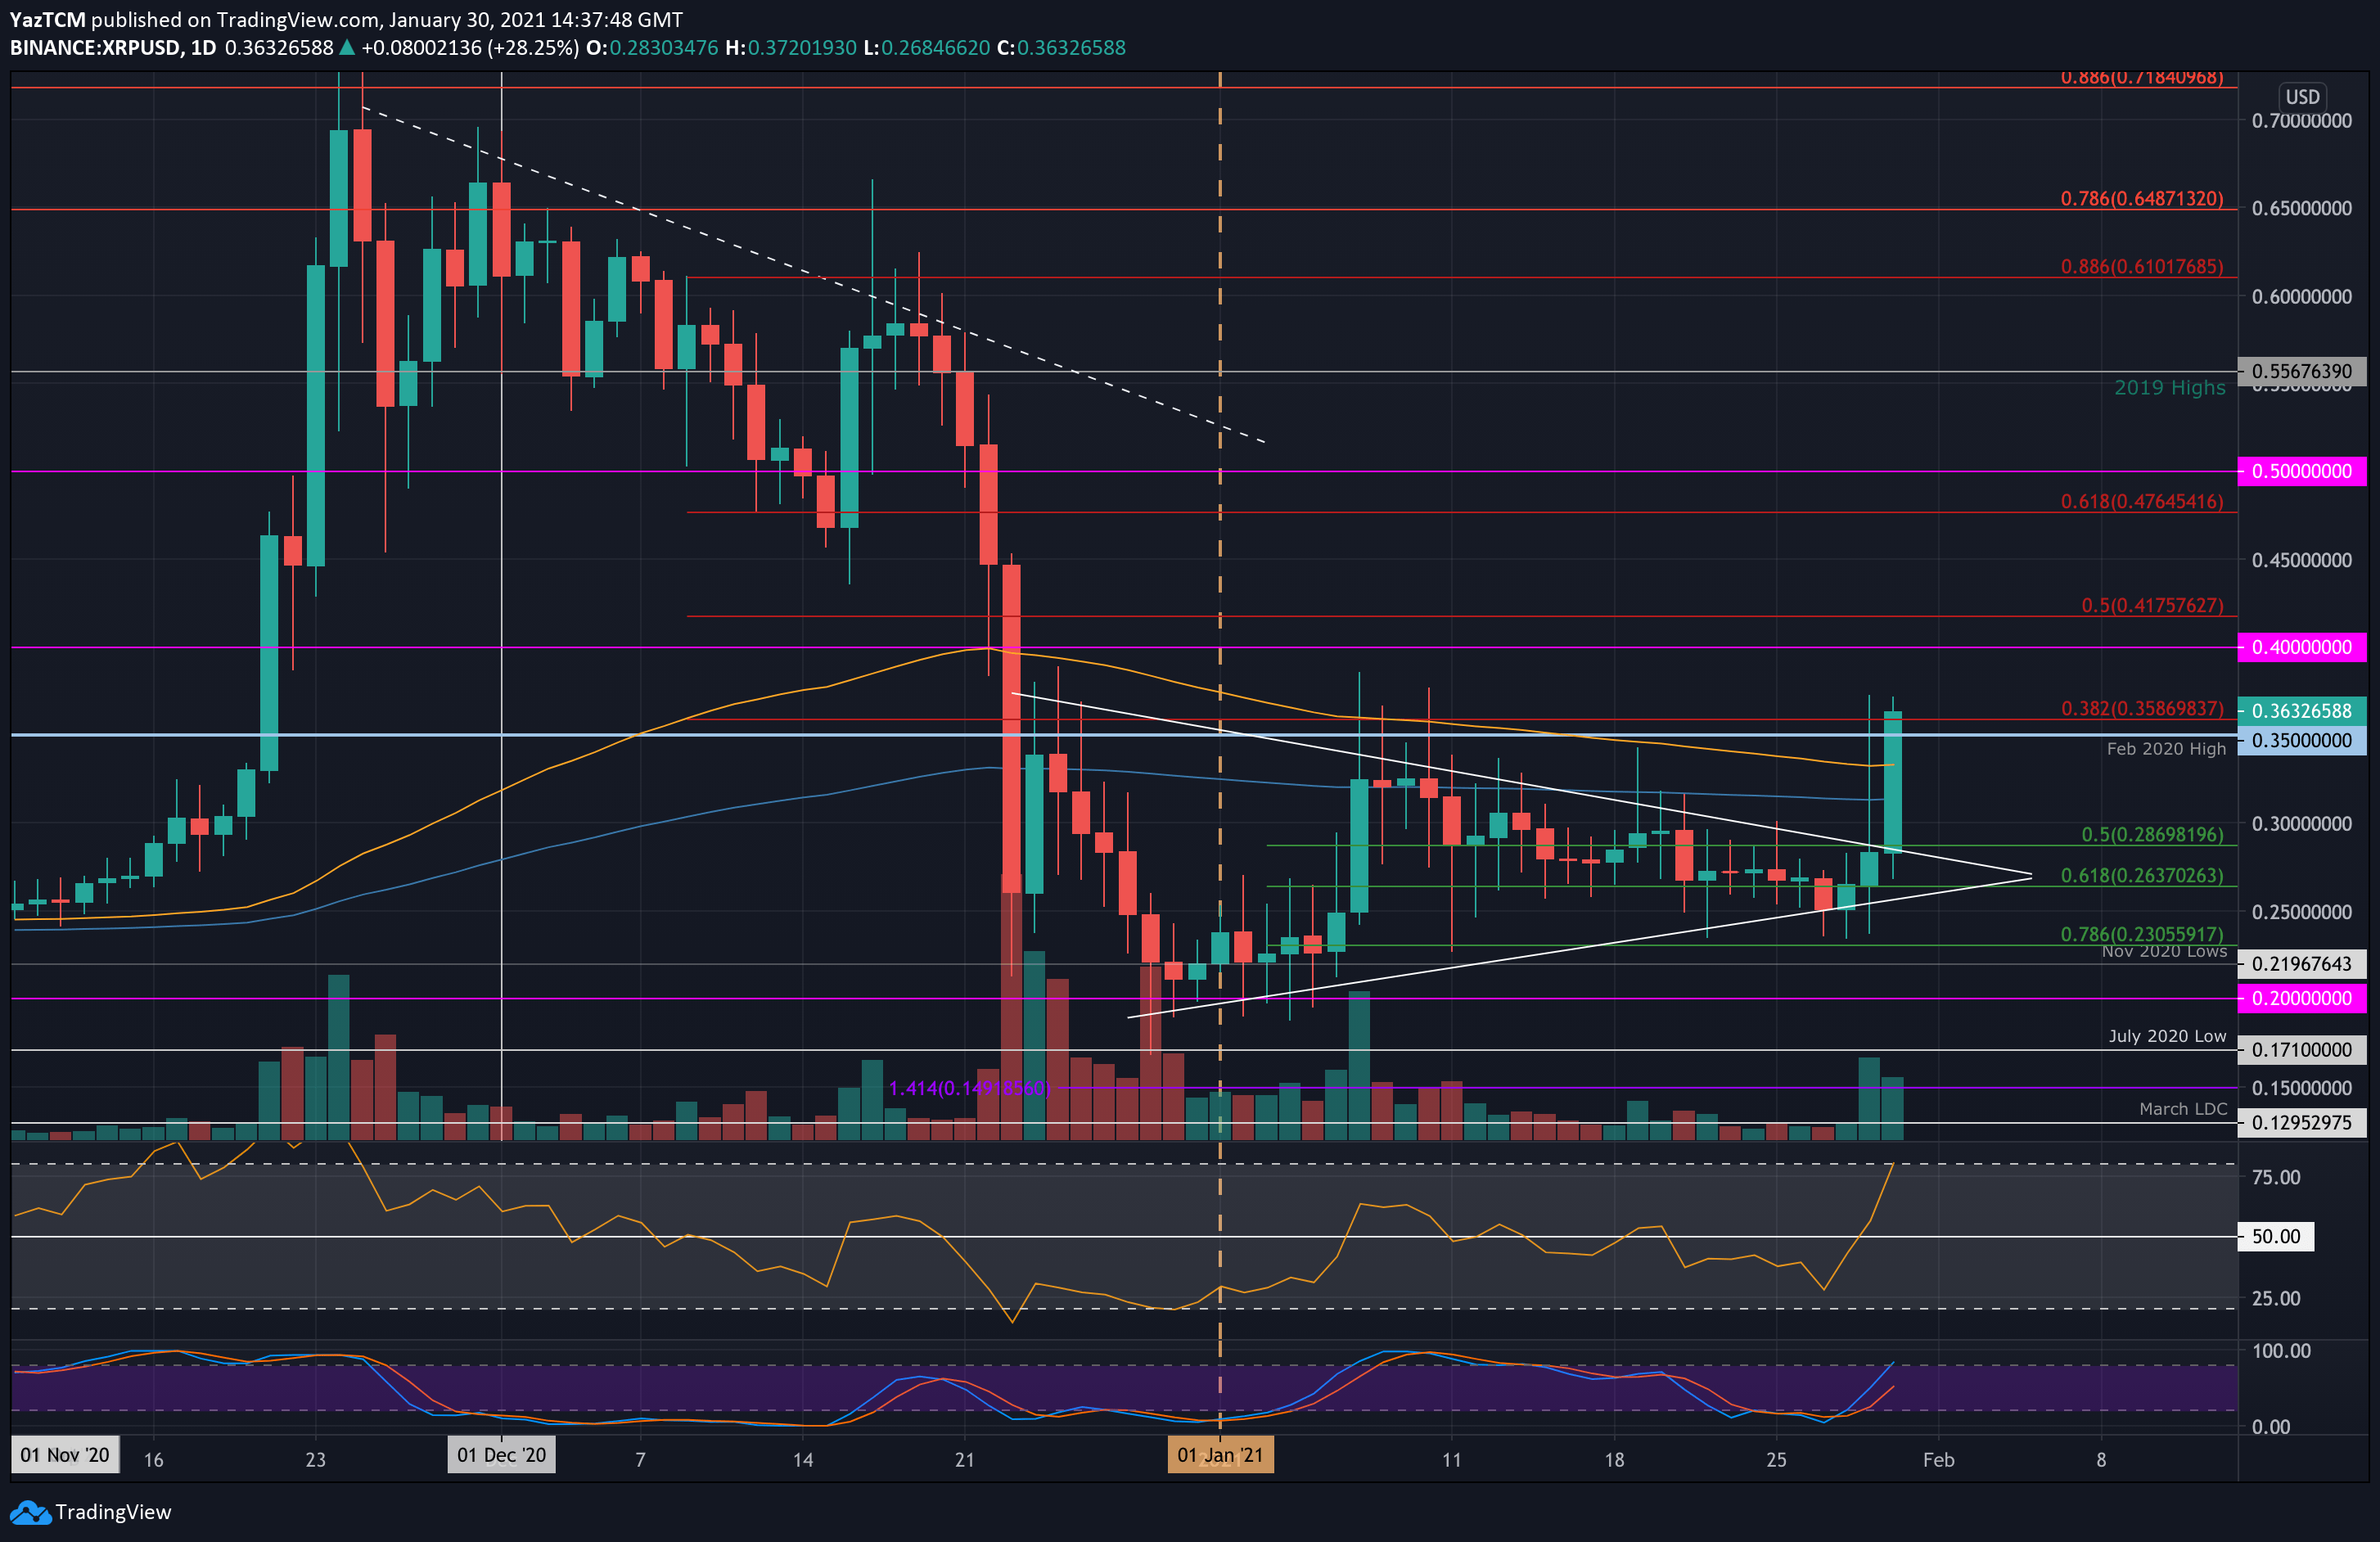
XRP/USD Daily Chart. Source: TradingView.
Key Support Levels: $0.35, $0.34, $0.32.
Key Resistance Levels: $0.4, $0.417, $0.45.
XRP has been trapped in a symmetrical triangle pattern for the entire period of January 2021. The cryptocurrency was holding support at $0.263 (.618 Fib) for the past three weeks but slipped into the lower boundary of the triangle, around $0.25, on Wednesday.
From there, it rebounded higher and spiked above the triangle yesterday. However, by the daily candle close, XRP had returned into the consolidation pattern.
Today, the 22% price surge helped XRP break back above the triangle and head above $0.35. We will need to wait for today’s candle close to confirm a breakout of the triangle, but it looks very promising considering the significant boost in volume over the previous two days.
Looking ahead, the first level of resistance lies $0.4. This is followed by $0.417 (bearish .5 Fib), $0.45, $0.476 (bearish .618 Fib), and $0.5. Beyond $0.5, the 2019 High of $0.556 will provide resistance.
On the other side, the first support lies at $0.35. This is followed by $0.34 (100-days EMA), $0.32 (200-days EMA), $0.3, $0.286 (.5 Fib), and $0.263 (.618 Fib).
The daily RSI has shot above the midline and has pushed to the highest level of bullish momentum since November 2020.
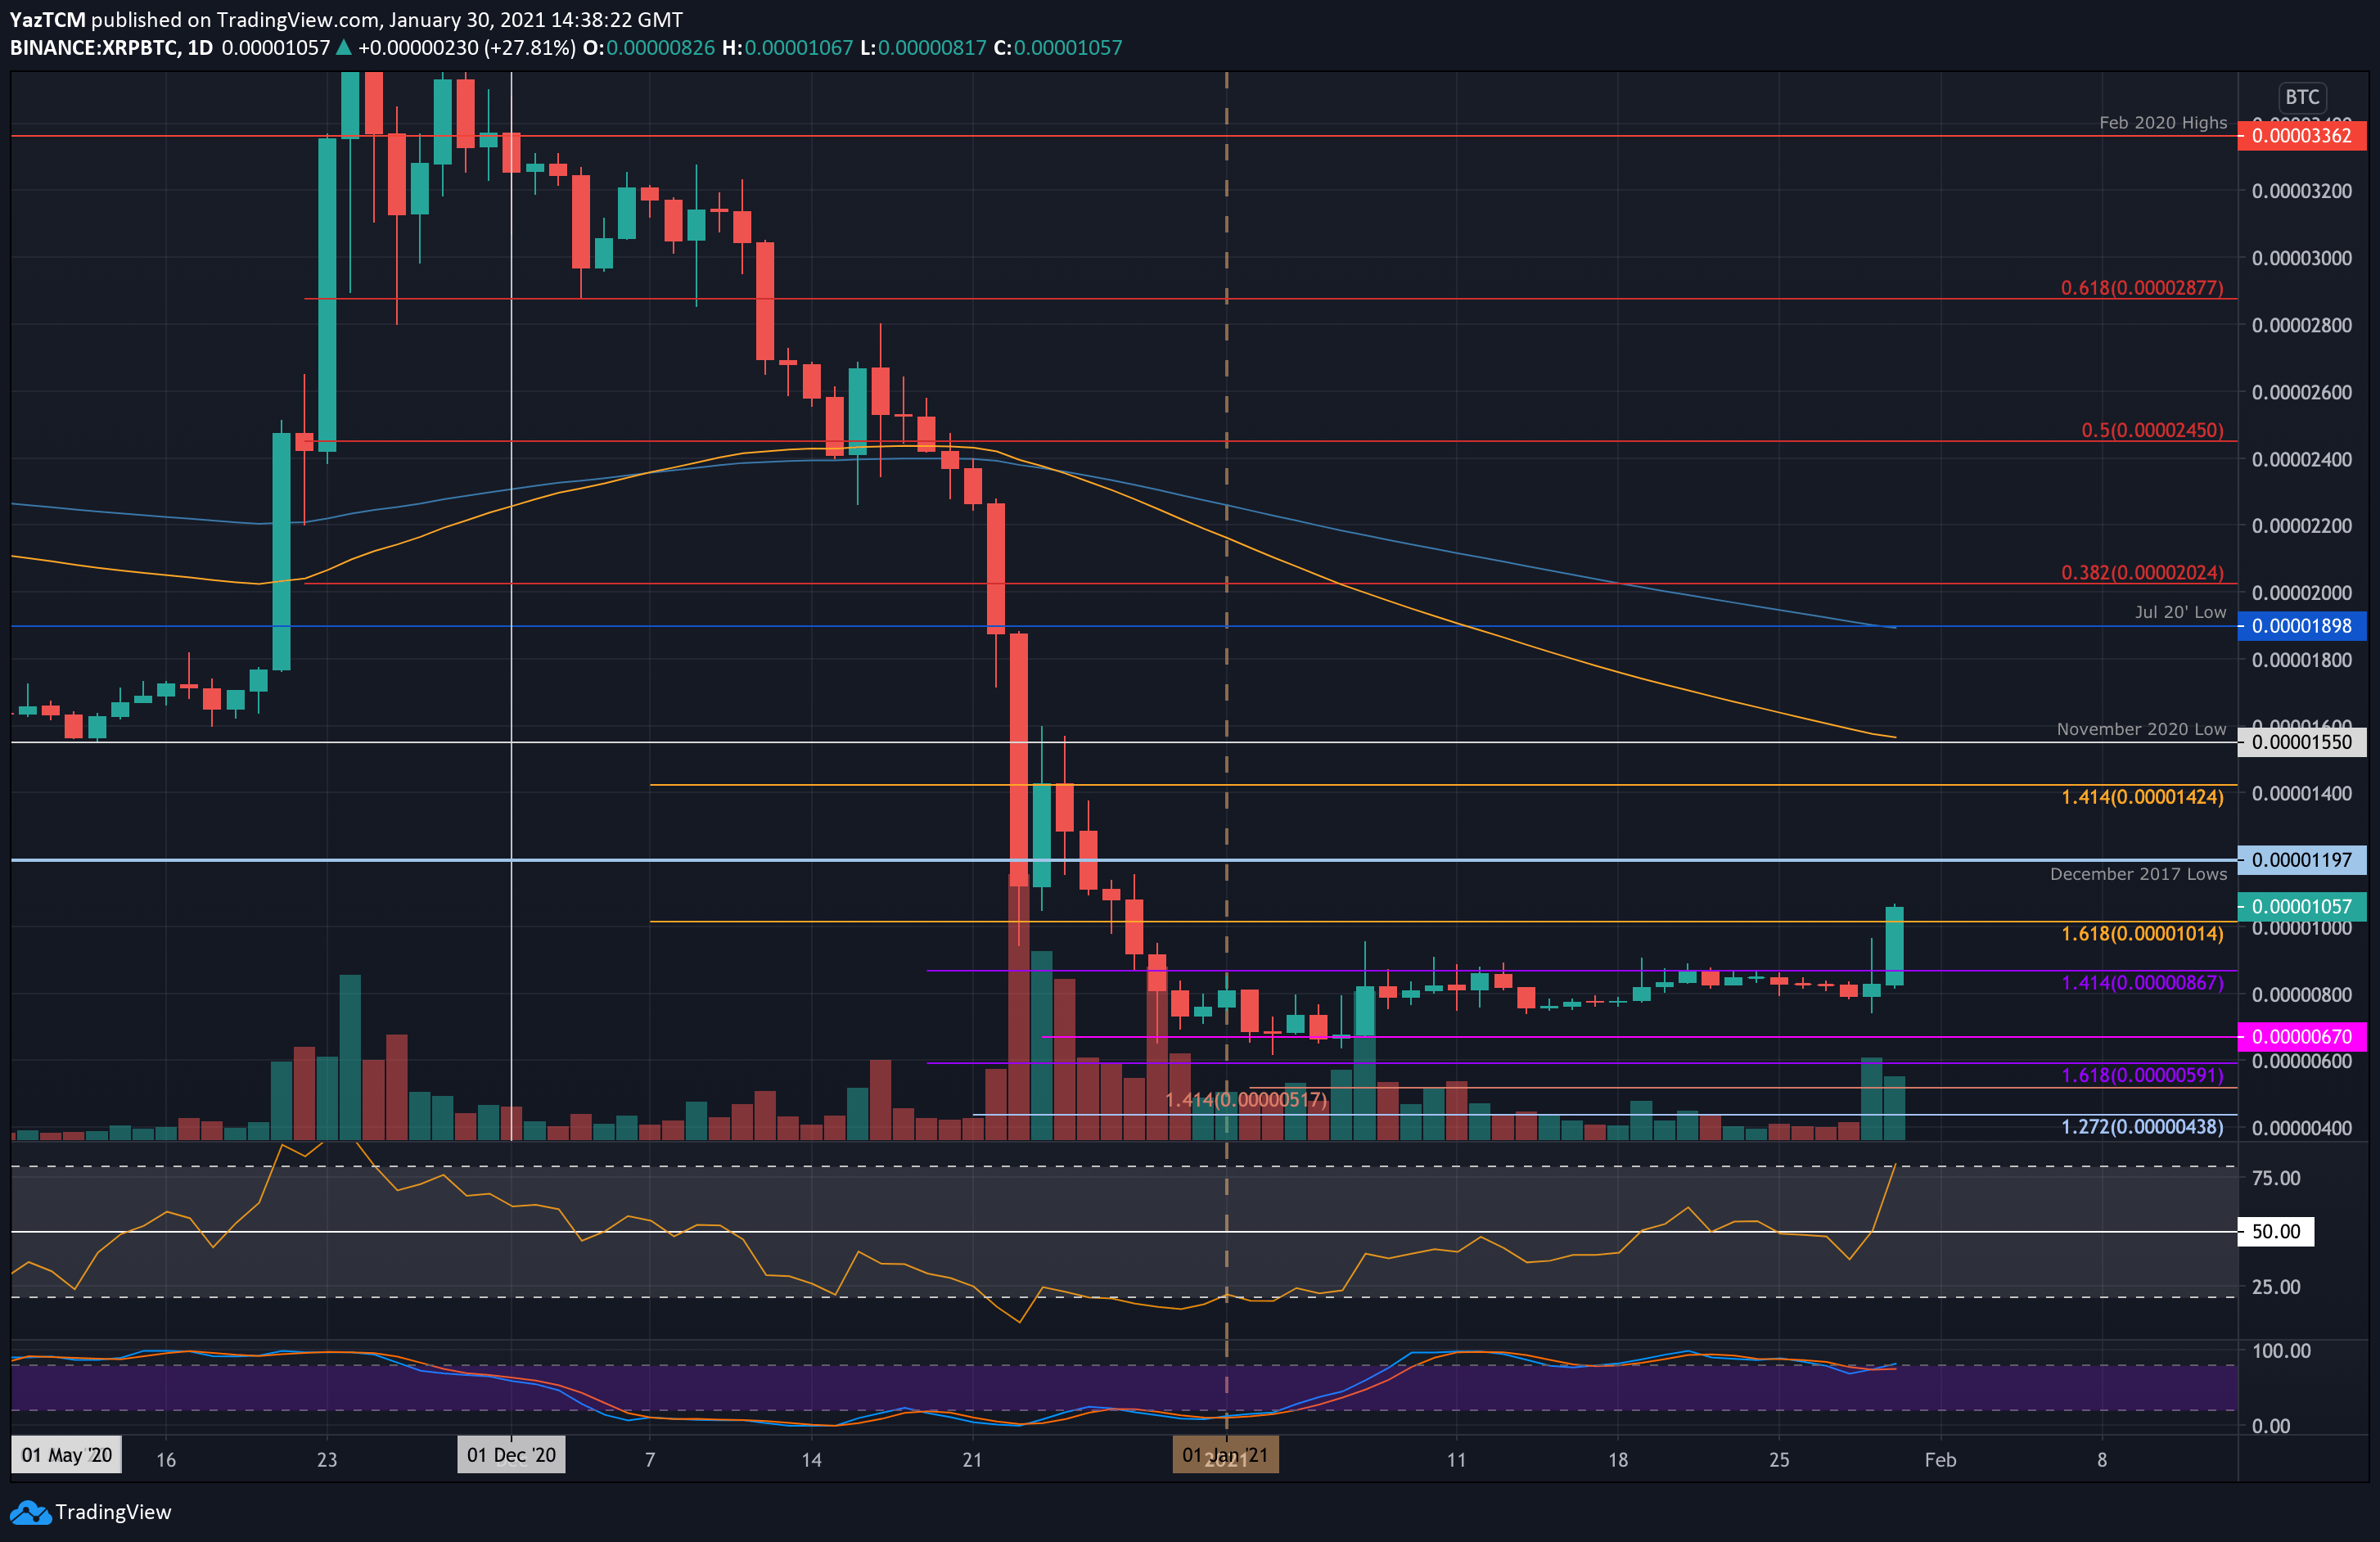
Key Support Levels: 1000 SAT, 867 SAT, 800 SAT.
Key Resistance Levels: 1200 SAT, 1425 SAT, 1500 SAT.
Against Bitcoin, XRP had been trapped within a range between 867 SAT and 760 SAT for the entire period of January 2021. Yesterday, XRP attempted to breakout above the range as it spiked higher but eventually closed within the range as the daily candle closed.
Today, XRP has surged higher and broke the upper boundary of the range to reach the highest price in January 2021 as it breaks the 1000 SAT level.
Moving forward, the first level of resistance lies at 1200 SAT (Dec 2017 lows). This is followed by 1425 SAT, 1500 SAT (Nov 202 low & 100-days EMA), 1800 SAT, and 1900 SAT (July 20 low & 200-day EMA).
On the other side, the first support lies at 1000 SAT. This is followed by 867 SAT (upper boundary of previous range), 800 SAT, and 670 SAT.
The daily RSI is also printing the highest bullish momentum seen since November 2020.
Ripple Price Analysis; XRP Finally Breaks Consolidation As Bull Momentum Hits Highest Level Since November 2020.