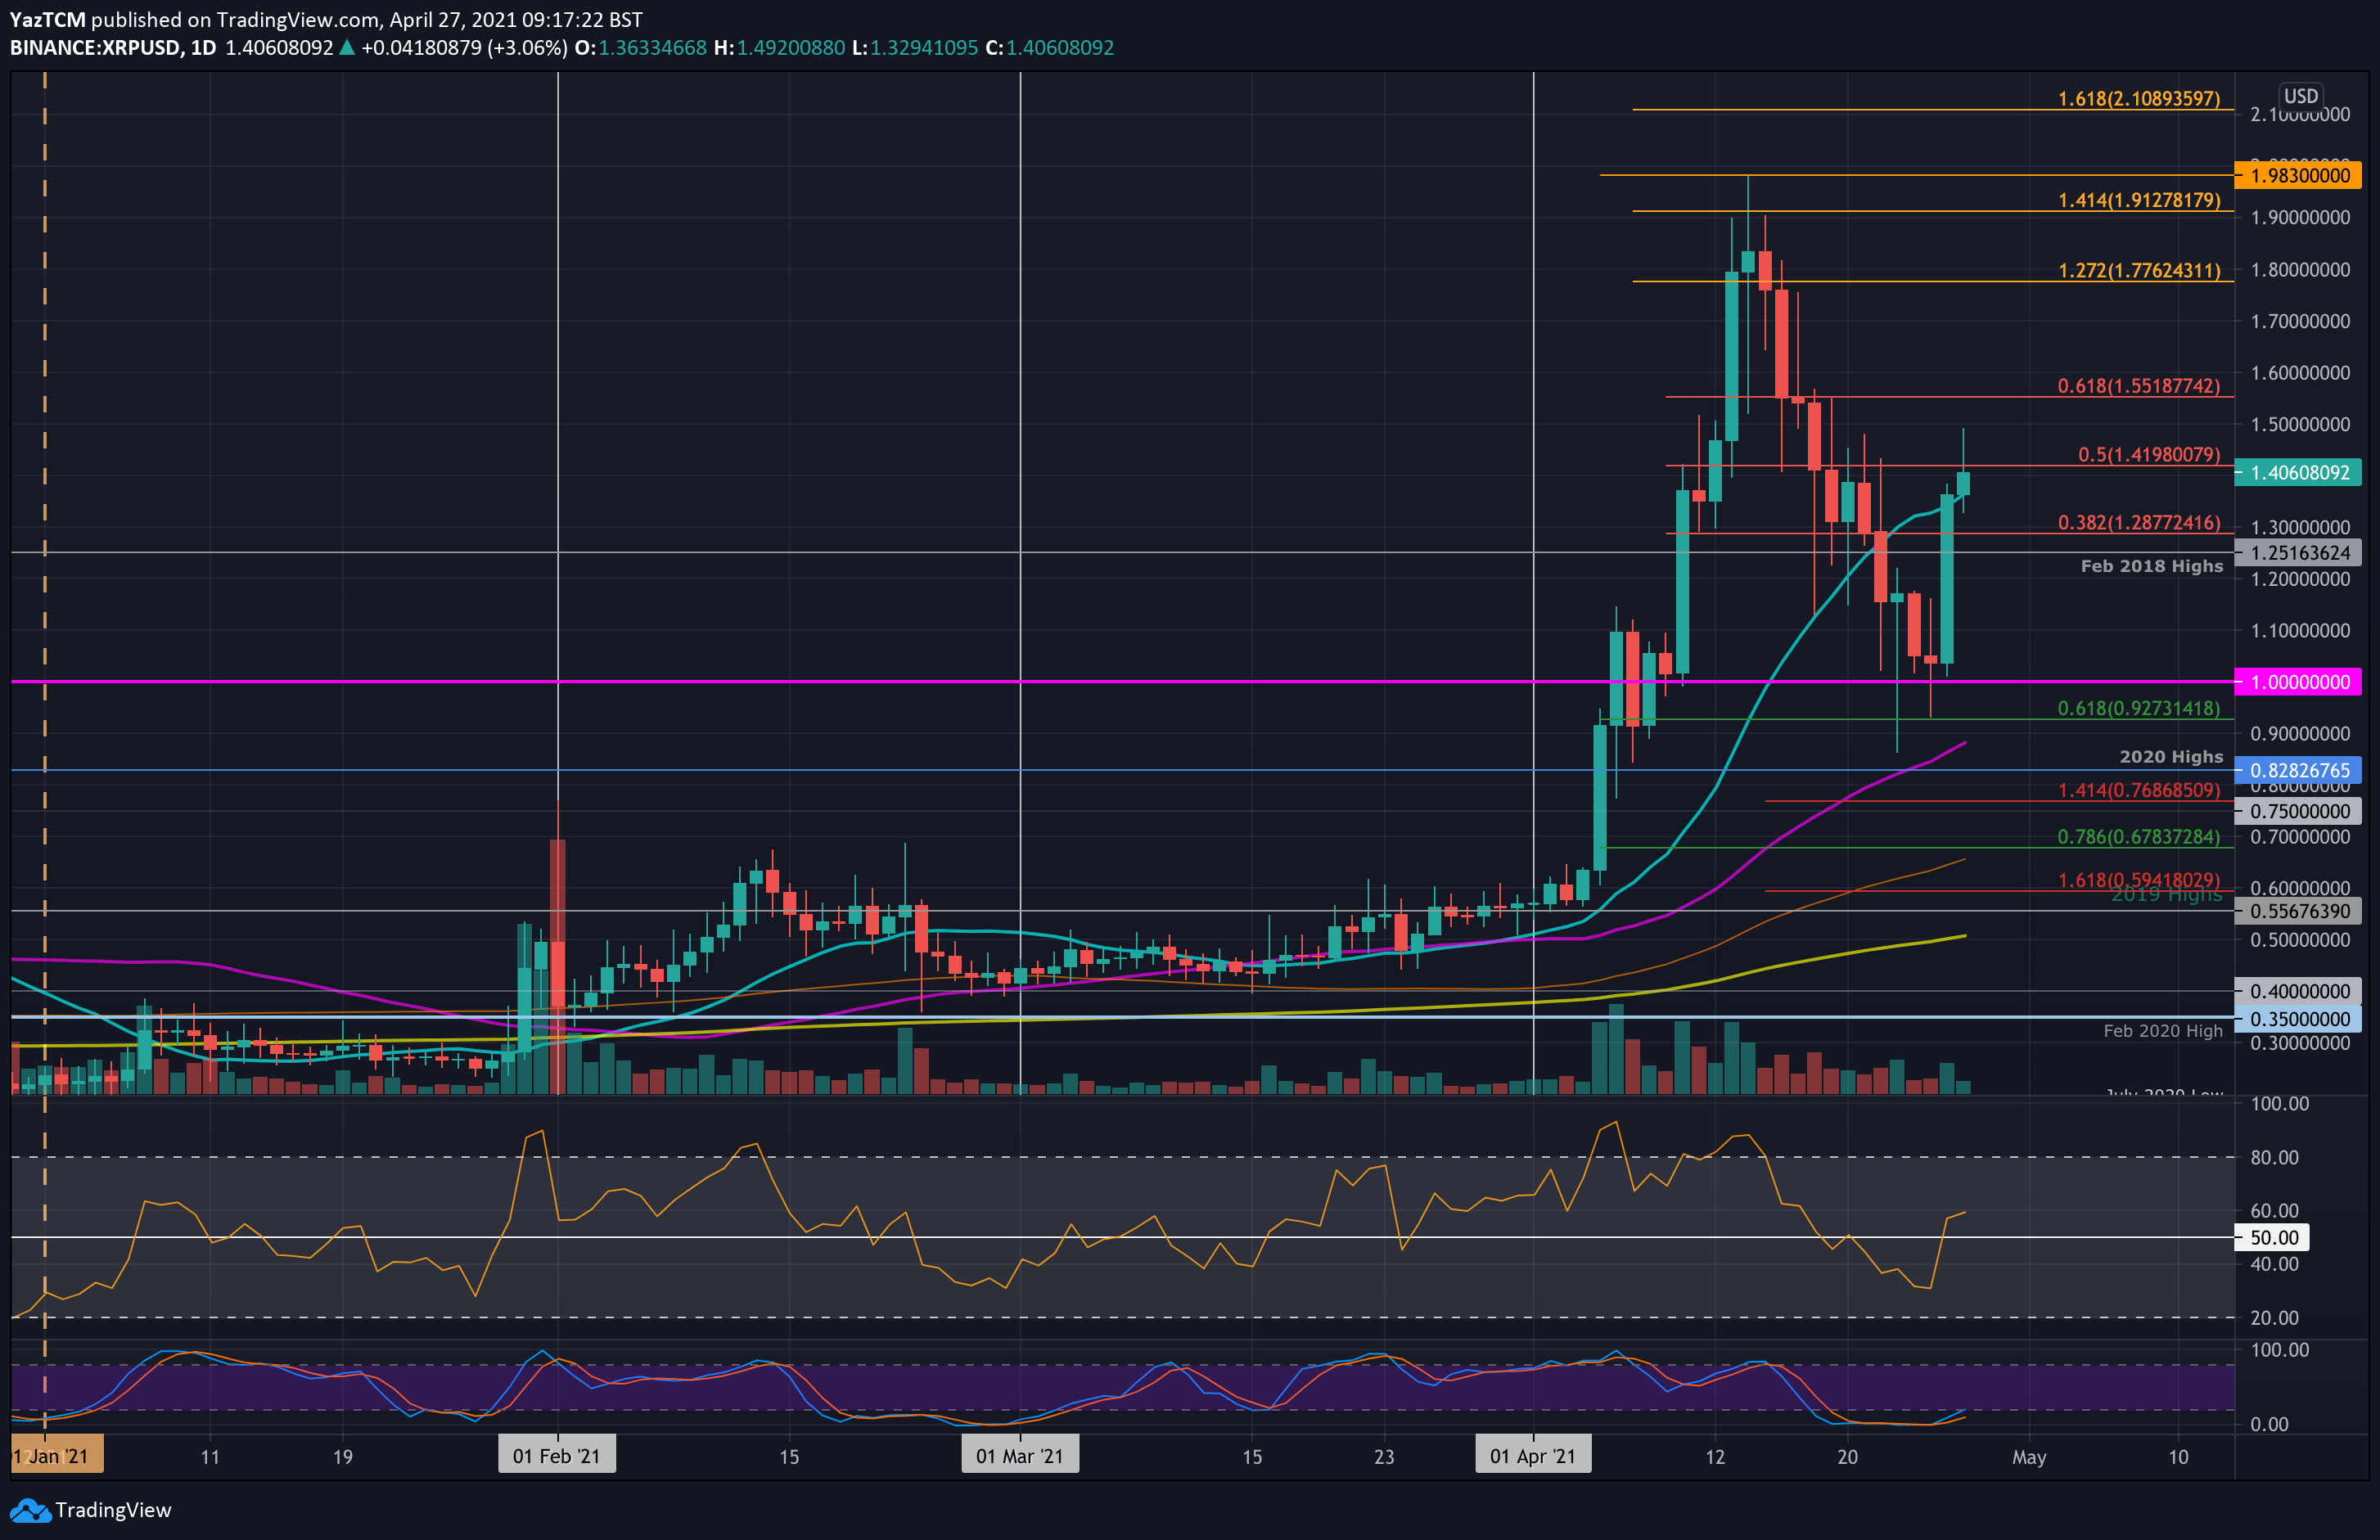
XRP/USD Daily Chart. Source: TradingView
Key Support Levels: $1.36, $1.25, $1.10.
Key Resistance Levels: $1.42, $1.50, $1.55.
Similar to the overall cryptocurrency market, XRP had seen a fortnight of price declines since setting a new 2021 high at $1.98. It was in the middle of a freefall over the past two weeks until support was found at $0.927 (.618 Fib Retracement) on Sunday, which allowed the coin to rebound.
More specifically, XRP managed to close the daily candle above the $1.00 level, maintaining the support there. Since rebounding, it has surged to reach the 20-days MA at $1.35 yesterday. Today, it continued higher to reach near $1.50. The coin has since dropped slightly as it now battles resistance at $1.42, provided by a bearish .5 Fib Retracement.
Looking ahead, if the bulls break $1.42, resistance lies at $1.50, $1.55 (bearish .786 Fib), $1.70, and $1.77 (1.272 Fib Extension).
On the other side, the first support lies at $1.36 (20-days MA). This is followed by $1.25 (Feb 2018 highs), $1.10, and $1.00.
The RSI has pushed back above the midline, indicating the buyers are in control of the market momentum. Additionally, the Stochastic RSI is primed for a bullish crossover signal that should send the market higher.
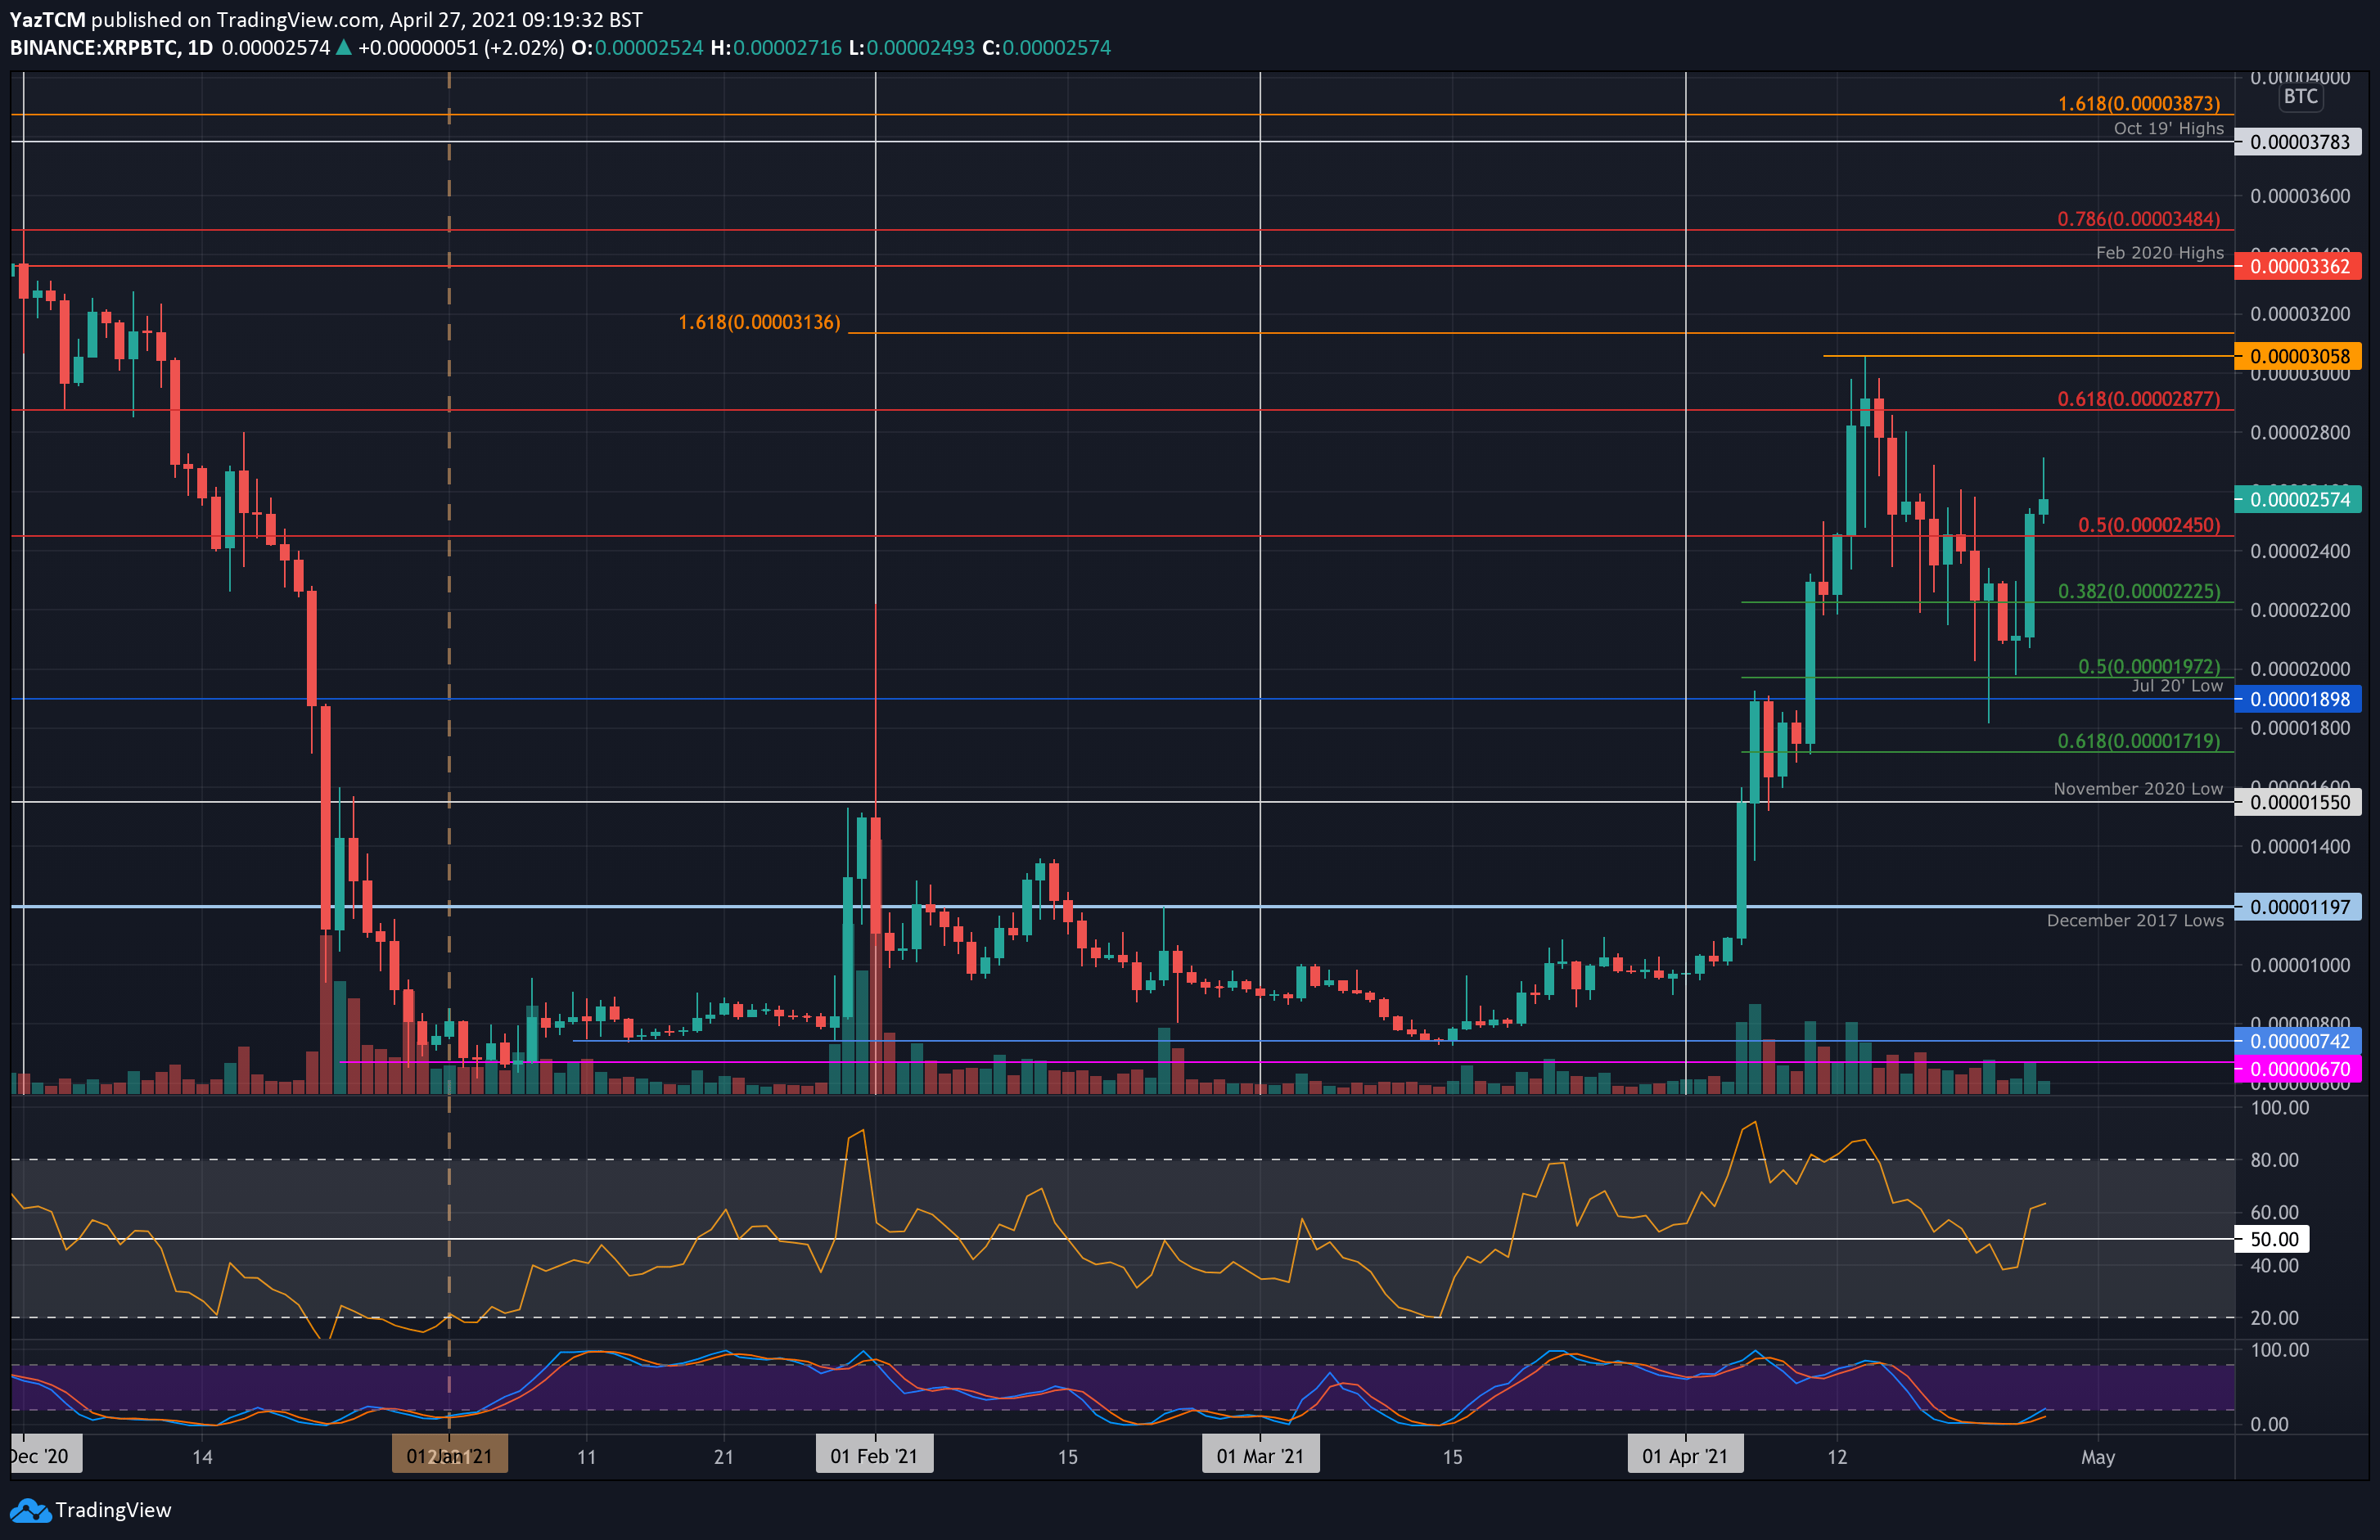
Key Support Levels: 2450 SAT, 2225 SAT, 2000 SAT.
Key Resistance Levels: 2800 SAT, 2877 SAT, 3058 SAT.
XRP was also falling against bitcoin over the past two weeks. The cryptocurrency had dropped into the support at 1972 SAT (.5 Fib) on Sunday and rebounded from there. More specifically, XRP managed to close the daily candle above 2000 SAT as it maintained this support.
Since then, XRP managed to break above resistance 2450 SAT (bearish .5 Fib) yesterday and reached as high as 2715 SAT today. It has since dropped slightly as it now trades around 2575 SAT.
Looking ahead, the first resistance lies at 2800 SAT. This is followed by 2877 SAT (bearish .618 Fib), 3058 SAT (April highs), and 3362 SAT (Feb 2020 Highs).
On the other side, the first support lies at 2450 SAT. This is followed by 2225 SAT (.382 Fib), 2000 SAT (.5 Fib), and 1900 SAT (July 2020 Lows).
The RSI has also pushed back above the midline here, indicating the buyers are attempting to take control of the market momentum. Similarly, the Stochastic RSI is also primed for a bullish crossover signal that should add further buying pressure to push XRP higher.