XRP/USD:
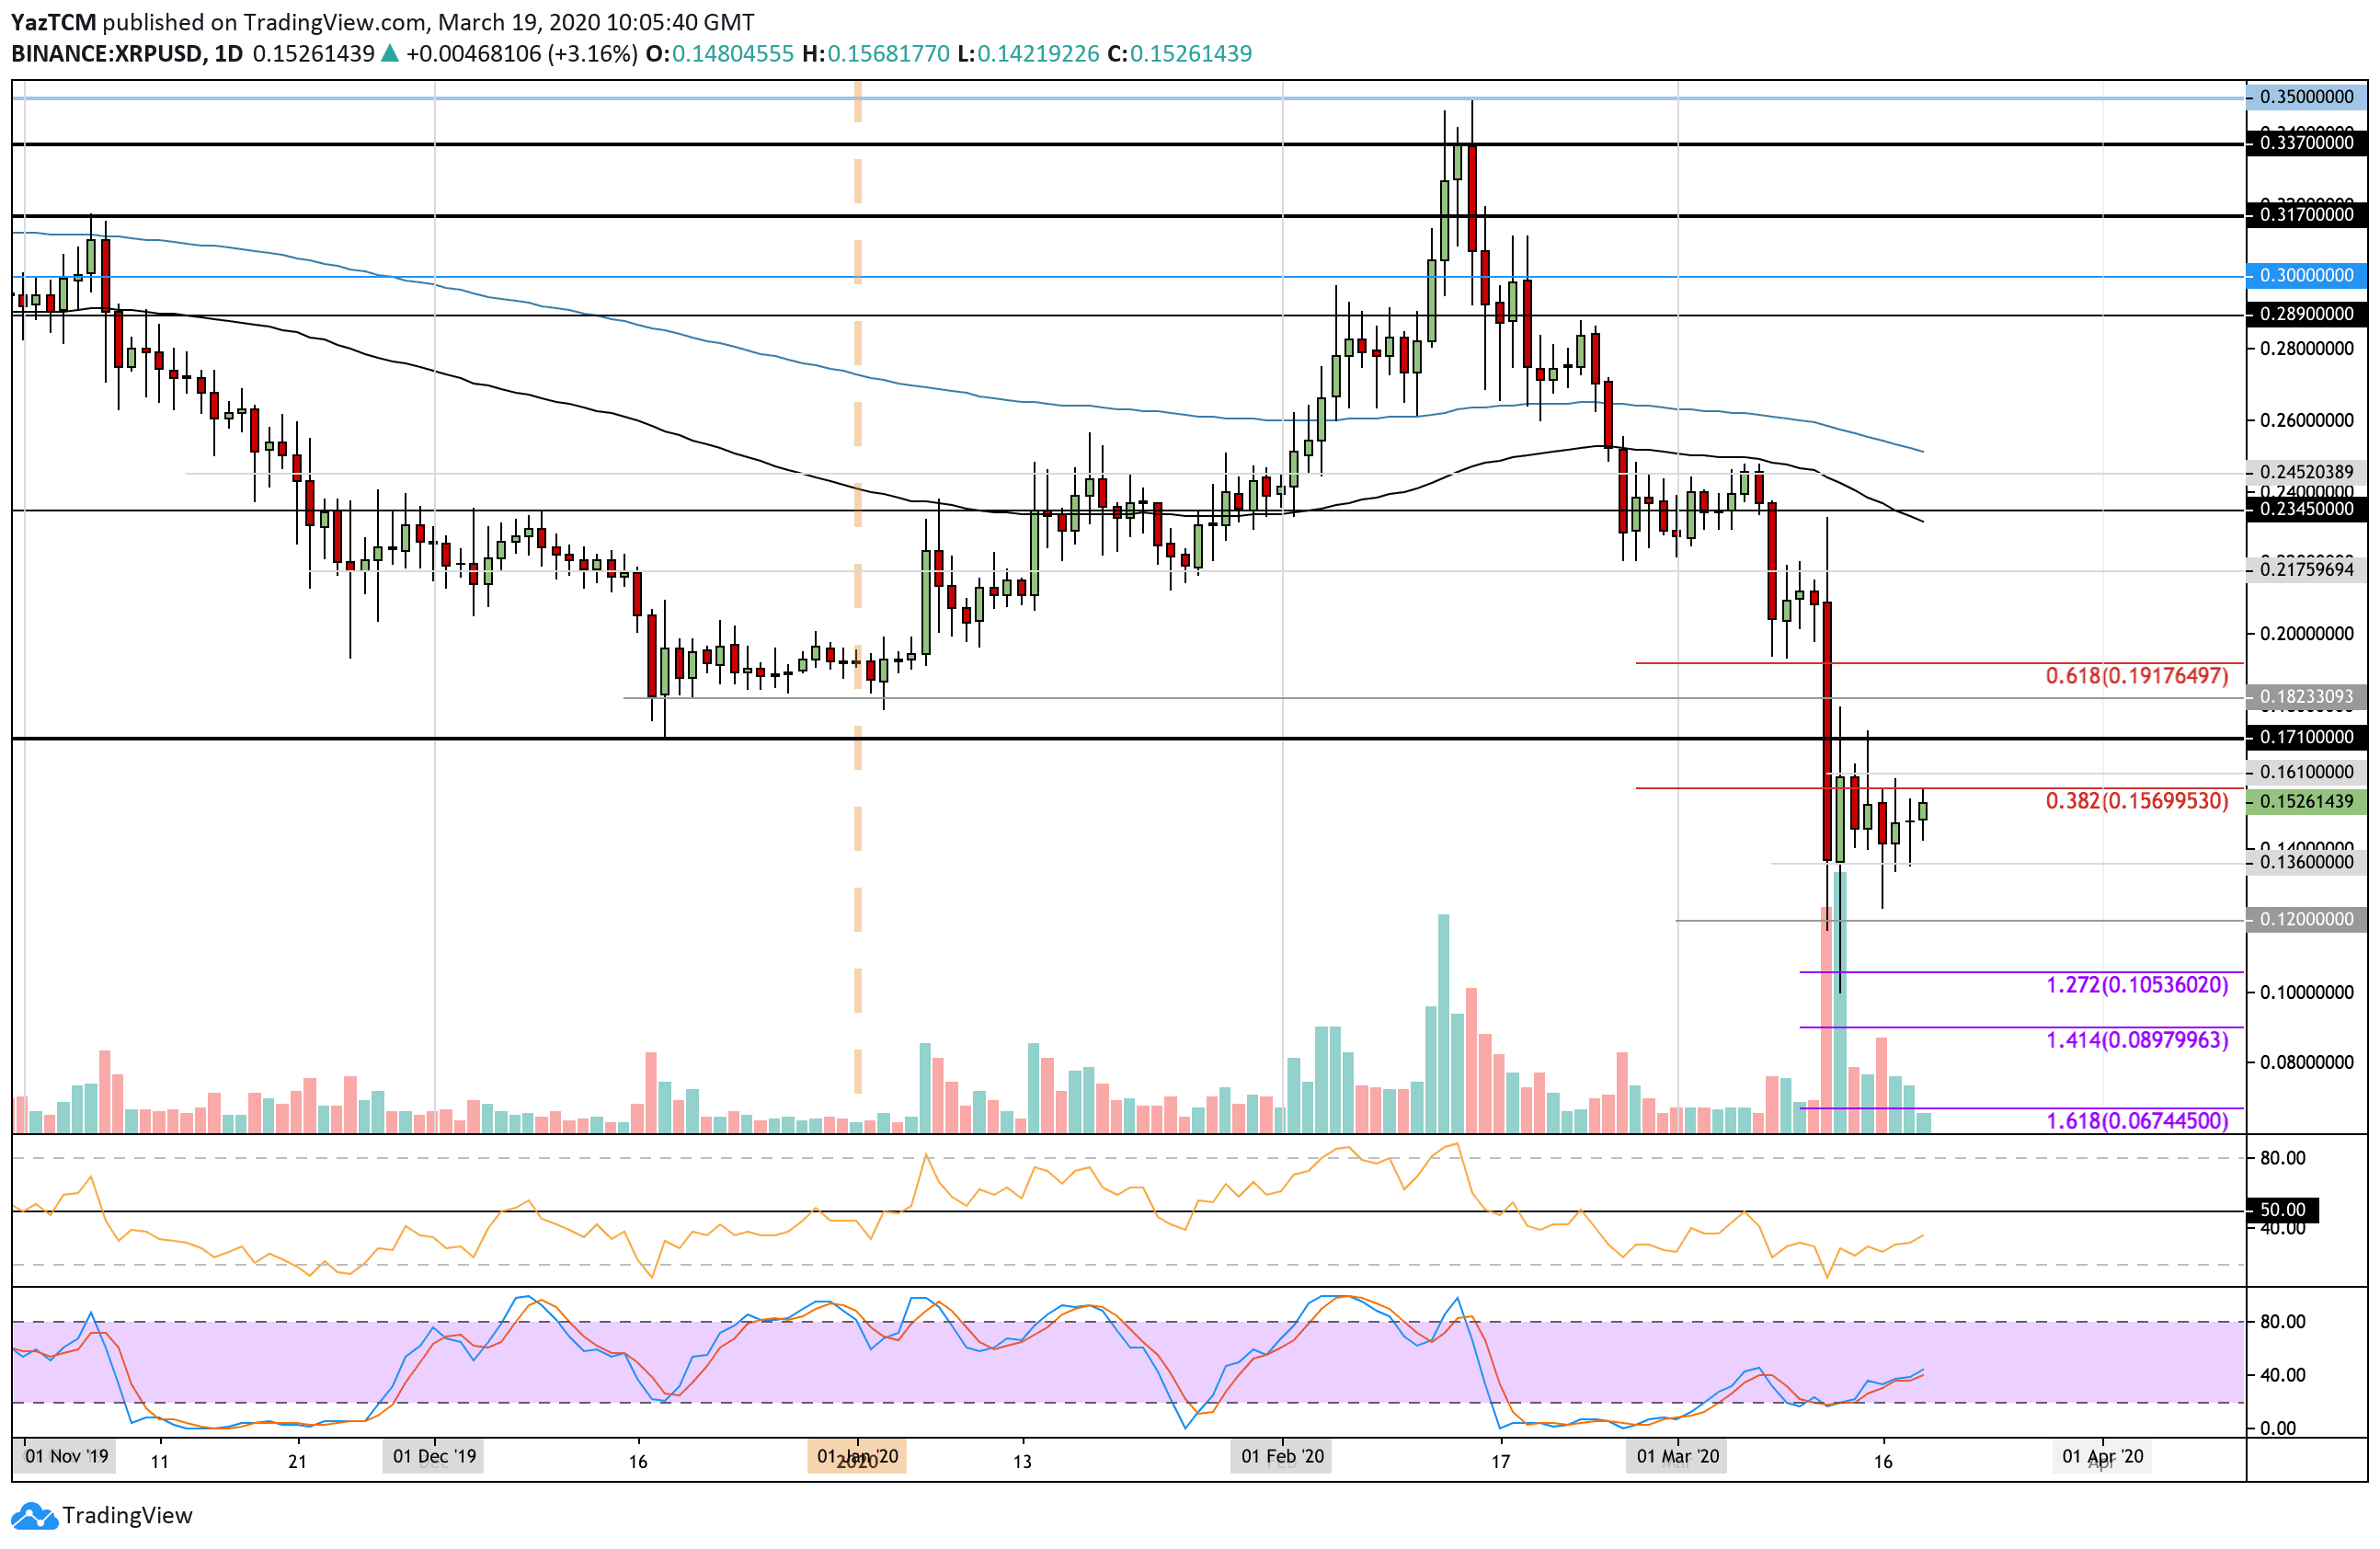
Support: $0.136, $0.13, $0.12.
Resistance: $0.161, $0.171, $0.182.
XRP/BTC:
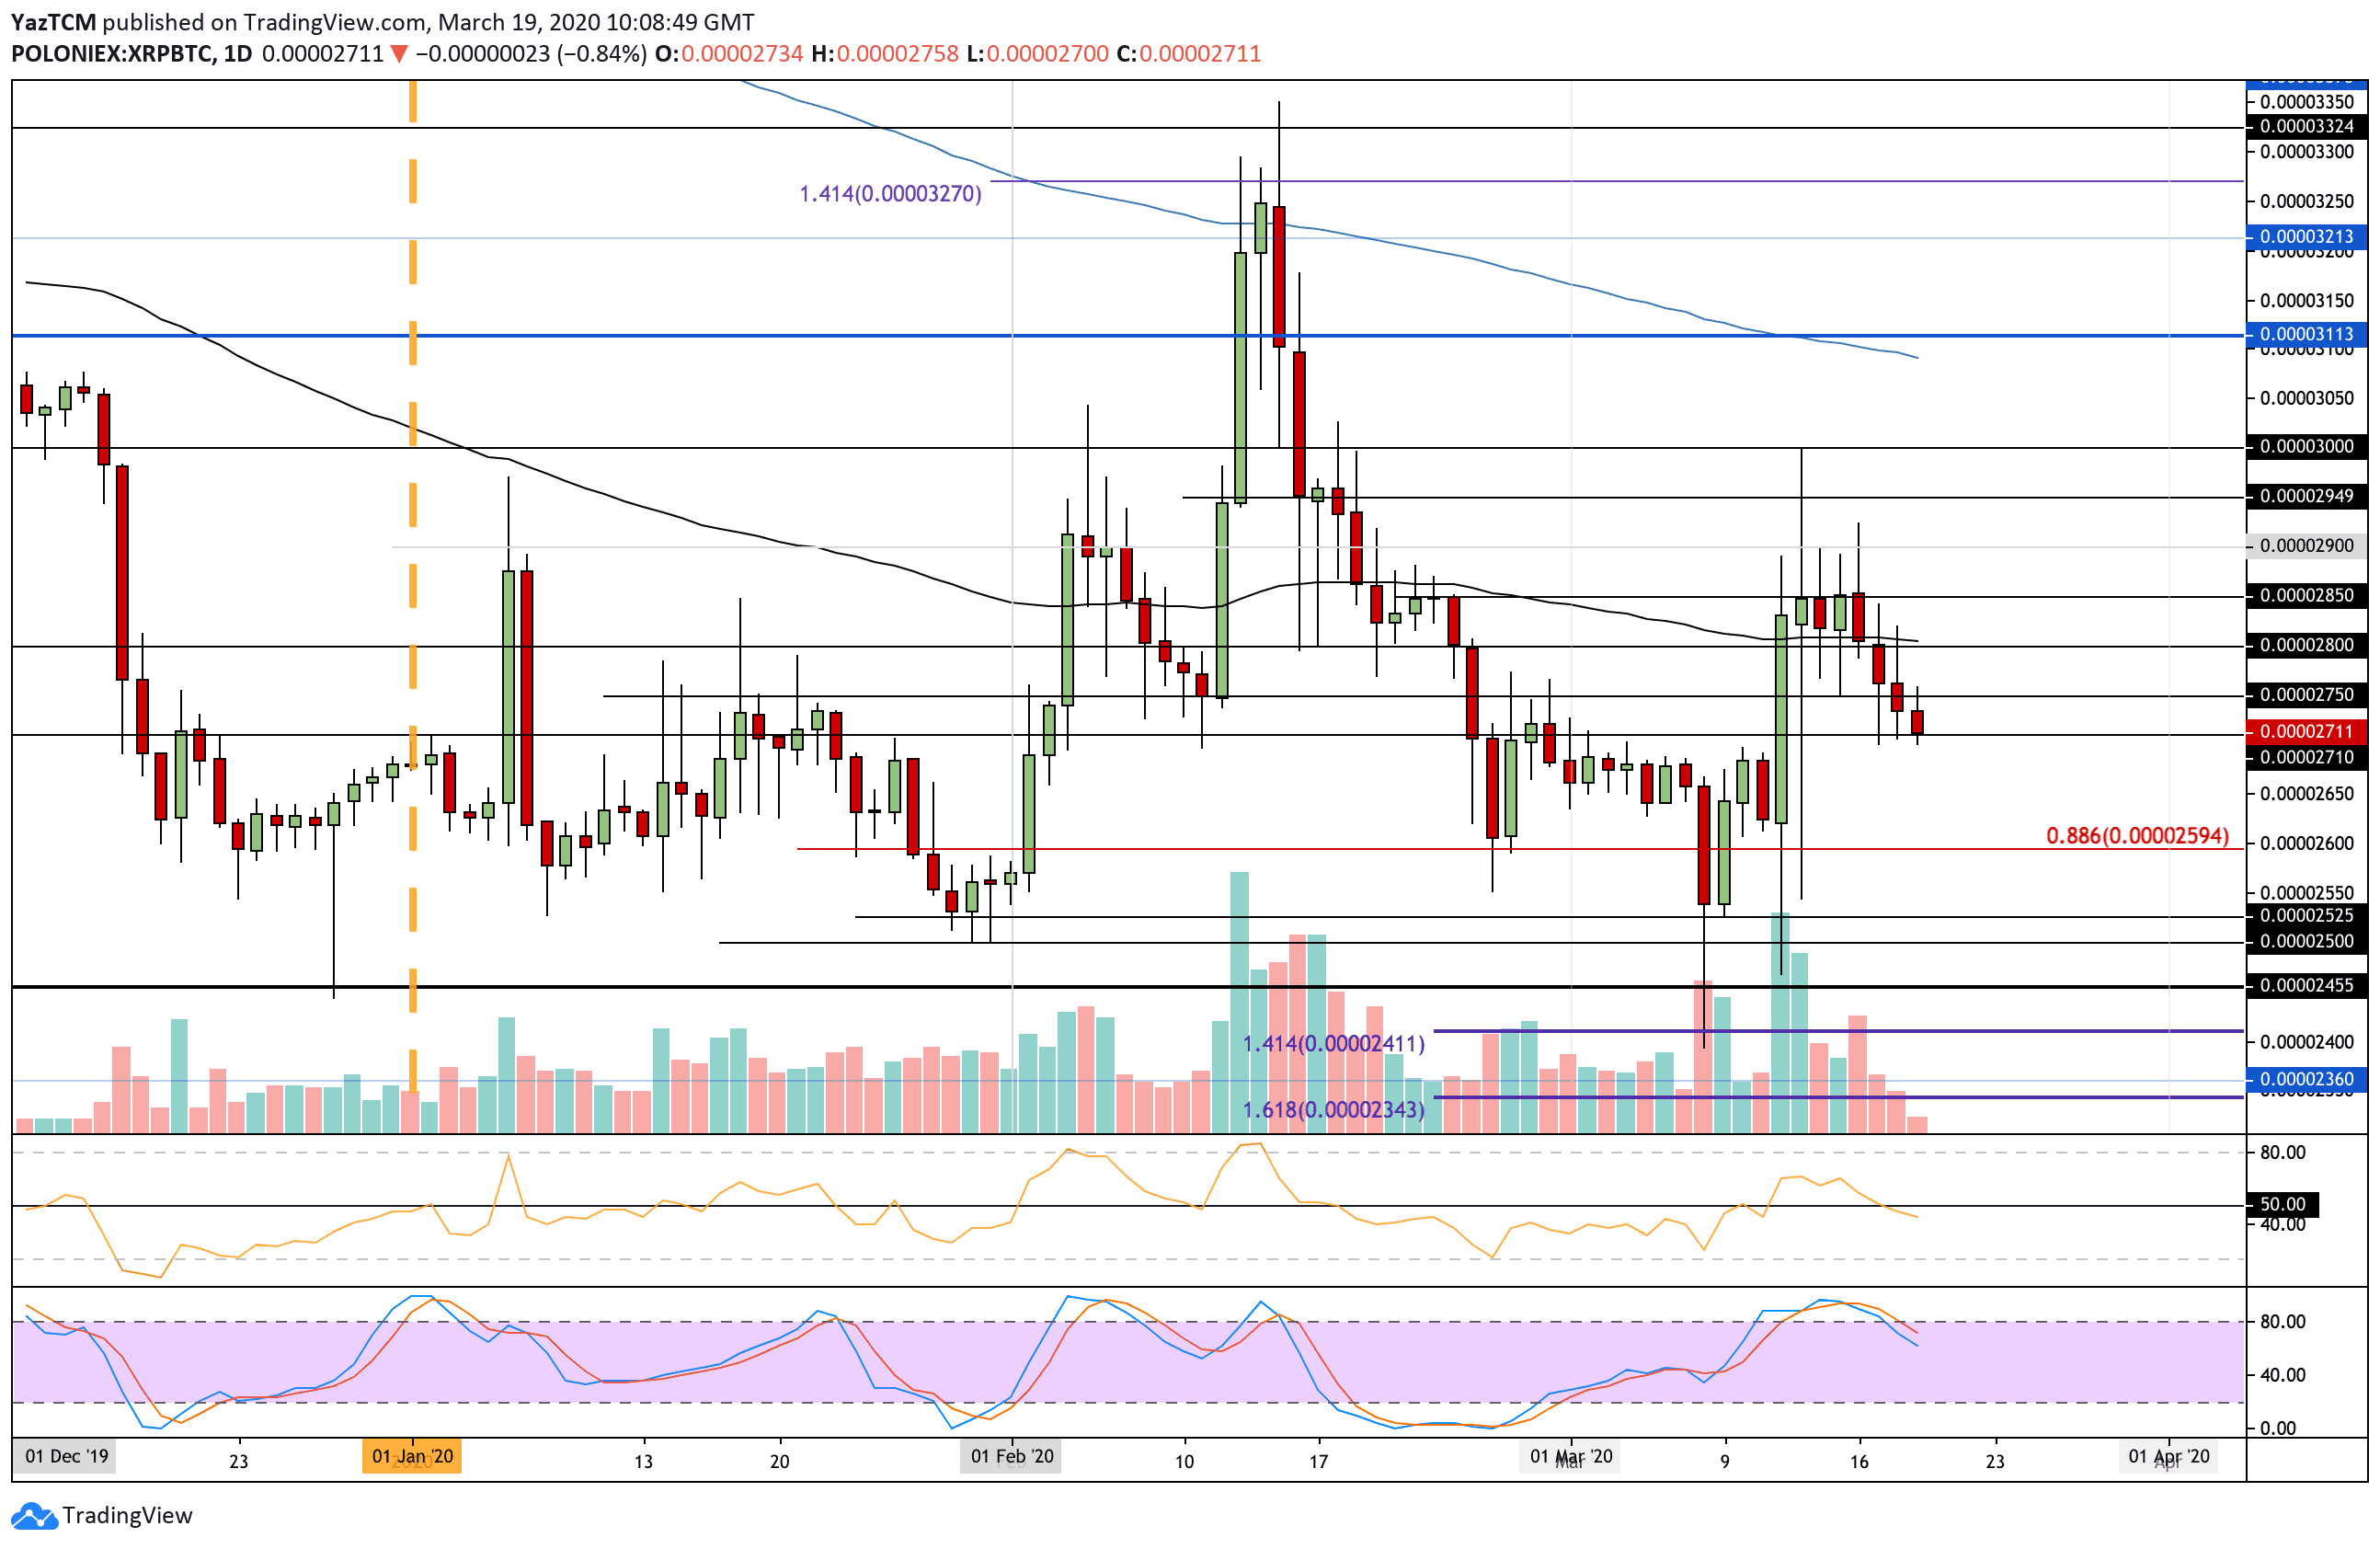
Support: 2700 SAT, 2650 SAT, 2600 SAT.
Resistance: 2750 SAT, 2800 SAT, 2850 SAT.
XRP has shown some signs of stabilizing after dropping by a steep 60% in March alone. The cryptocurrency fell from a high of $0.245 and spiked as low as $0.10 before being able to bounce back above $0.15.
It has been trading sideways in a range between $0.161 and $0.136 over the past 7-days and must break this range to dictate the next direction that it would like to head toward.
If the buyers manage to break above the upper boundary at $0.161, the first level of resistance lies at $0.171. Following this, resistance can be found at $0.182, $0.191, and $0.20.
From below, the first level of support lies at $0.136. Beneath this, support is located at $0.13, $0.12, and $0.10.
The RSI has been climbing this week, which is a sign that the selling pressure is fading. However, it still must break 50 before the buyers begin retaking control over the market momentum. Additionally, the Stochastic RSI is rising after producing a weak bullish crossover signal, which is a promising sign.
Against Bitcoin, XRP had climbed into resistance at 2850 SAT but failed to break above it. It even spiked as high as 3000 SAT during the week but recently started to show weakness as it dropped beneath the 100-days EMA at 2800 SAT and fell toward 2710 SAT.
This recent price fall is the main reason as to why XRP/USD is not increasing at the same pace of Bitcoin and Ethereum.
If the sellers push XRP beneath 2700 SAT, the first level of support is expected at 2650 SAT. Beneath this, additional support is found at 2600 SAT, 2525 SAT, and 2500 SAT.
From above, resistance lies at 2750 SAT, 2800 SAT (100-days EMA), and 2850 SAT.
The RSI recently dipped beneath 50 to show that the sellers are taking charge of the market momentum. Additionally, the Stochastic RSI recently produced a bearish crossover signal that shows there may be more selling pressure on the way.