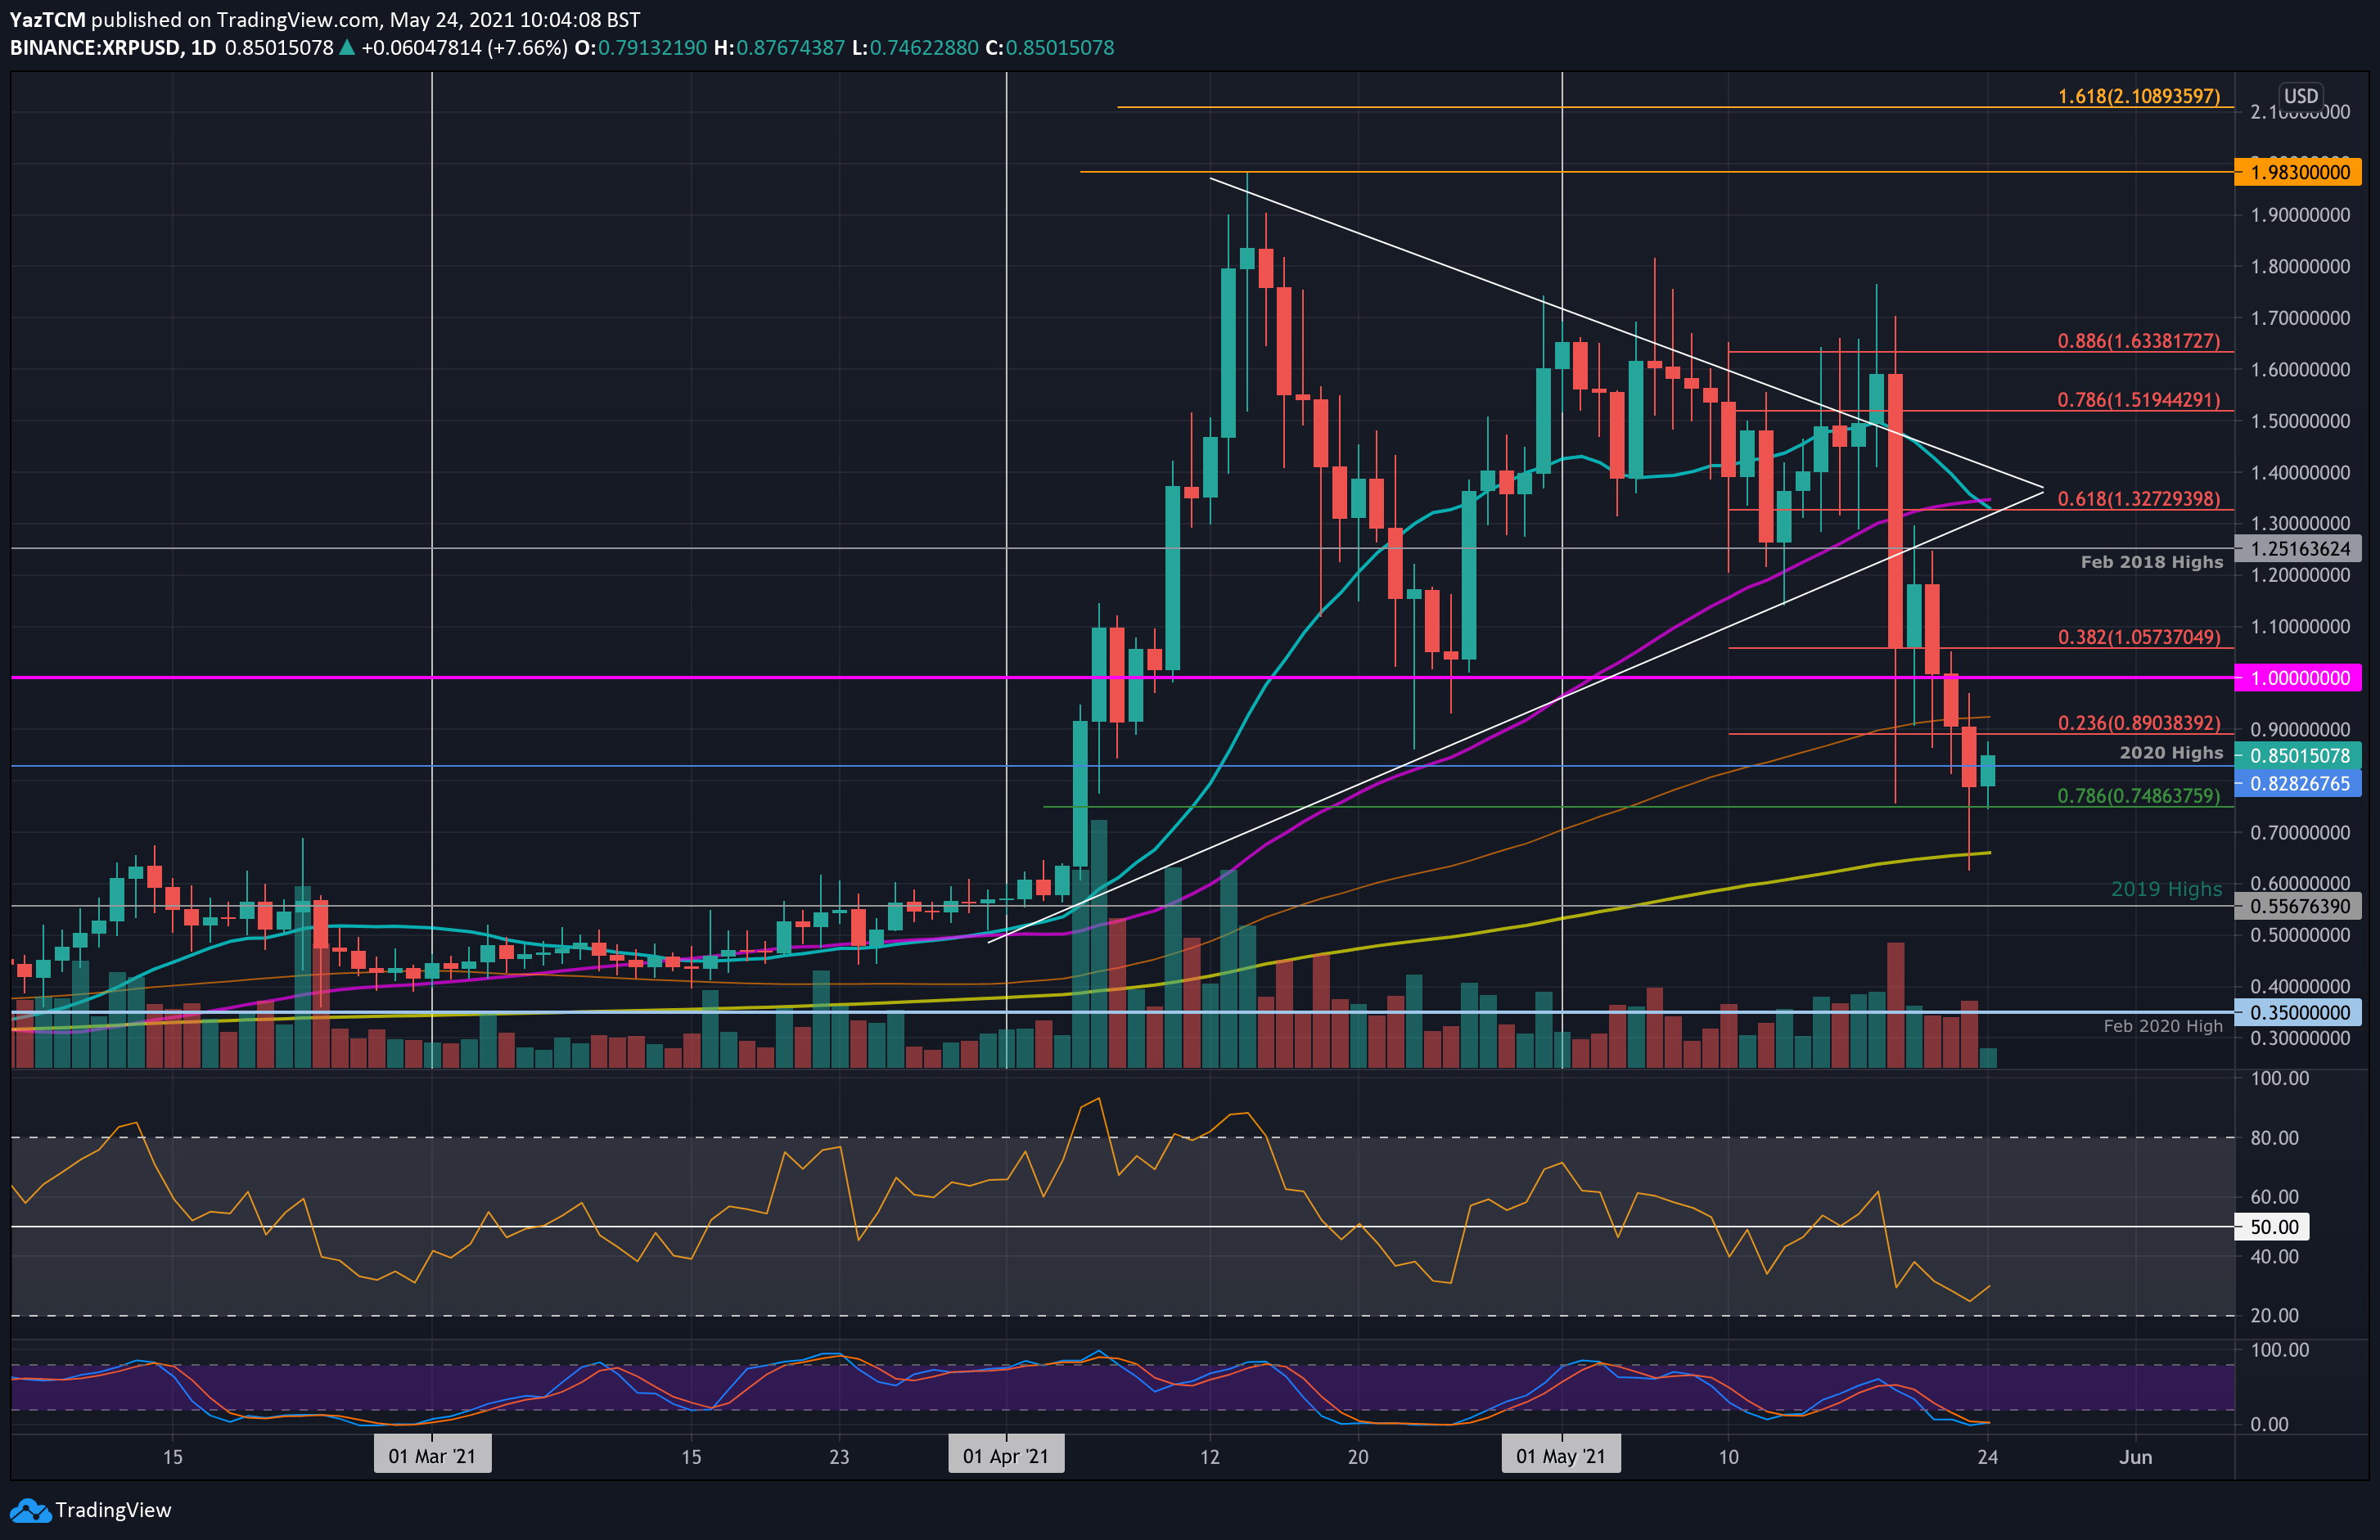
XRP/USD Daily Chart. Source: TradingView
Key Support Levels: $0.82, $0.75, $0.65
Key Resistance Levels: $0.89, $1.00, $1.05.
Like most cryptocurrencies, XRP had a rough week in which it dropped by a steep 41%. It reached a low of $0.62 yesterday but managed to rebound to close the daily candle at around $0.79.
The bulk of the weekly price drop occurred on Wednesday when XRP fell from $170 to reach as low as $0.75 (.786 Fib). On that day, it managed to rebound to close the daily candle above $1.05.
Since then, XRP has been slowly declining throughout the remainder of the week to hit the 2-month low yesterday at around $0.61. Today, it bounced by 8% and is now trading back above the 2020 highs at $0.85.
Looking ahead, the first resistance now lies at $0.89 (bearish .236 Fib & 100-day MA). This is followed by $1.00, $1.05 (bearish .382 Fib), and $1.25 (Feb 2018 highs).
On the other side, the first support lies at $0.8282 (2020 highs). This is followed by $0.75 (.786 Fib), $0.65 (200-day MA), and $0.6.
The daily RSI has bounced higher from oversold conditions and is pointing upward, indicating an easing of the bearish momentum. Additionally, the Stochastic RSI is primed for a bullish crossover signal.
Key Support Levels: 2260 SAT, 2000 SAT, 1900 SAT.
Key Resistance Levels: 2460 SAT, 2600 SAT, 2737 SAT.
XRP also suffered a disastrous week against bitcoin in which it dropped from above the October 2019 highs of 3780 SAT to reach as low as 2000 SAT yesterday. The price drop caused XRP to break beneath the 50-day MA for the first time since March 2021 and also caused it to fall beneath a rising trend line.
Luckily, the bulls managed to rebound to close yesterday’s daily candle at 2260 SAT, where lies the .786 Fib support. Today, XRP has bounced slightly higher as it now trades at 2321 SAT.
Looking ahead, the first resistance lies at 2460 SAT (bearish .236 Fib). This is followed by 2600 SAT (50-day MA), 2737 SAT (bearish .382 Fib), and 3000 SAT.
On the other side, the first support lies at 2260 SAT (.786 Fib). This is followed by 2000 SAT, 1900 SAT (Jul 2020 low), and 1700 SAT (100-day & 200-day MA).
The RSI is also pushing higher from the bearish territory as it starts to point upward. Additionally, the Stochastic RSI is also primed for a bullish crossover signal.