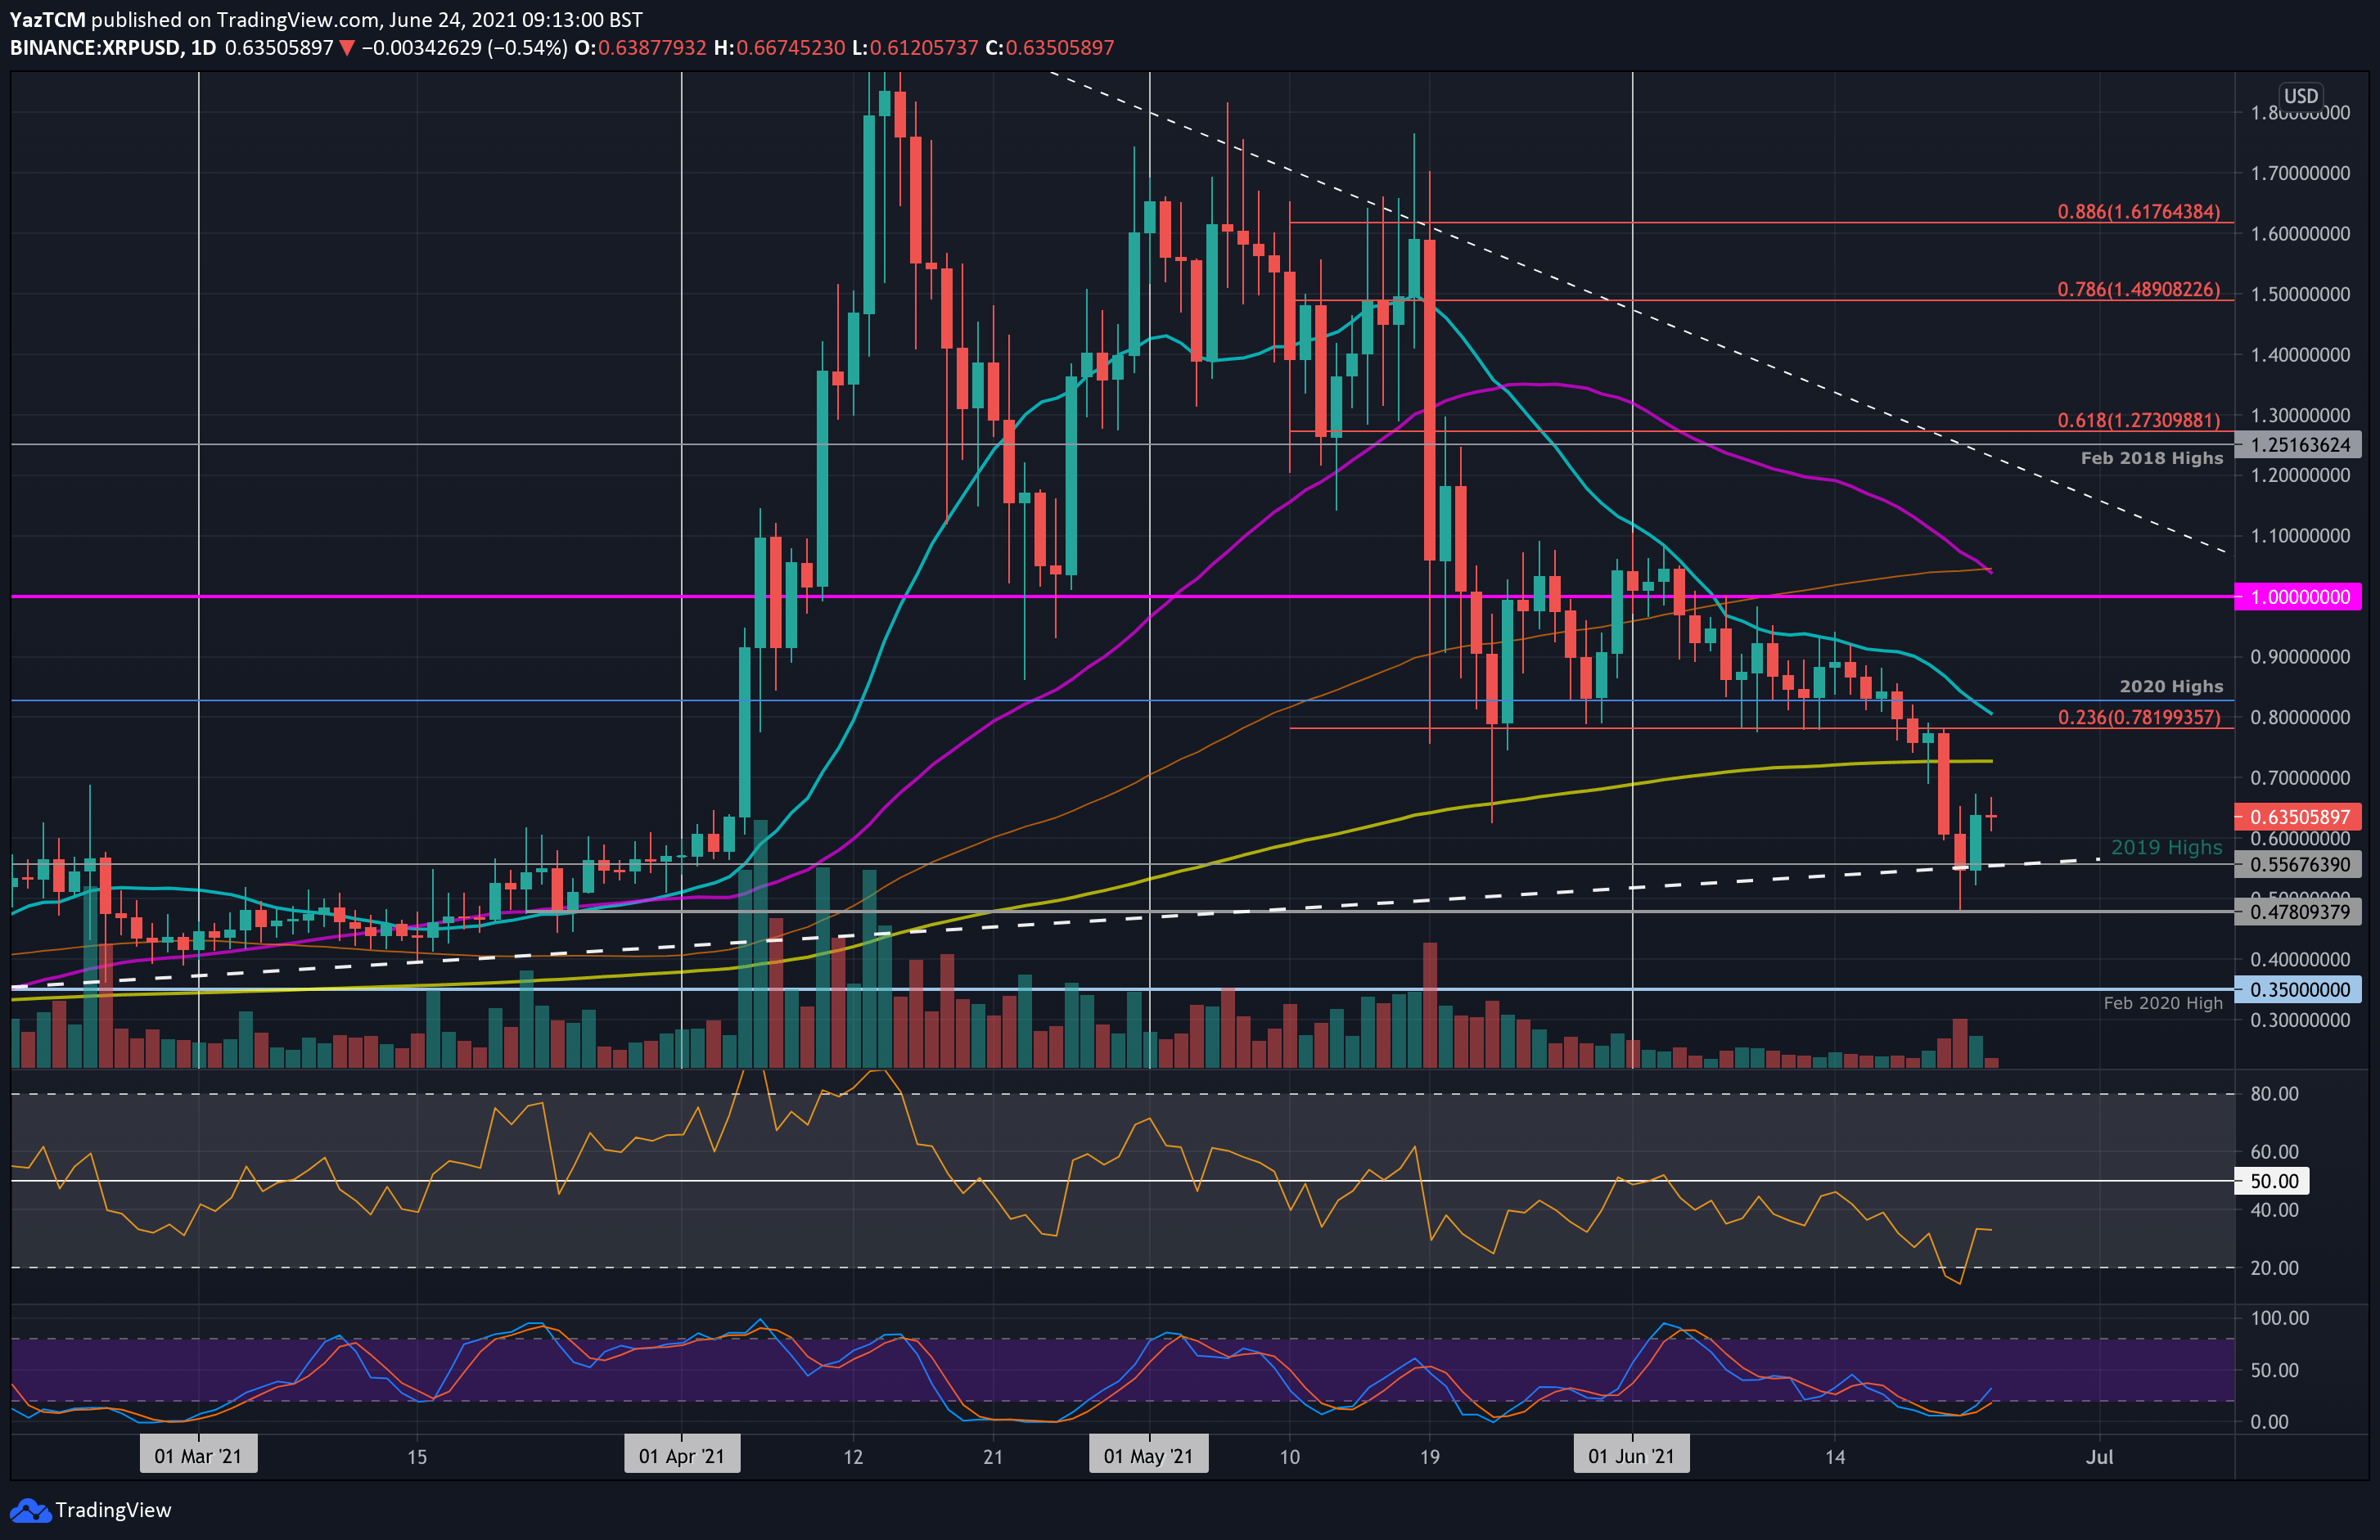
XRP/USD Daily Chart. Source: TradingView.
Key Support Levels: $0.6, $0.556, $0.5.
Key Resistance Levels: $0.72, $0.781, $0.8.
XRP is down by a sharp 23% over the week after falling beneath the 2020 highs at $0.8282 and dropping below the 200-day MA at $0.72. It continued down until support was found at $0.55 – the 2019 highs. It did spike as low as $0.478 when BTC briefly dipped beneath $30K.
Since finding the support at the 2019 highs, XRP has rebounded and is now trading at $0.635. Nevertheless, the spike toward $0.478 caused XRP to set a new three-month low.
Looking ahead, if the sellers push lower, the first support lies at $0.6. This is followed by $0.556 (2019 highs), $0.5, and $0.478. Added support lies at $0.4 and $0.35 (Feb 2020 highs).
On the other side, the first strong resistance lies at $0.72 (200-day MA). This is followed by $0.781 (bearish .236 Fib), $0.8 (20-day MA), and $0.8282 (2020 Highs). Additional resistance is found at $0.9 and $1.
The RSI has bounced from extremely oversold conditions this week but is still in the bearish favor. Before the rebound, the bearish momentum was at the highest level since December 2020.
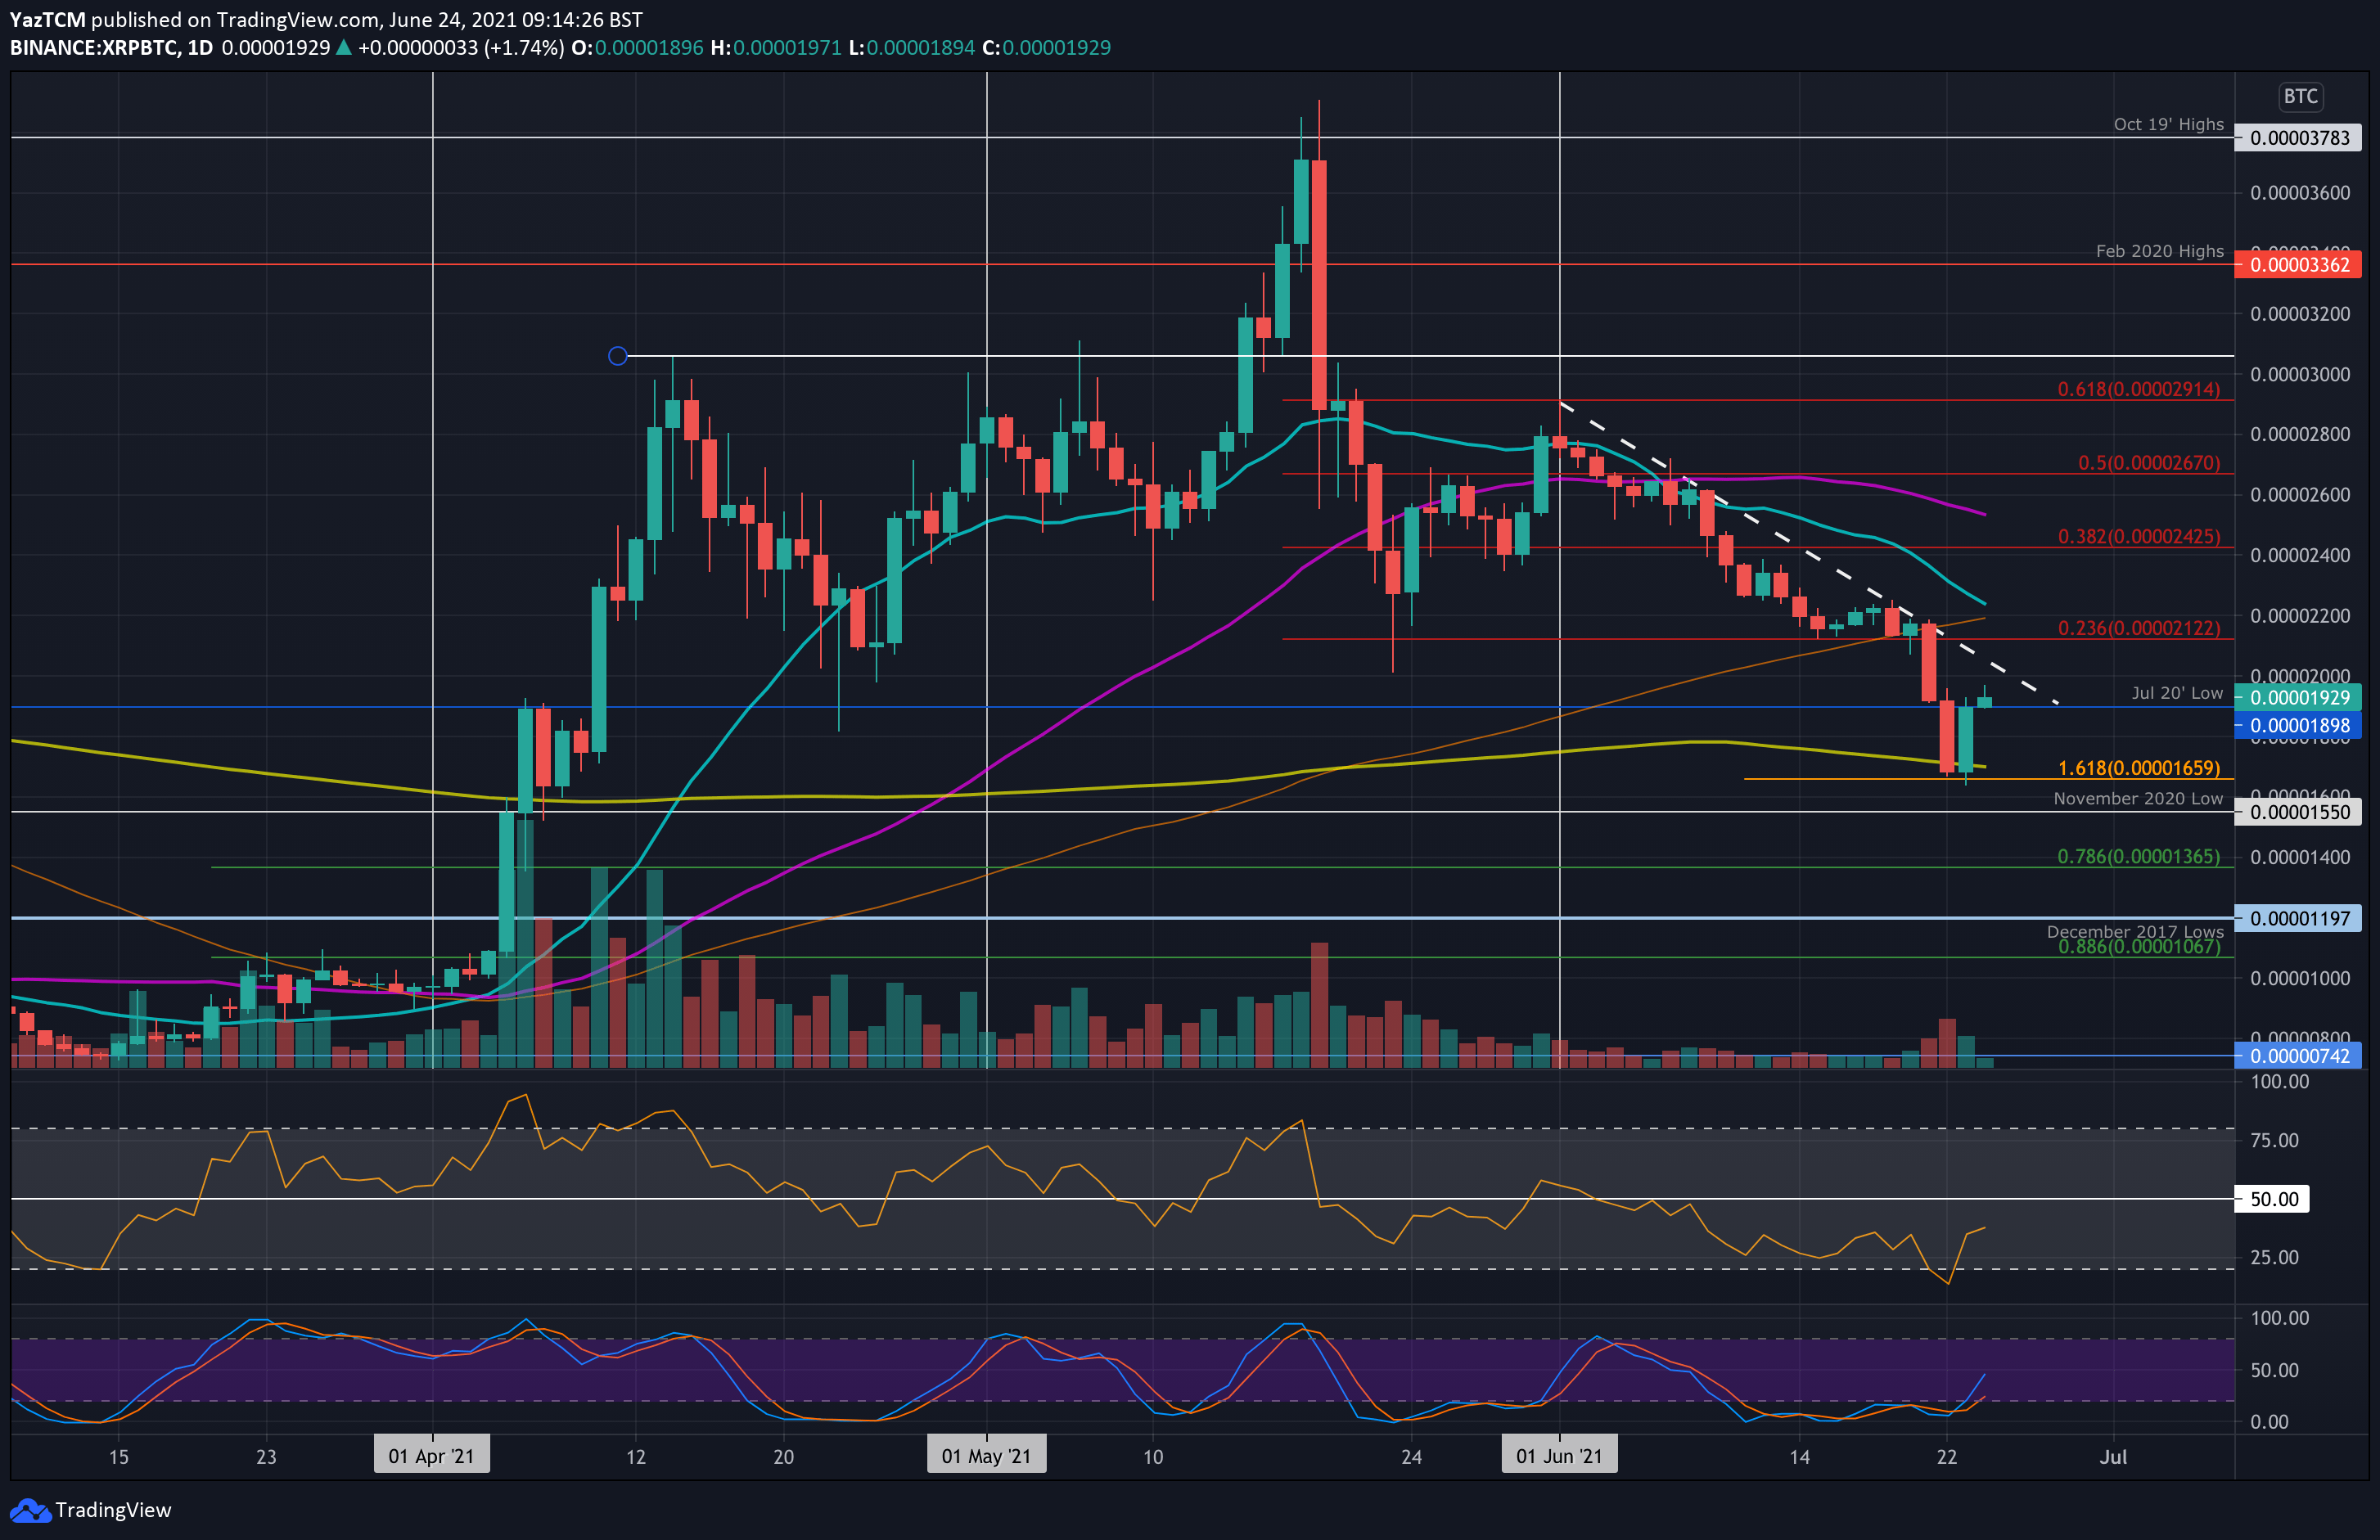
Key Support Levels: $1900 SAT, 1800 SAT, 1660 SAT.
Key Resistance Levels: 2000 SAT, 2120 SAT, 2200 SAT.
Against BTC, XRP fell below the 100-day MA level on Monday and continued lower until support was found around 1660 SAT on Tuesday. The support there was provided by the 200-day MA and a downside 1.618 Fib Extension.
It has since rebounded from there and is now trading back above the 200-day MA and the July 2020 lows at 1900 SAT.
Looking ahead, if the sellers push lower, the first support lies at 1900 SAT (July 2020 lows). This is followed by 1800 SAT, 1660 SAT (200-day MA & downside 1.618 Fib Extension), and 1550 SAT (Nov 2020 lows).
On the other side, the first resistance lies at 2000 SAT. This is followed by 2120 SAT (bearish .236 Fib), 2200 SAT (100-day MA & 20-day MA), and 2425 ST (bearish .382 Fib).
The RSI has also bounced from extremely oversold conditions, indicating the bearish momentum is fading. Additionally, the Stochastic RSI produced a bullish crossover signal.