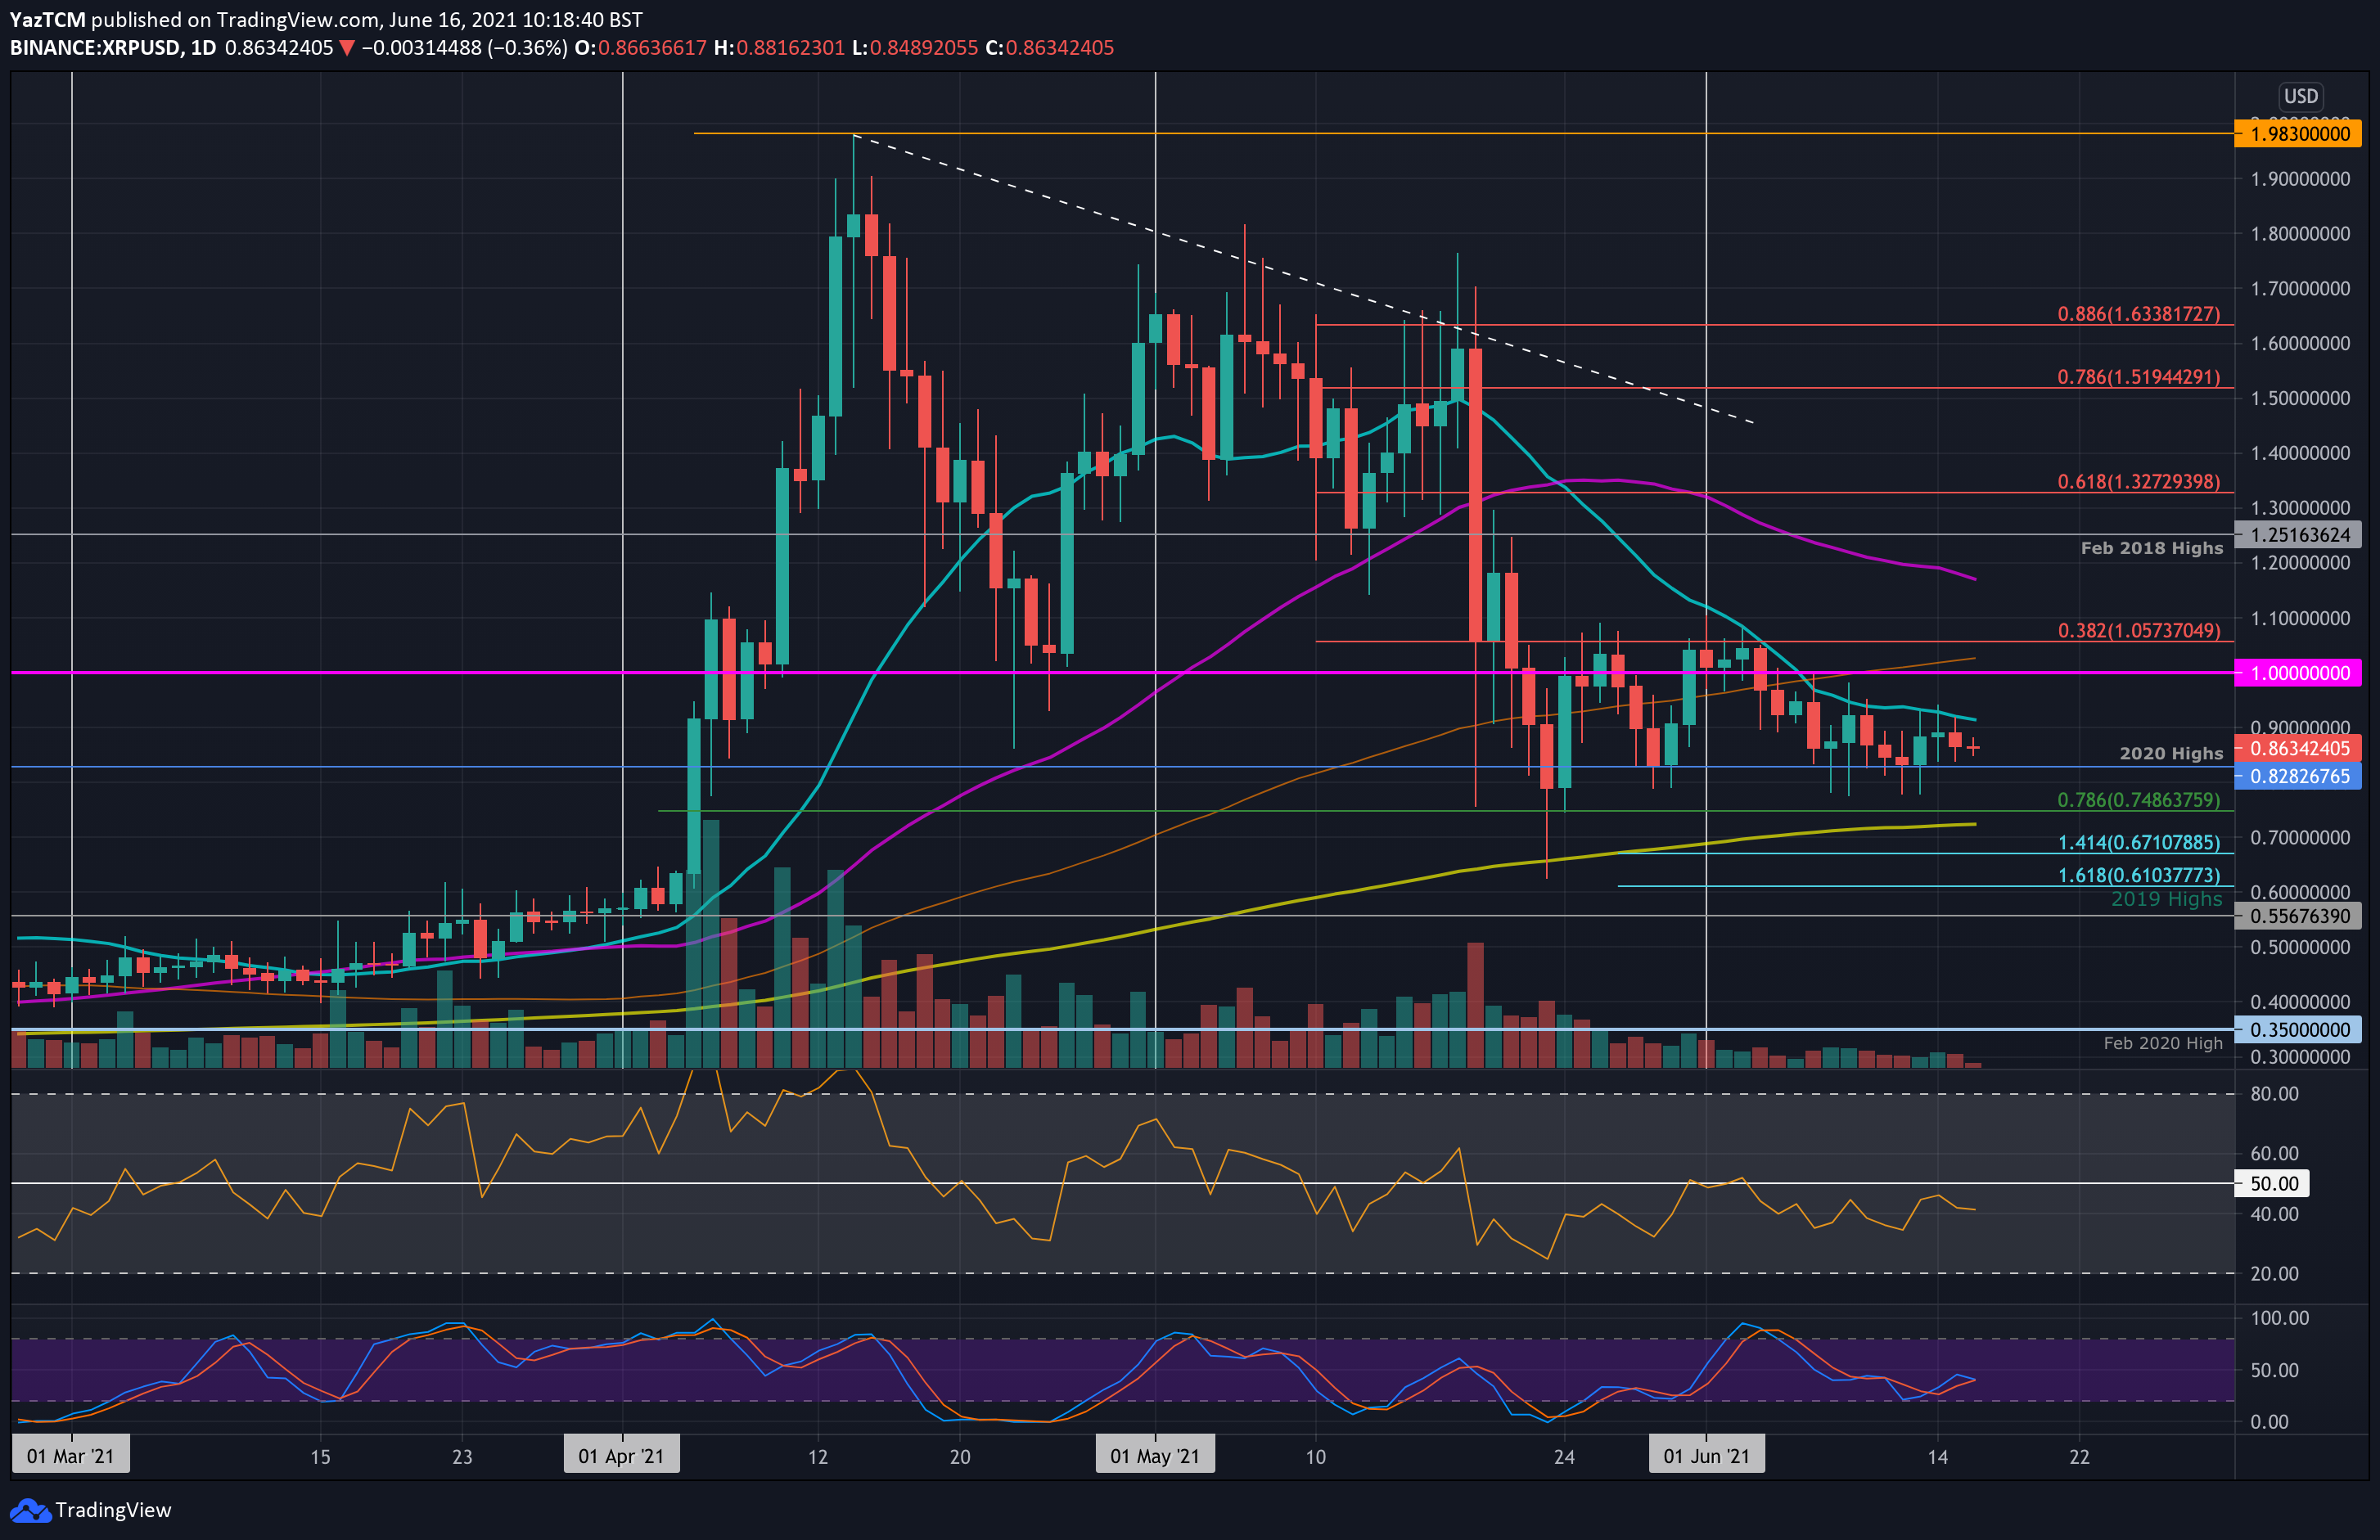
XRP/USD Daily Chart. Source: TradingView.
Key Support Levels: $0.828, $0.8, $0.75.
Key Resistance Levels: $0.92, $1.00, $1.05.
XRP has been inside a trading range between $1.05 and $0.8282 since the end of May. It bounced higher from $0.8282 (2020 highs) at the end of May and pushed into the $1.05 resistance (bearish .382 Fib) at the start of June.
Since then, XRP dropped beneath the 20-day MA and traded lower until support was found at $0.8282. Although the market has spiked beneath the support on numerous occasions, each daily candle in June managed to close above it.
Looking ahead, the first level of support lies at $0.8282. This is followed by $0.8, $0.75 (.786 Fib), the 200-day MA, and $0.7.
Alternatively, the first resistance lies at $0.92 (20-day MA). This is followed by $1, the 100-day MA, $1.05 (bearish .382 Fib), and $1.20 (50-day MA).
The RSI remains beneath the midline, indicating weak bearish momentum within the market. It will need to rise back toward the midline to allow XRP to return to the upper boundary of the range. It would still need to climb above 50 for a positive breakout of the current range.
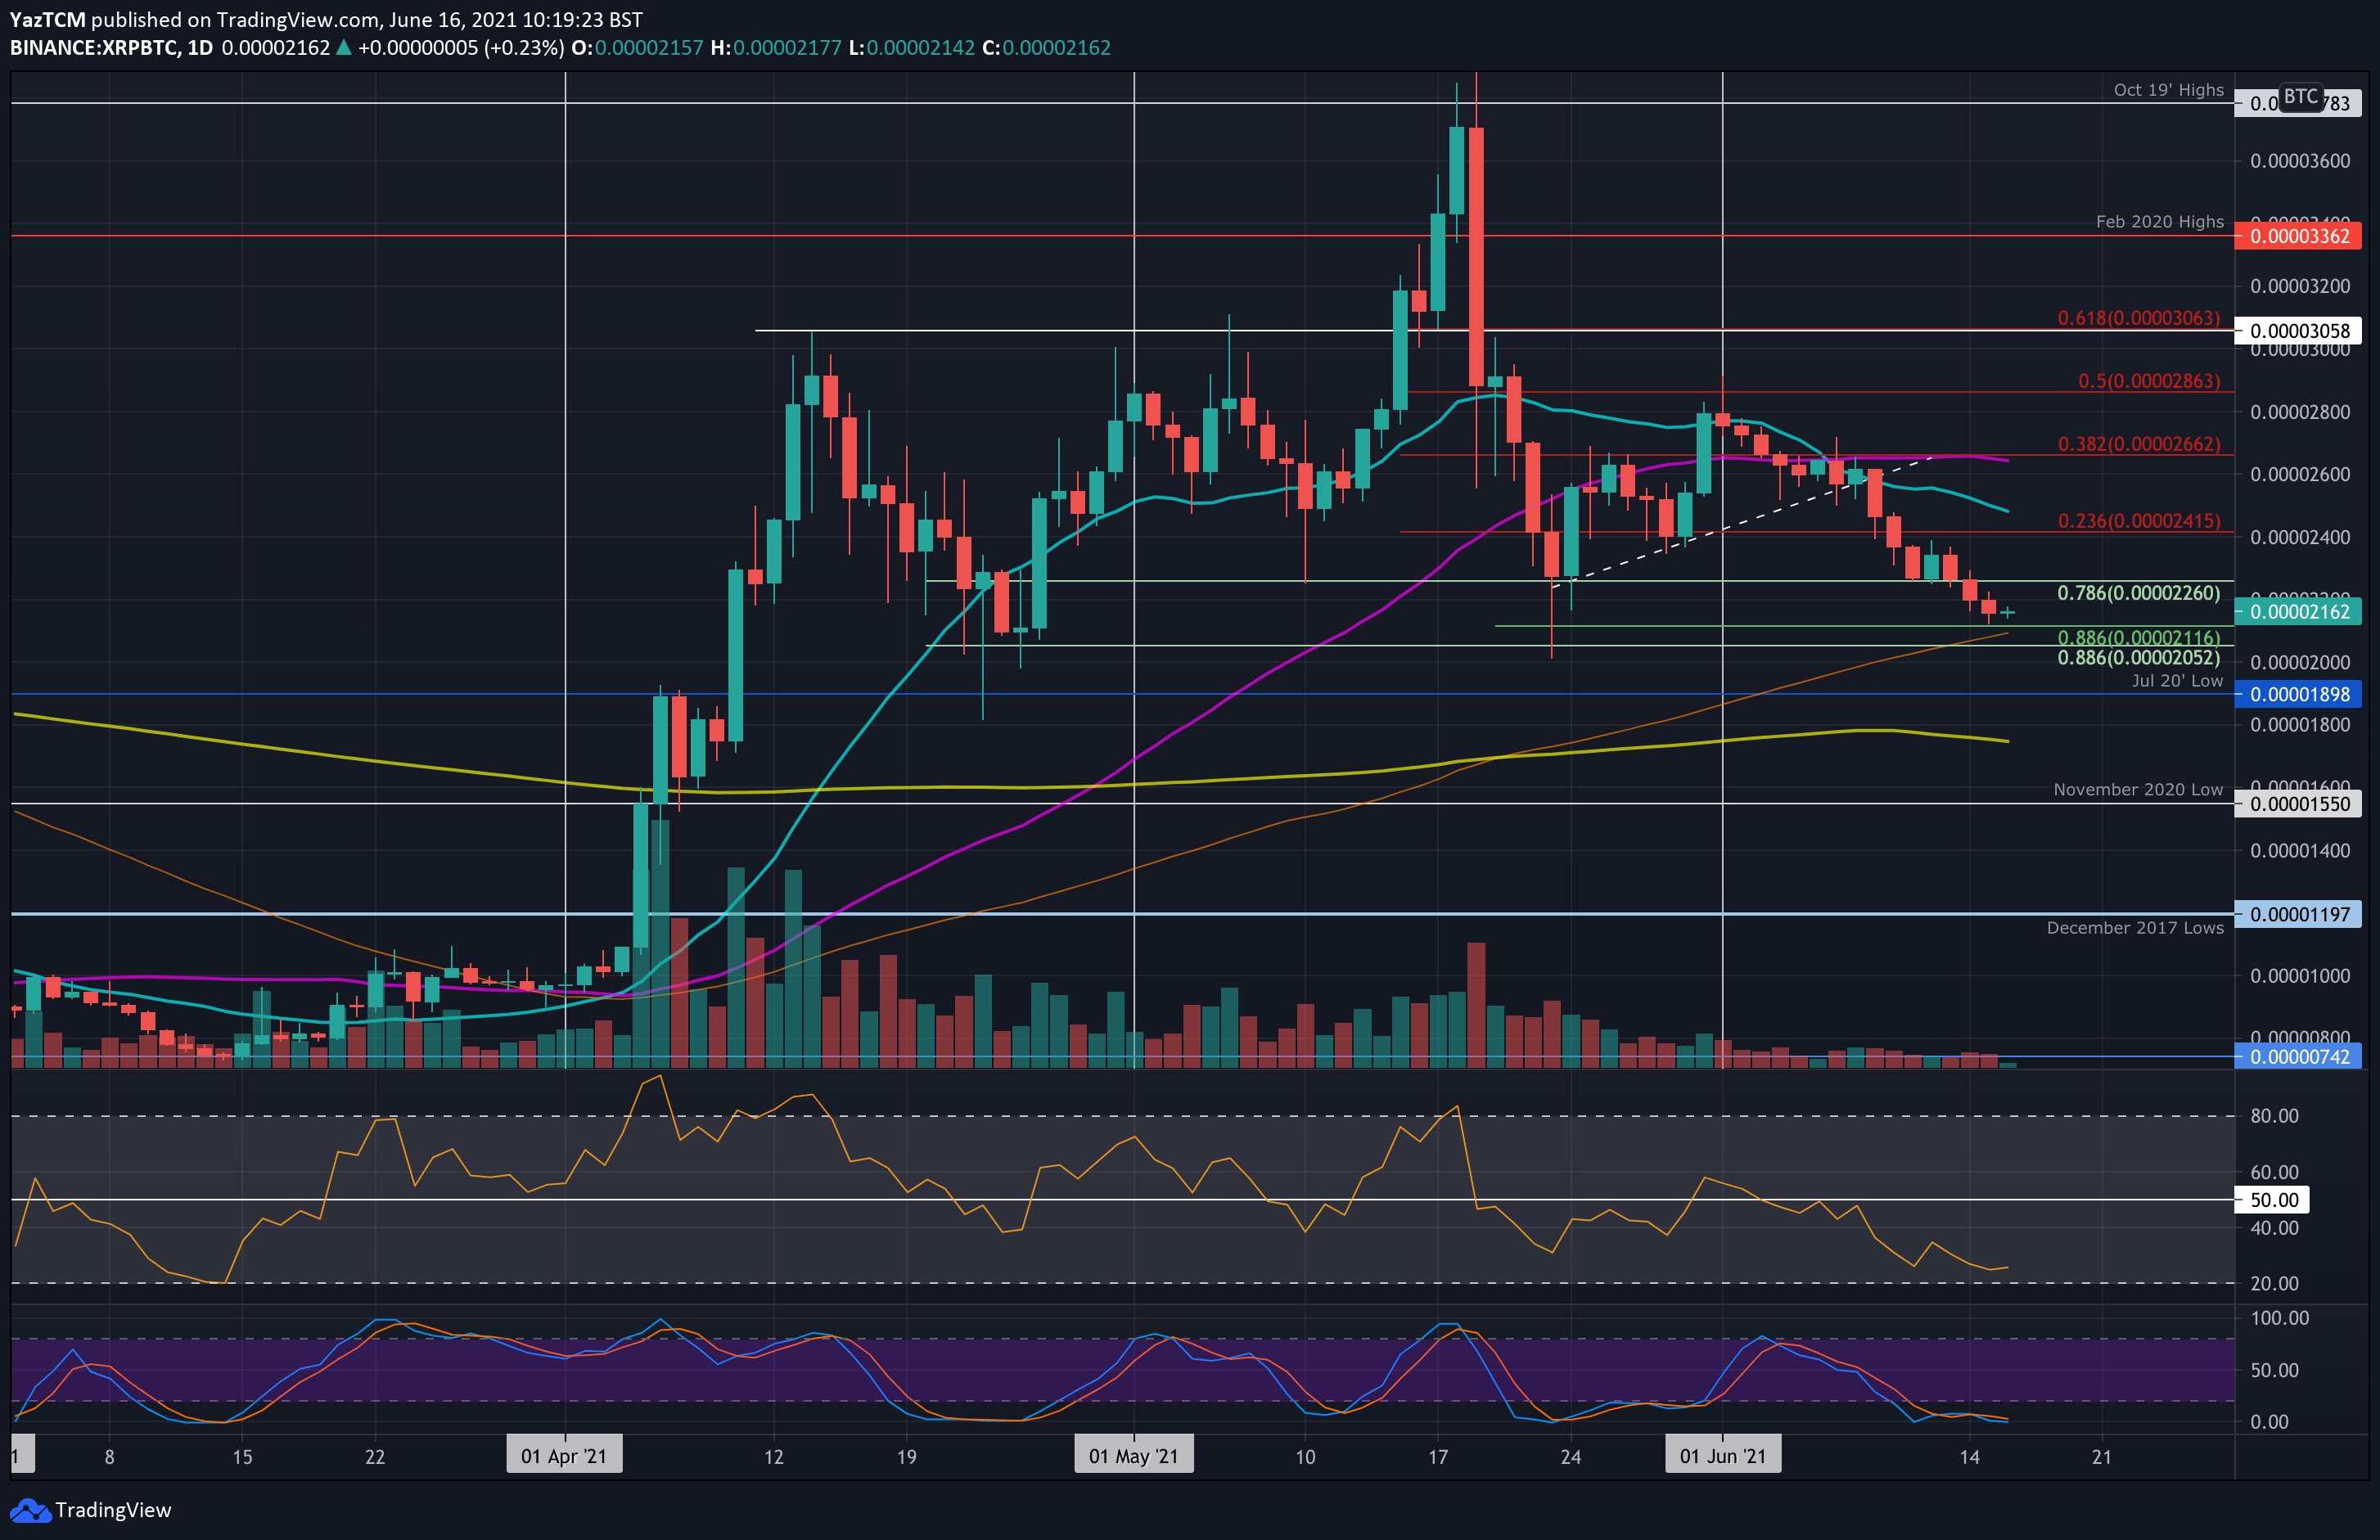
Key Support Levels: 2100 SAT, 2050 SAT, 1900 SAT.
Key Resistance Levels: 2260 SAT, 2400 SAT, 2660 SAT.
XRP continues to slowly bleed out against BTC this week after falling beneath 2260 SAT (.786 Fib) on Monday and hitting as low as 2115 SAT (short-term .886 Fib & 100-day MA) yesterday.
The daily closing price yesterday is the lowest closing price seen since late April. XRP is now approaching the 100-day MA, which hasn’t been seen since the start of April 2021.
Looking ahead, the first support lies at the 100-day MA, around 2100 SAT. This is followed by 2050 SAT (.886 Fib), 1900 SAT (July 2020 low), and 1750 SAT (200-day MA).
On the other side, the first resistance lies at 2260 SAT. This is followed by 2400 SAT (bearish .236 Fib) and 2660 SAT (bearish .382 Fib & 50-day MA).
The RSI is nearing extremely oversold conditions. This is the most oversold the market has been since mid-March, which could suggest the worst of the bearish momentum has passed.