XRP/USD:
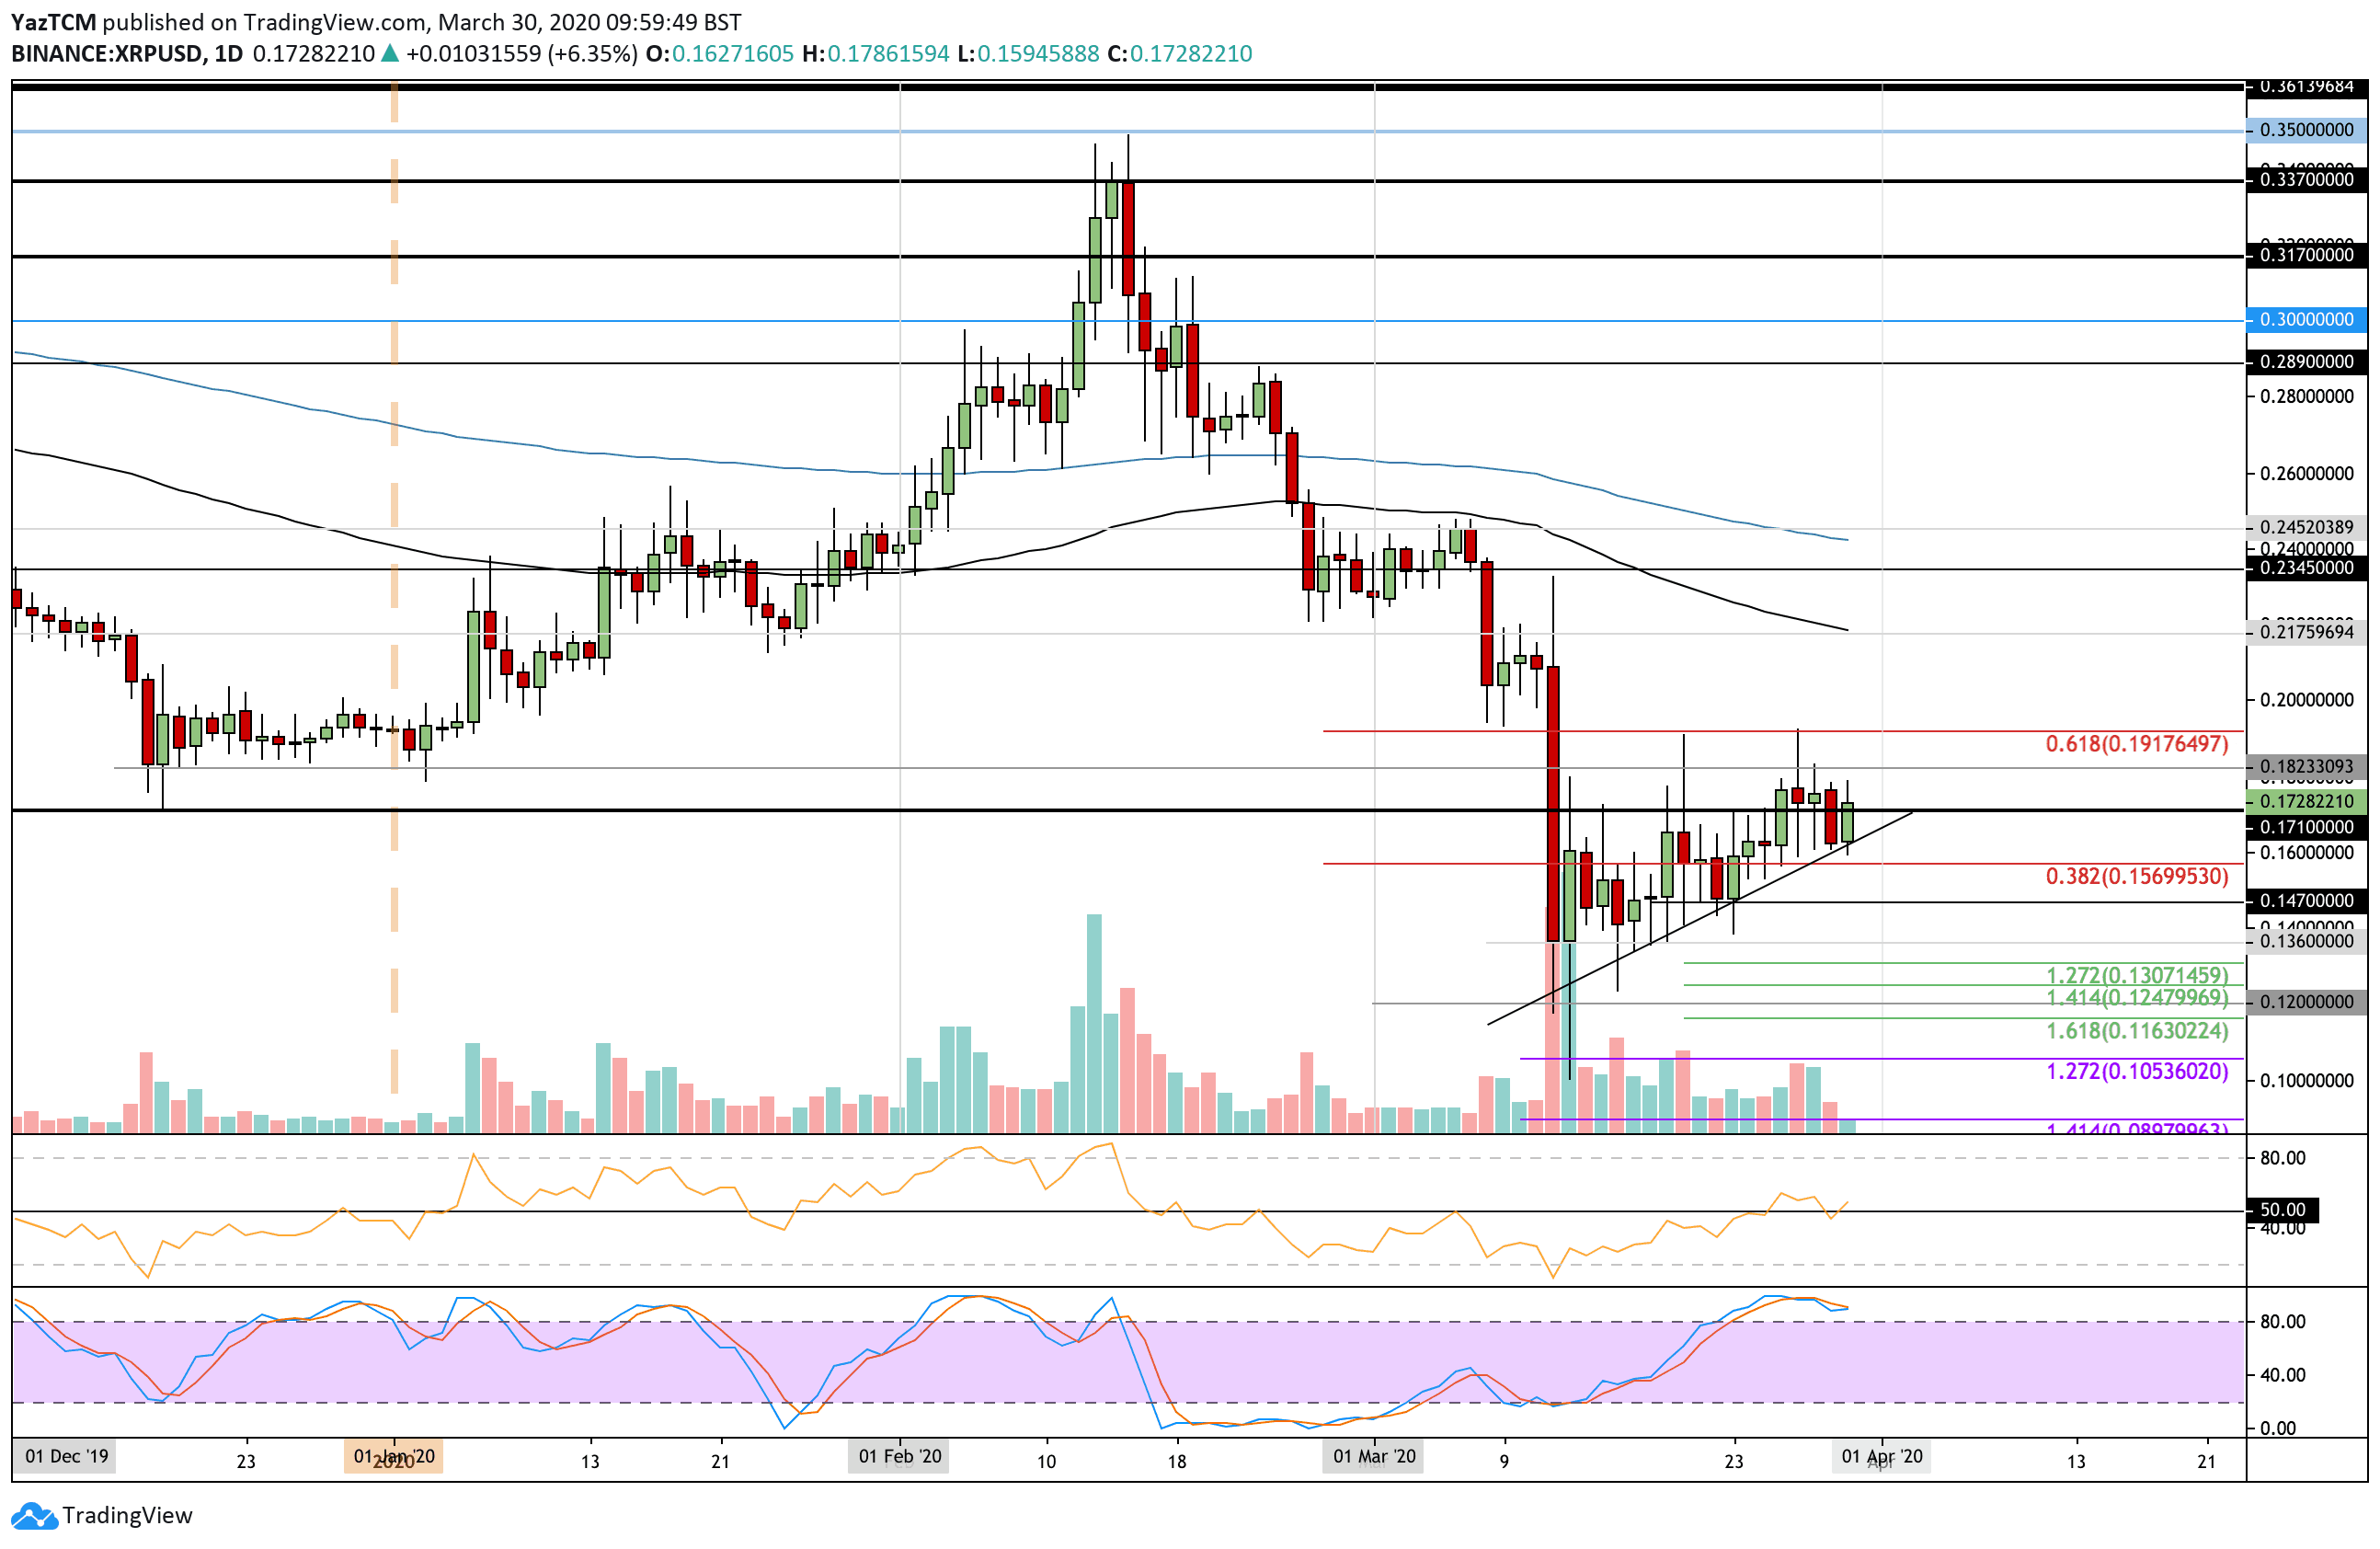
Support: $0.171, $0.16, $0.156.
Resistance: $0.182, $0.191, $0.2.
XRP/BTC:
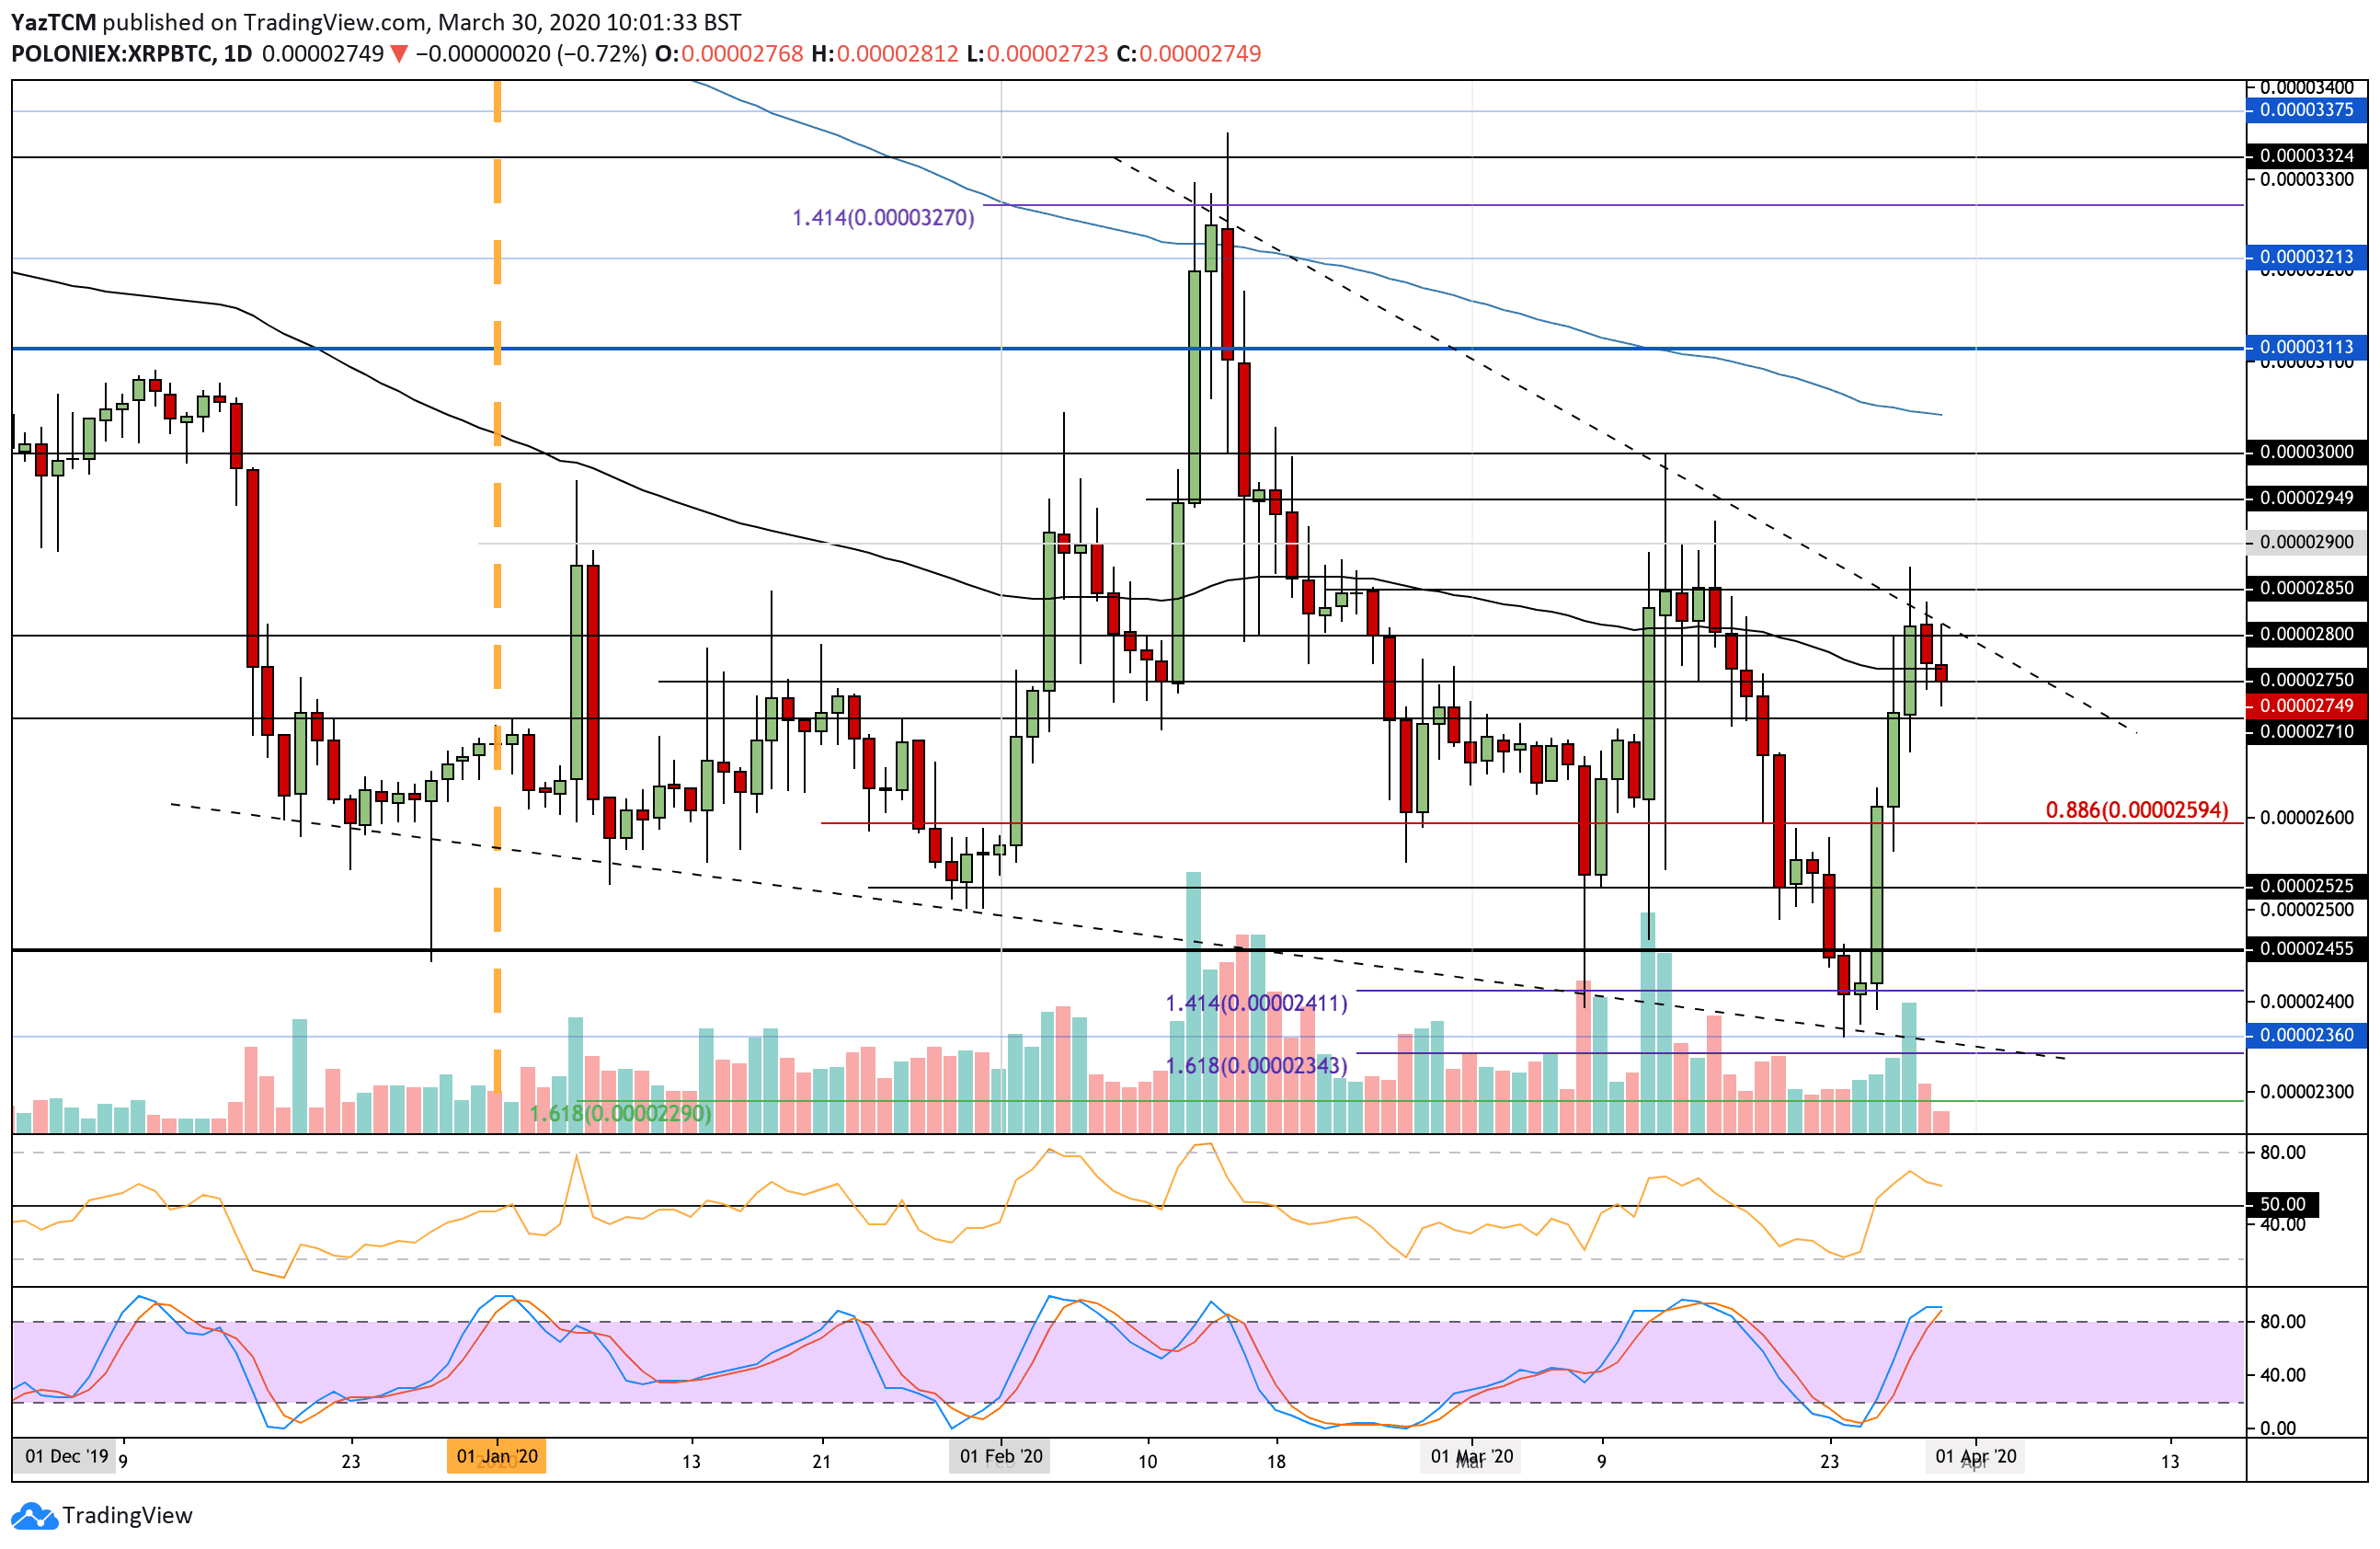
Support: 2750 SAT, $2710 SAT, 2650 SAT.
Resistance: 2800 SAT, 2850 SAT, 2900 SAT.
Since our last analysis, XRP continued to drop after reversing at the $0.191 (bearish .618 Fib Retracement) resistance. It found support at the previous rising trend line at around $0.16, which allowed XRP to rebound higher to break above $0.171.
The coin must now break resistance at $0.191 again for it to be able to climb above $0.2 next. However, this latest price increase is largely due to Bitcoin going above $6,200 this morning.
From above, resistance is expected at $0.182 and $0.191 (bearish .618 Fib Retracement). Above this, resistance lies at $0.2, $0.217 (100-days EMA), and $0.235.
Toward the downside, the first two levels of support are found at $0.171 and then the rising trend line at $0.16. Beneath this, support lies at $0.156 and $0.147.
The RSI bounced back above the 50 level as the buyers resume control over the market momentum. If it can continue higher, it would show the bullish momentum increasing and should push XRP above $0.2.
Worryingly, the Stochastic RSI is in overbought territory, and a bearish crossover signal could send it lower. However, it will only happen if we see the crossover, and it can stay overbought for extended periods.
Against Bitcoin, XRP managed to climb above the 100-days EMA to reach as high as 2850 SAT. However, it went on to roll over and drop back beneath the 100-days EMA again to trade at 2750 SAT.
The cryptocurrency is also bound by a falling trend line and must close above it to see some affirmative action over the next few weeks.
Above the 100-days EMA, resistance is located at 2800 SAT (falling trend line), 2850 SAT, 2900 SAT, and 2950 SAT.
Toward the downside, the first level of support lies at 2750 SAT. Beneath this, support lies at 2710 SAT, 2650 SAT, 2600 SAT, and 2525 SAT.
The RSI is still well above the 50 level as the bulls maintain control over the market momentum. However, if it starts to drop back toward 50, XRP might end up falling beneath 2710 SAT. Similarly, the Stochastic RSI is also primed for a bearish crossover signal that could send the market lower.