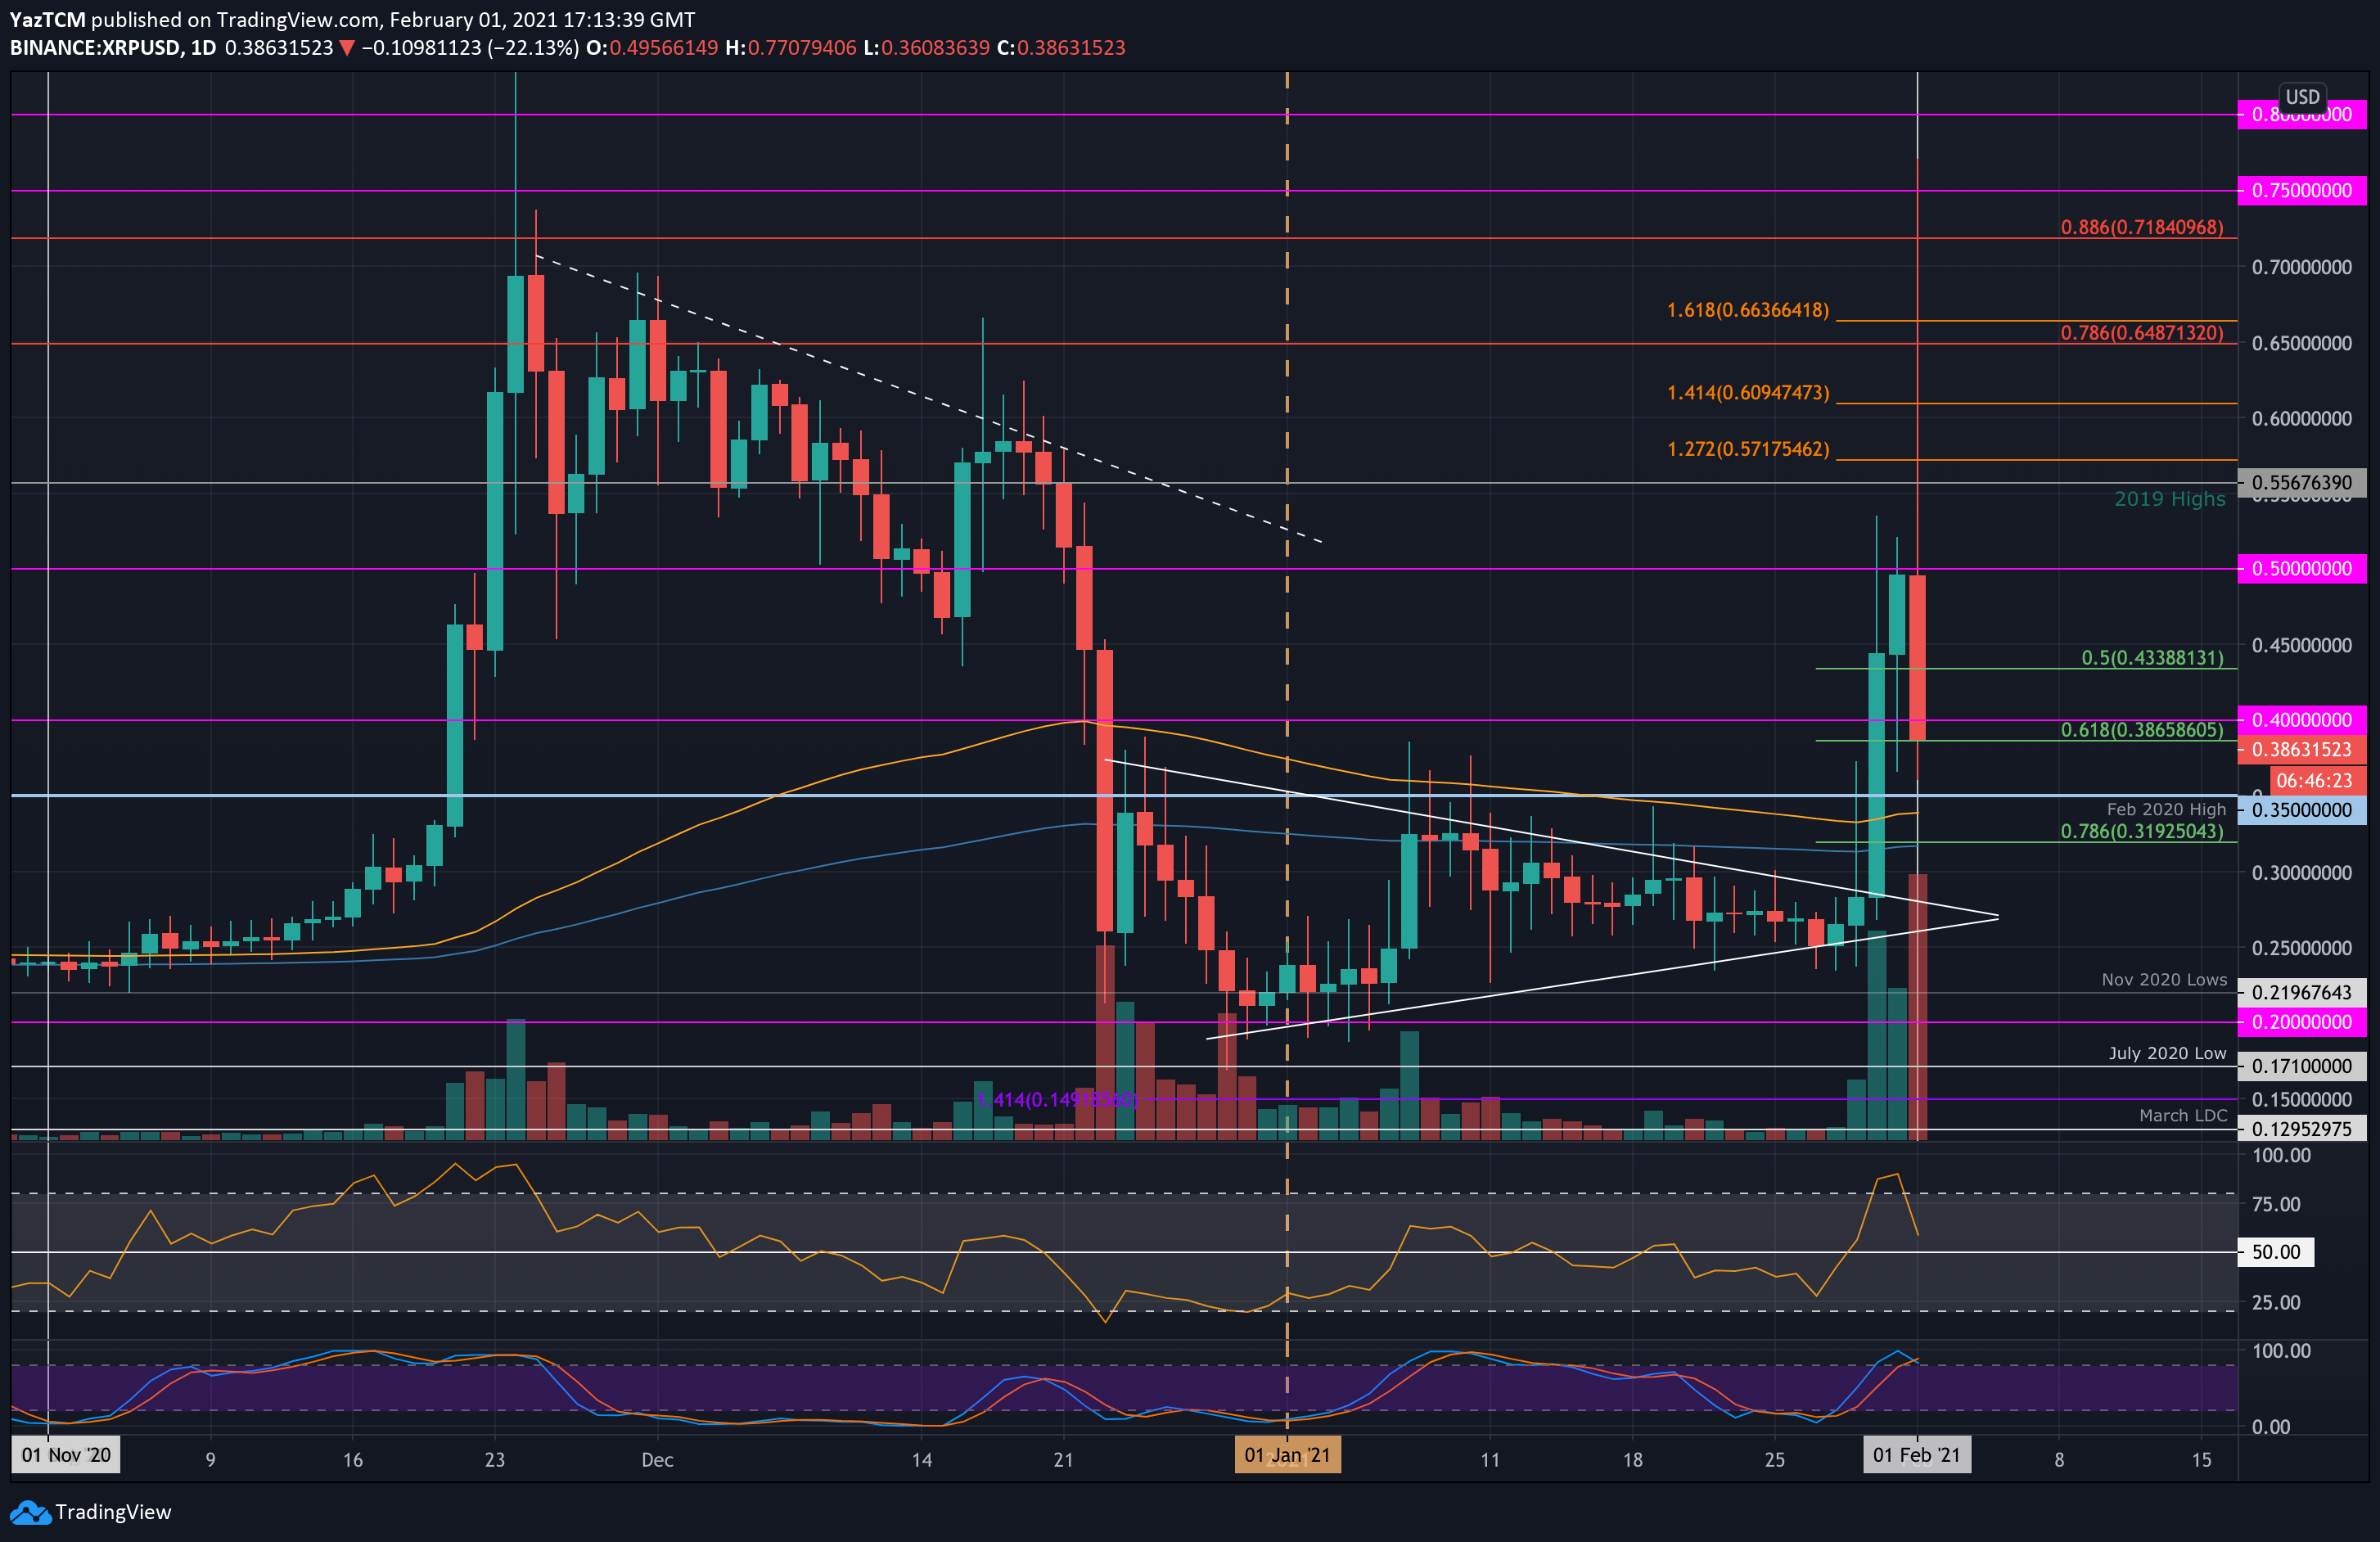
XRP/USD Daily Chart. Source: TradingView
Key Support Levels: $0.35, $0.319, $0.30.
Key Resistance Levels: $0.4, $0.45, $0.5.
XRP managed to break the previous consolidation phase over the weekend as it penetrated above a symmetrical triangle pattern. The coin continued to climb after breaking to close the daily candle at $0.5 yesterday.
Today, XRP started the day by rising 50% to reach as high as $0.77, in what is suspected to be an organized pump. However, because of that reason, the dump wasn’t late to come.
XRP quickly came back down and eventually plummeted beneath the daily opening price of $0.5, recording a low of 35 cents an hour ago. As of writing these lines, the coin bounced slightly towards $0.4 (.618 Fib).
Looking ahead, the first resistance lies at $0.40. This is followed by $0.45, $0.5, and $0.56 (2019 High). Further above lies $0.571 (1.272 Fib Extension), $0.609 (1.414 Fib Extension), and $0.75 (today’s high).
On the other side, the first support lies at $0.35 (Feb 2020 High, today’s low). This is followed by $0.319 (.786 Fib & 200-days EMA), $0.3, and $0.24.
The daily RSI has dropped from extremely overbought conditions as the bullish momentum faded away.
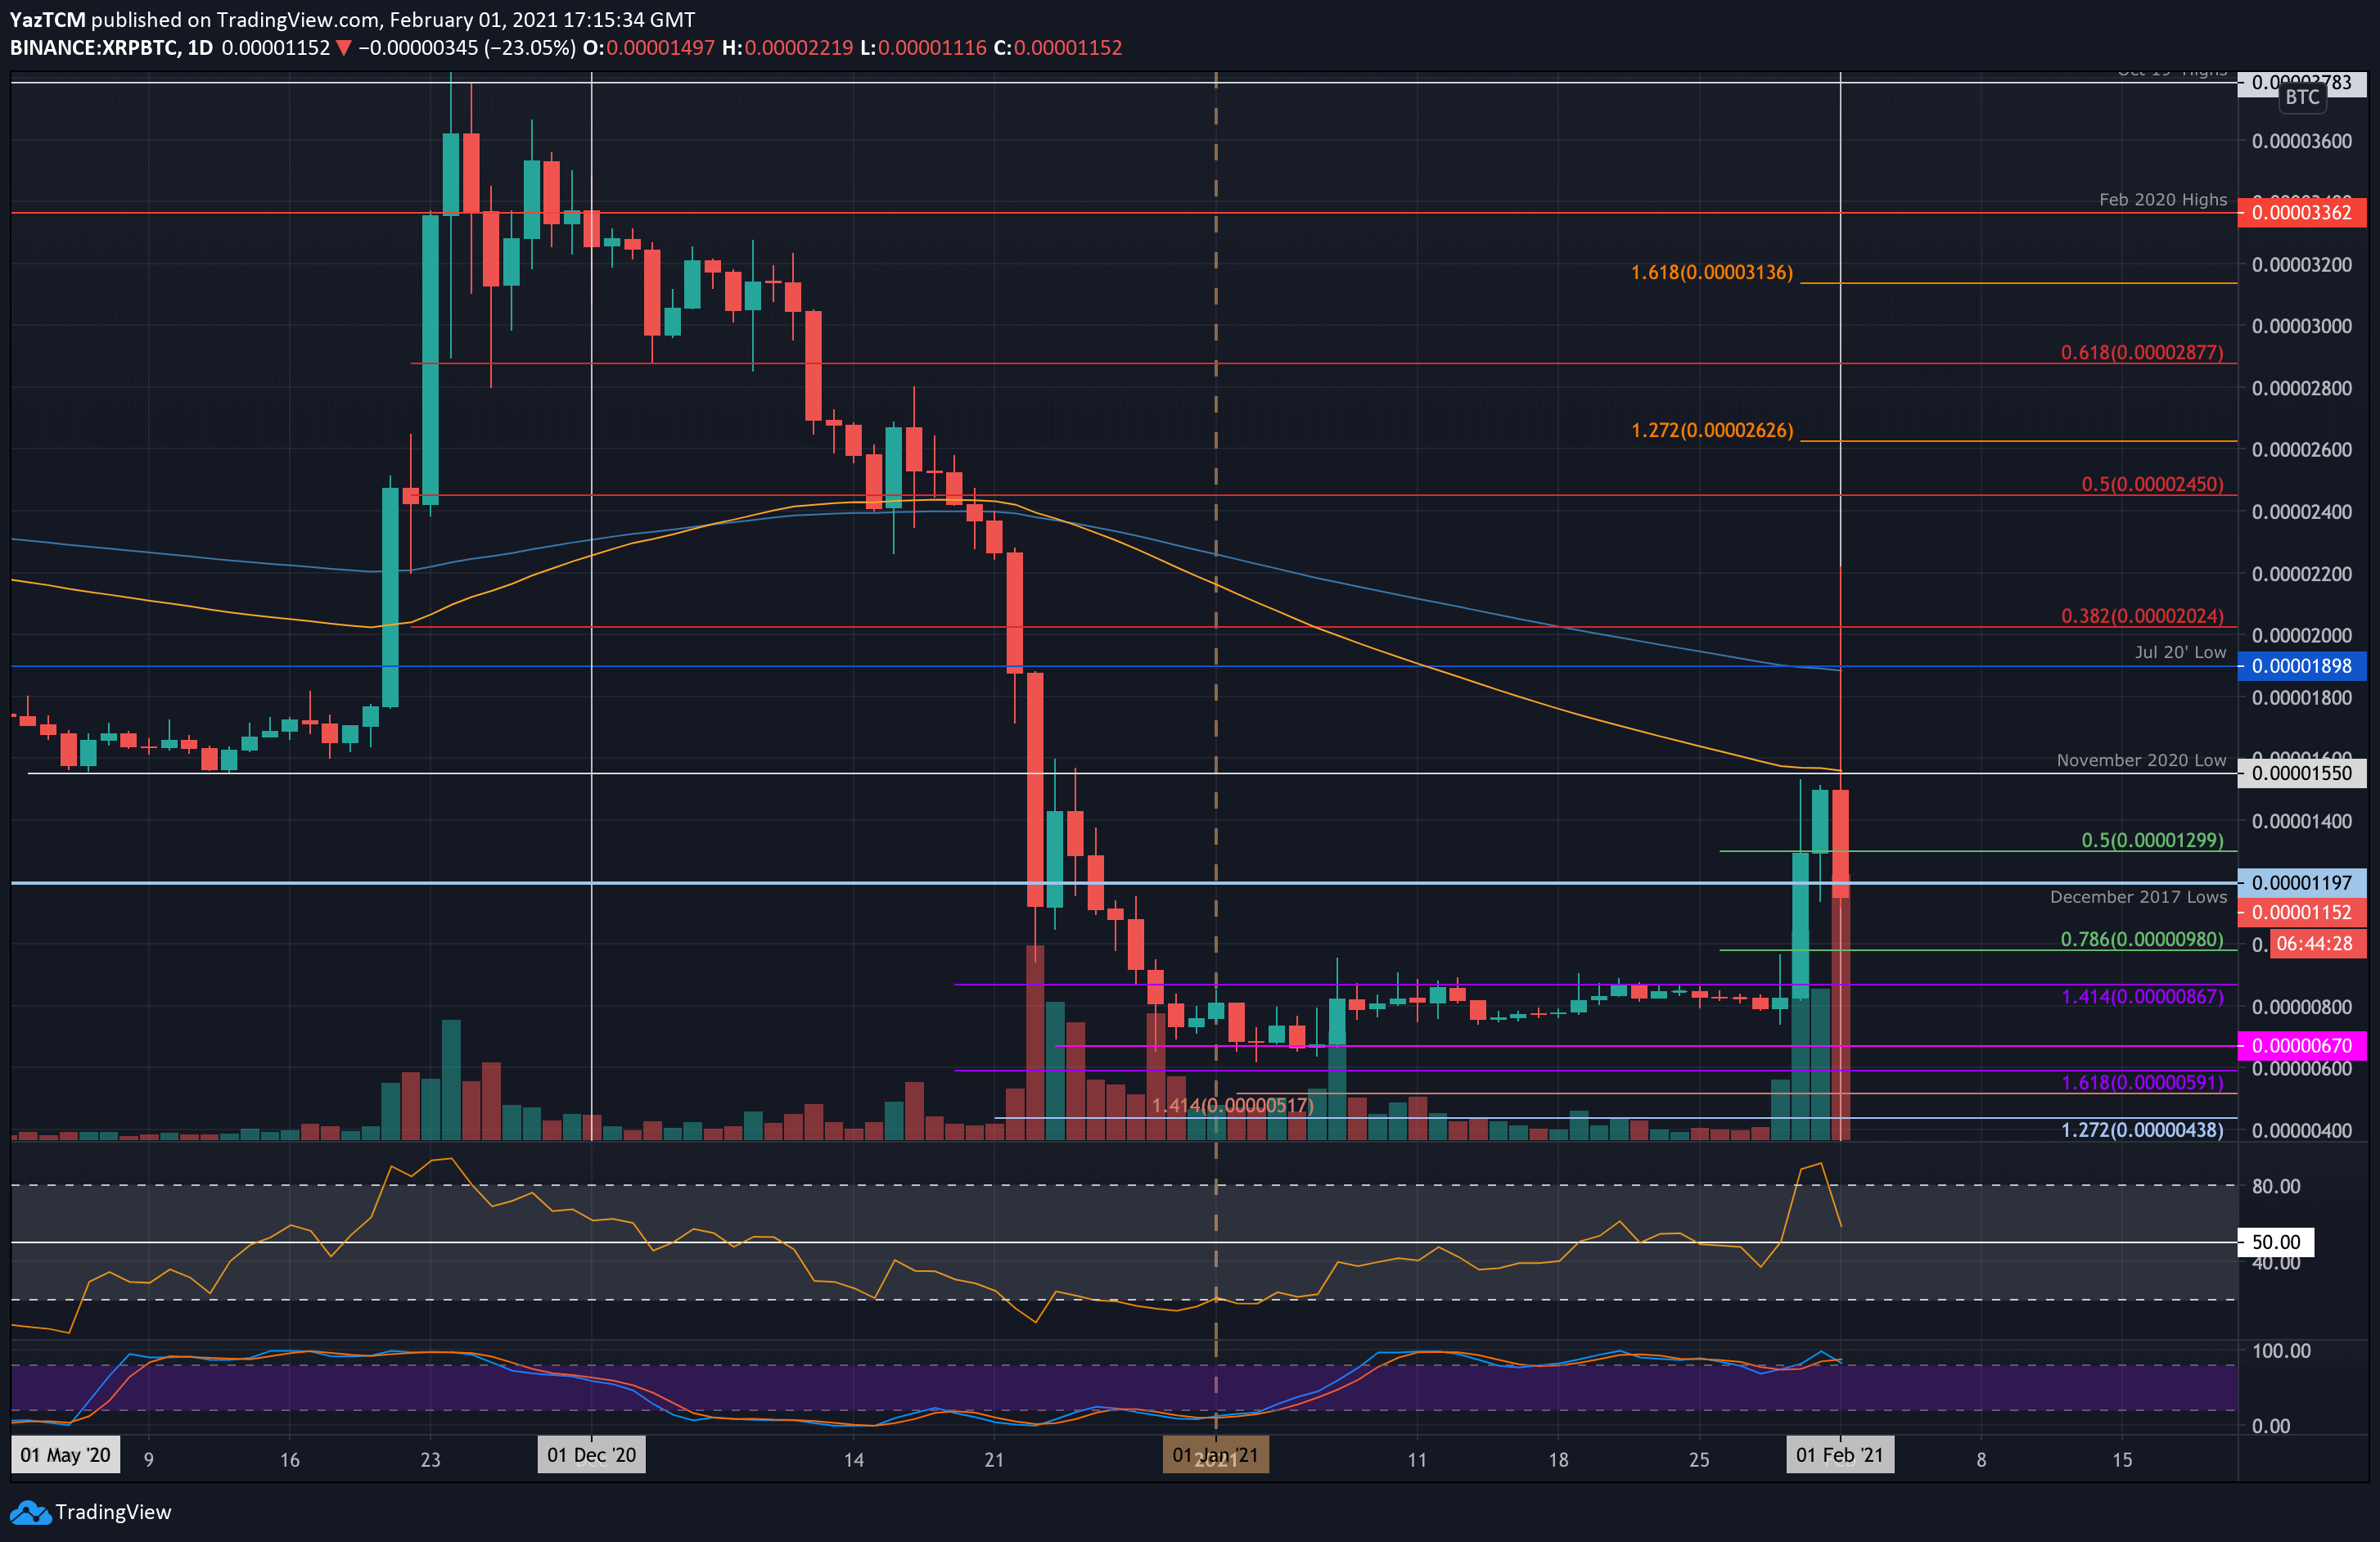
Key Support Levels: 1000 SAT, 980 SAT, 867 SAT.
Key Resistance Levels: 1200 SAT, 1550 SAT, 1900, 2200 SAT.
Against Bitcoin, XRP had also seen a pump and dump scheme. It was trading in a narrow range for most of January between 670 SAT support and 867 SAT resistance. This range was penetrated over the weekend as XRP headed into 1500 SAT.
Today, XRP began the day by surging higher from 1500 SAT as it broke above the 200-day EMA at 1900 SAT to reach as high as 2200 SAT. There, XRP quickly retraced as it dropped beneath today’s opening price.
XRP-BTC Short Term Price Prediction
Moving forward, the first support lies at 1000 SAT. This level is followed by 980 SAT (.786 Fib), 867 SAT (previous resistance), 800 SAT, and 670 SAT.
On the other side, the first resistance now lies at 1200 SAT (December 2017 low). This is followed by 1550 SAT (November 2020 low & 100-day EMA), 1900 SAT (July 20 Low), and 2025 SAT (bearish .382 Fib, along with today’s high).
Likewise, the daily RSI came down quickly from extremely overbought conditions, indicating that the bullish momentum faded quickly.