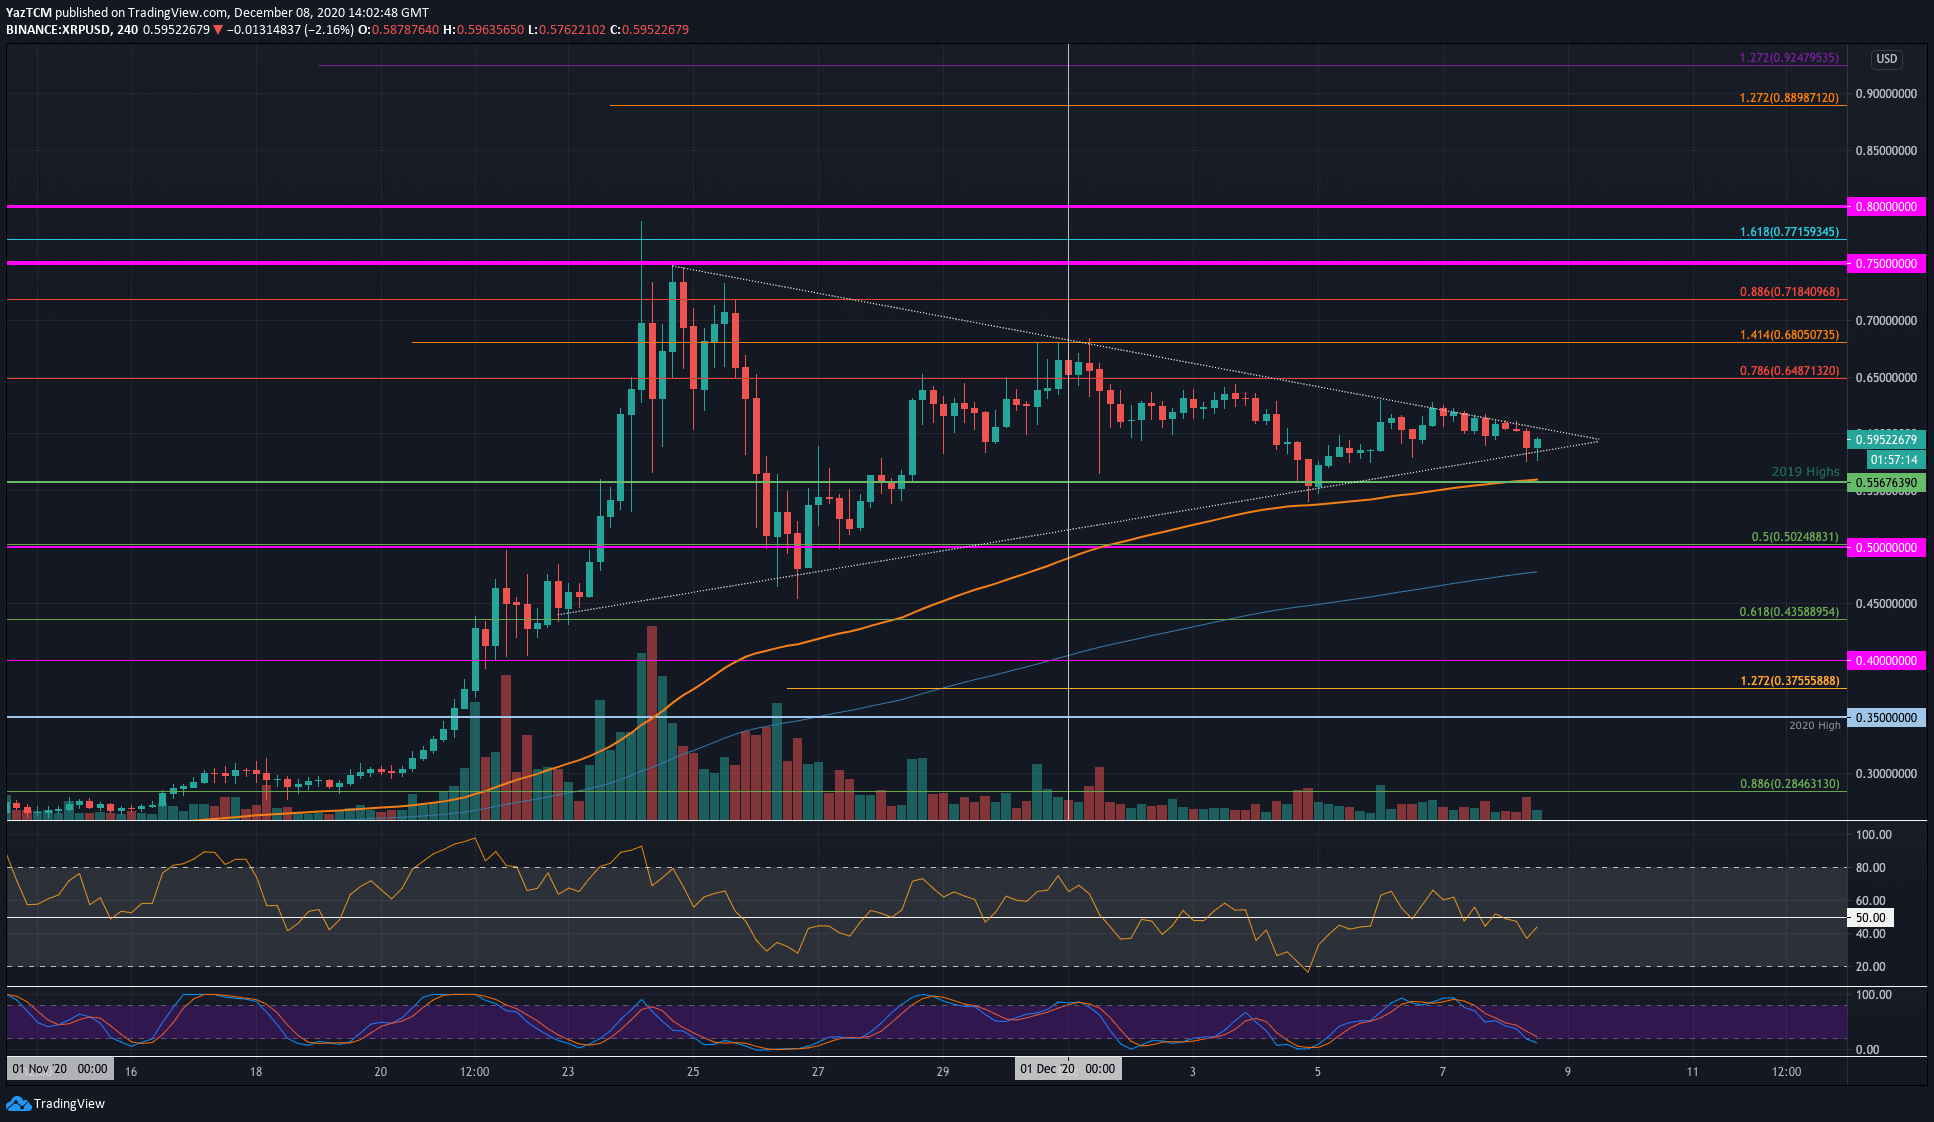
XRP/USD 4HR Chart. Source: TradingView
Key Support Levels: $0.556, $0.5, $0.45.
Key Resistance Levels: $0.648, $0.68, $0.70.
XRP has been trapped inside a symmetrical triangle since the last week of November. The coin bounced from the support at the lower boundary of the weekend but has since struggled to break the resistance at the upper boundary.
The coin is quickly approaching the apex of the triangle where we can expect a breakout in either direction. This could happen over the next few days.
Looking ahead, if the bulls break toward the upside of the triangle, the first level of resistance lies at $0.648 (bearish .786 Fib Retracement). This is followed by $0.68 (1.414 Fib Extension), $0.70, $0.718 (bearish .886 Fib Retracement), and $0.75.
On the other side, if the sellers break beneath the lower boundary of the triangle, the first level of support lies at $0.556 (2019 Highs). This is followed by $0.5 (.5 Fib), $0.45, $0.454 (.618 Fib), and $0.4.
The 4HR RSI recently slipped beneath the mid-line, which indicates that the momentum is starting to shift in the bearish favor.
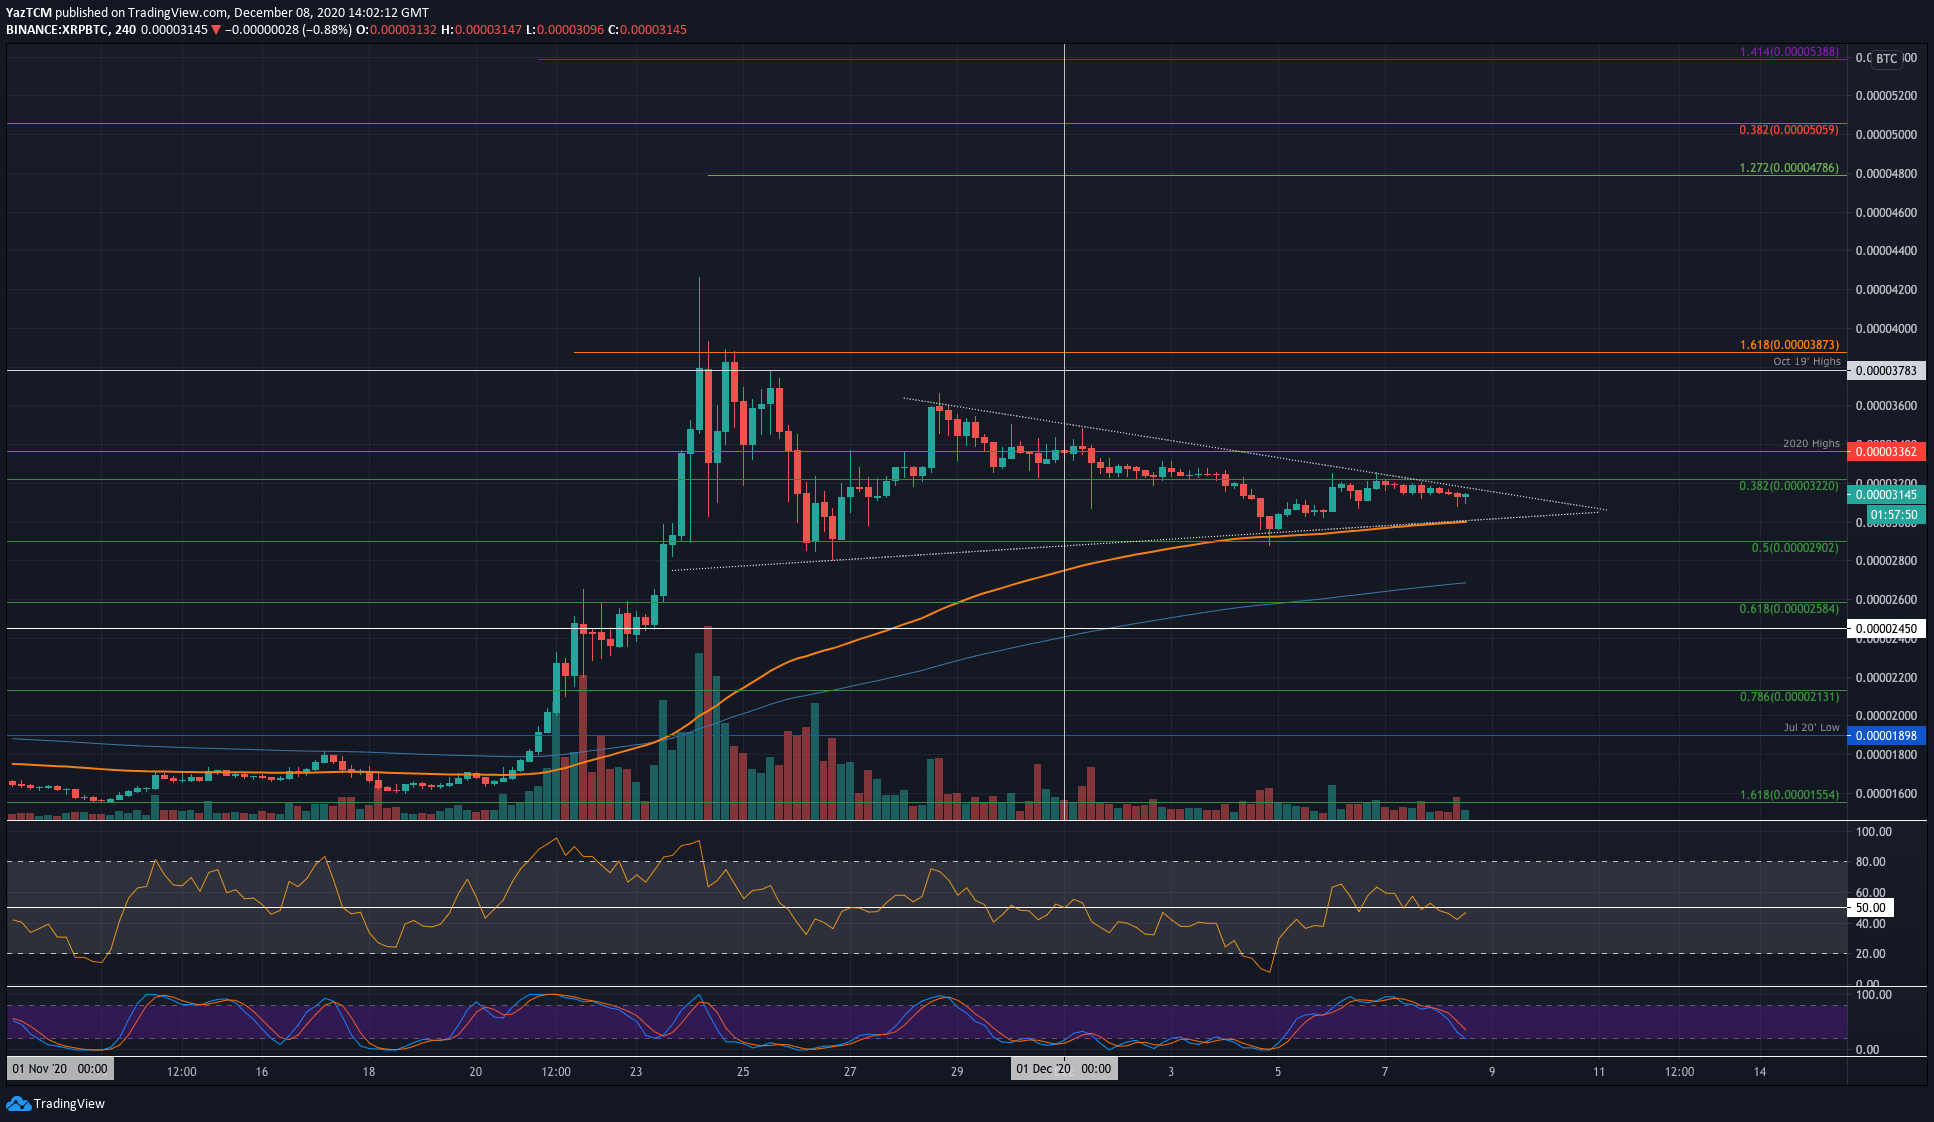
Key Support Levels: 3000 SAT, 2900 SAT, 2585 SAT.
Key Resistance Levels: 3360 SAT, 3600 SAT, 3785 SAT.
Against Bitcoin, XRP remains trapped inside its own symmetrical triangle pattern. The coin is currently trading at the upper boundary of the triangle as the market trades in a period of indecision about what to do next.
A breakout to the upside would see XRP reaching the November highs again around 4000 SAT. Alternatively, a break toward the downside might cause XRP to head back beneath 2000 SAT.
Looking ahead, if the bulls break above the triangle, the first level of resistance lies at 3360 SAT. Above this, resistance lies at 3600 SAT, 3784 SAT, and 4000 SAT.
On the other side, the first level of support lies at the lower boundary of the triangle – around 3000 SAT. Beneath this, support lies at 2900 SAT (.5 Fib), 2585 SAT (.618 Fib), and 2450 SAT.
The Stochastic RSI is quickly approahcing oversold conditions and a bullish crossover could help XRP break above the triangle.