XRP/USD:
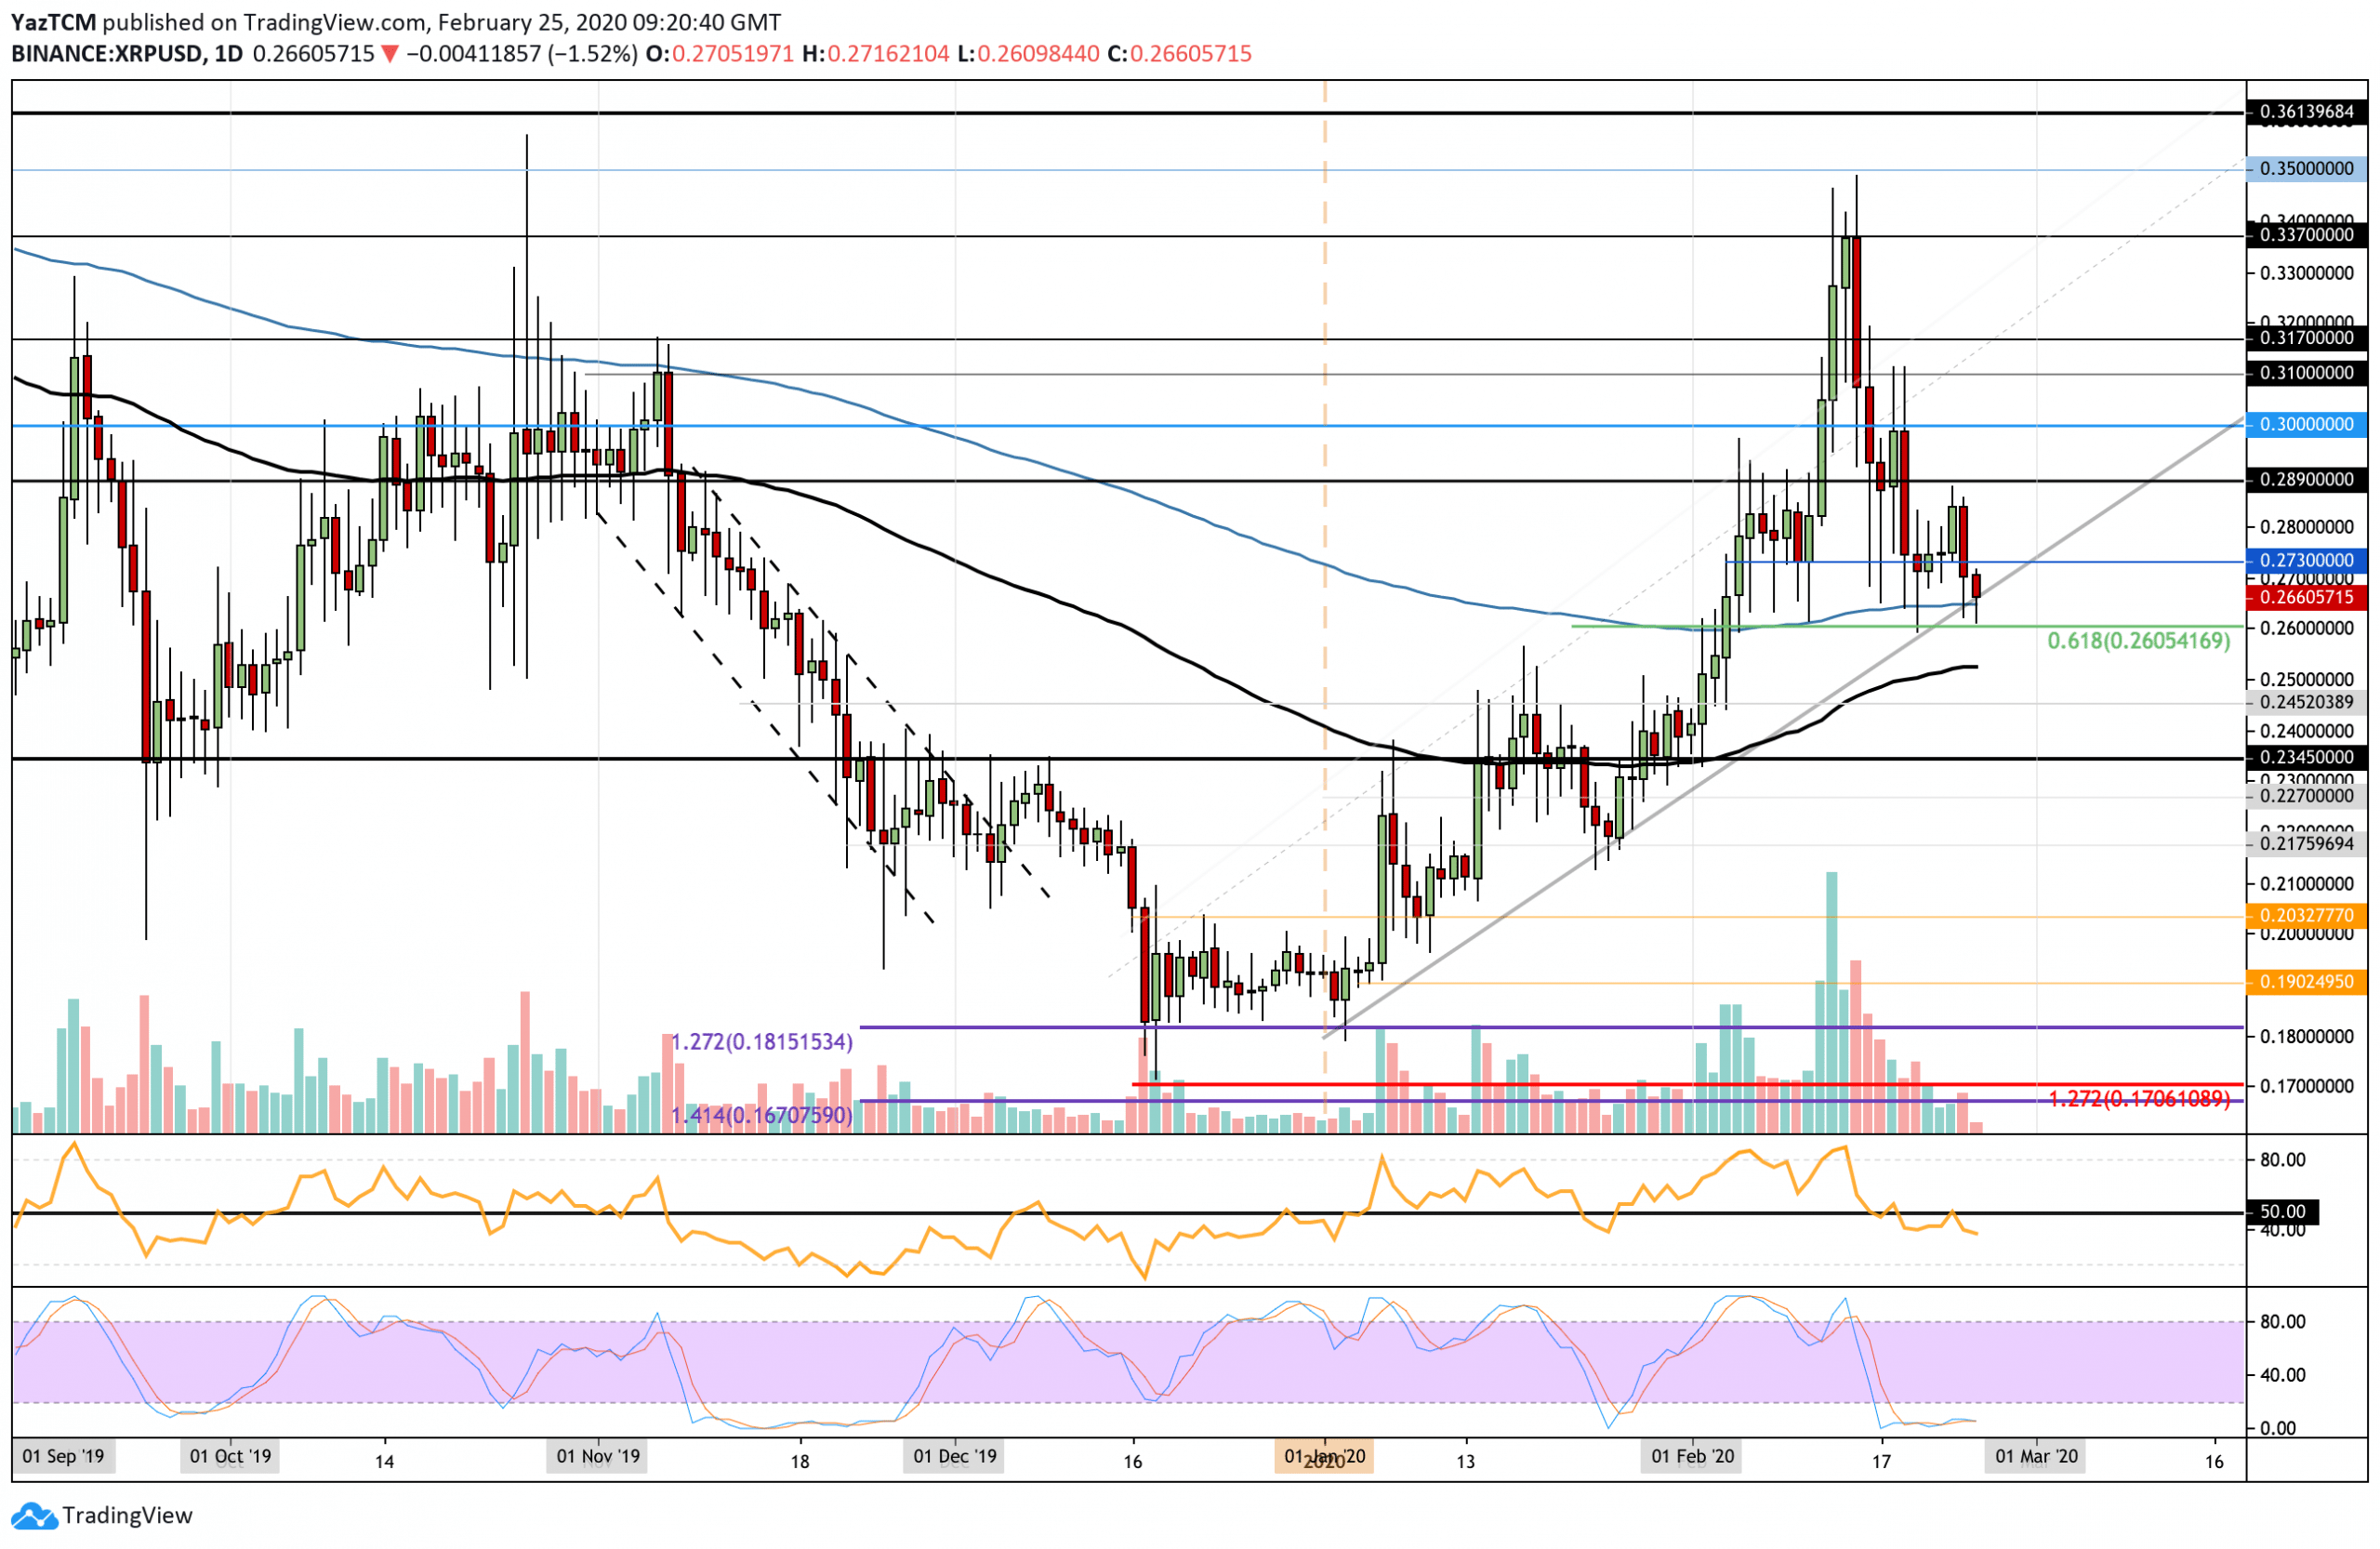
Support: $0.26, $0.25, $0.245.
Resistance: $0.27, $0.289, $0.3.
XRP/BTC:
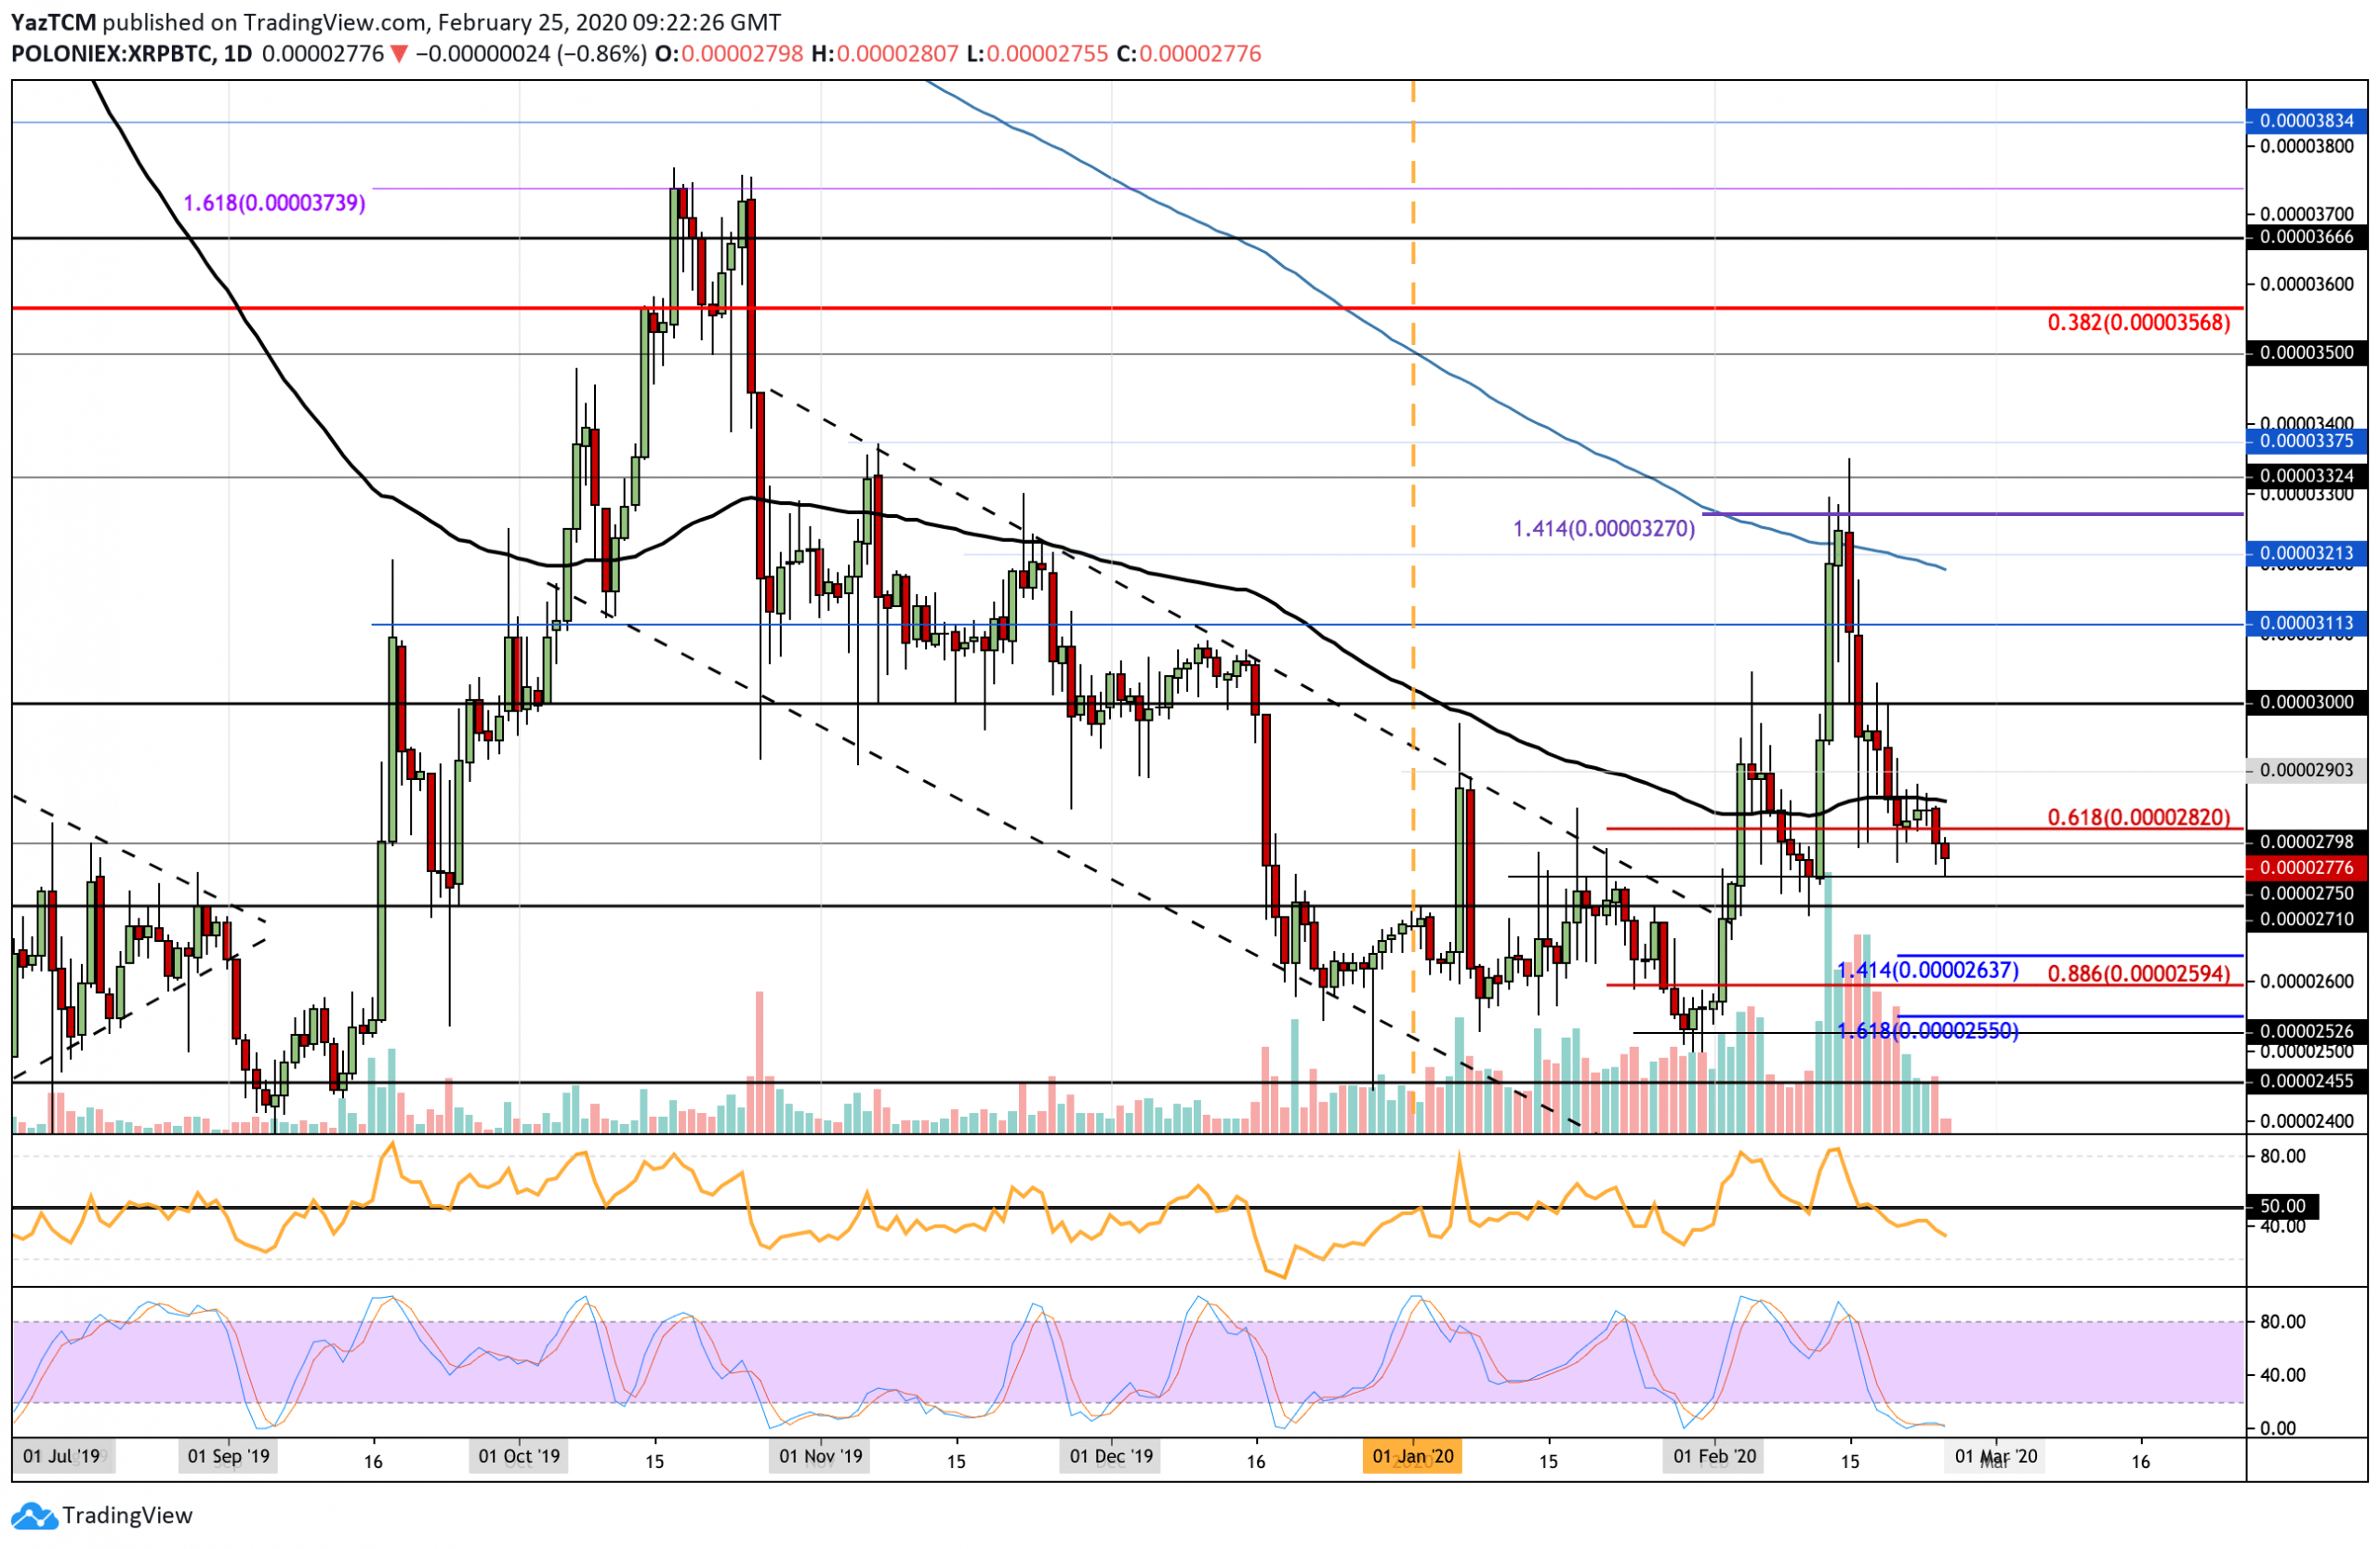
Support: 2750 SAT, 2710 SAT, 2640 SAT.
Resistance: 2800 SAT, 2900 SAT, 3000 SAT.
Since our last analysis, XRP climbed higher but was unable to overcome the resistance at $0.289. It then rolled over and broke beneath the $0.27 support to reach the 200-days EMA.
It has also spiked lower into the short term .618 Fib Retracement at $0.26, which will be the next support if the 200-days EMA is broken.
The market remains neutral, but a break beneath $0.26 will create a lower low and could turn XRP bearish.
If the sellers break beneath the 200-days EMA and the subsequent support at $0.26, additional support lies at $0.25, provided by the 100-days EMA. Beneath this, support is found at $0.245 and $0.234.
Alternatively, if the buyers bounce from the 200-days EMA, the first level of resistance is at $0.27. Above this, resistance lies at $0.289 and $0.30.
The RSI has dipped beneath the 50 level to confirm the bearish momentum within the market. Traders are now waiting for the Stochastic RSI to produce a bullish crossover signal to show that the buyers are ready to start pushing higher again.
Against Bitcoin, XRP was unable to overcome resistance at the 100-days EMA, which caused it to roll over beneath the support at 2800 SAT.
It continued to fall but recently found support at 2750 SAT. If XRP breaks beneath 2700 SAT, it will be in danger of turning bearish.
Beneath 2750 SAT, the first level of support lies at 2710 SAT. Beneath this, support is expected at 2640 SAT and 2600 SAT.
Alternatively, if the bulls can rebound from 2750 SAT, resistance lies at 2800 SAT. Above this, resistance is located at the 100-days EMA and then at 2900 SAT and 3000 SAT.
The RSI has dropped further beneath 50 as the bearish pressure increases. The Stochastic RSI is in extremely oversold conditions and is primed for a bullish crossover signal at some point soon.