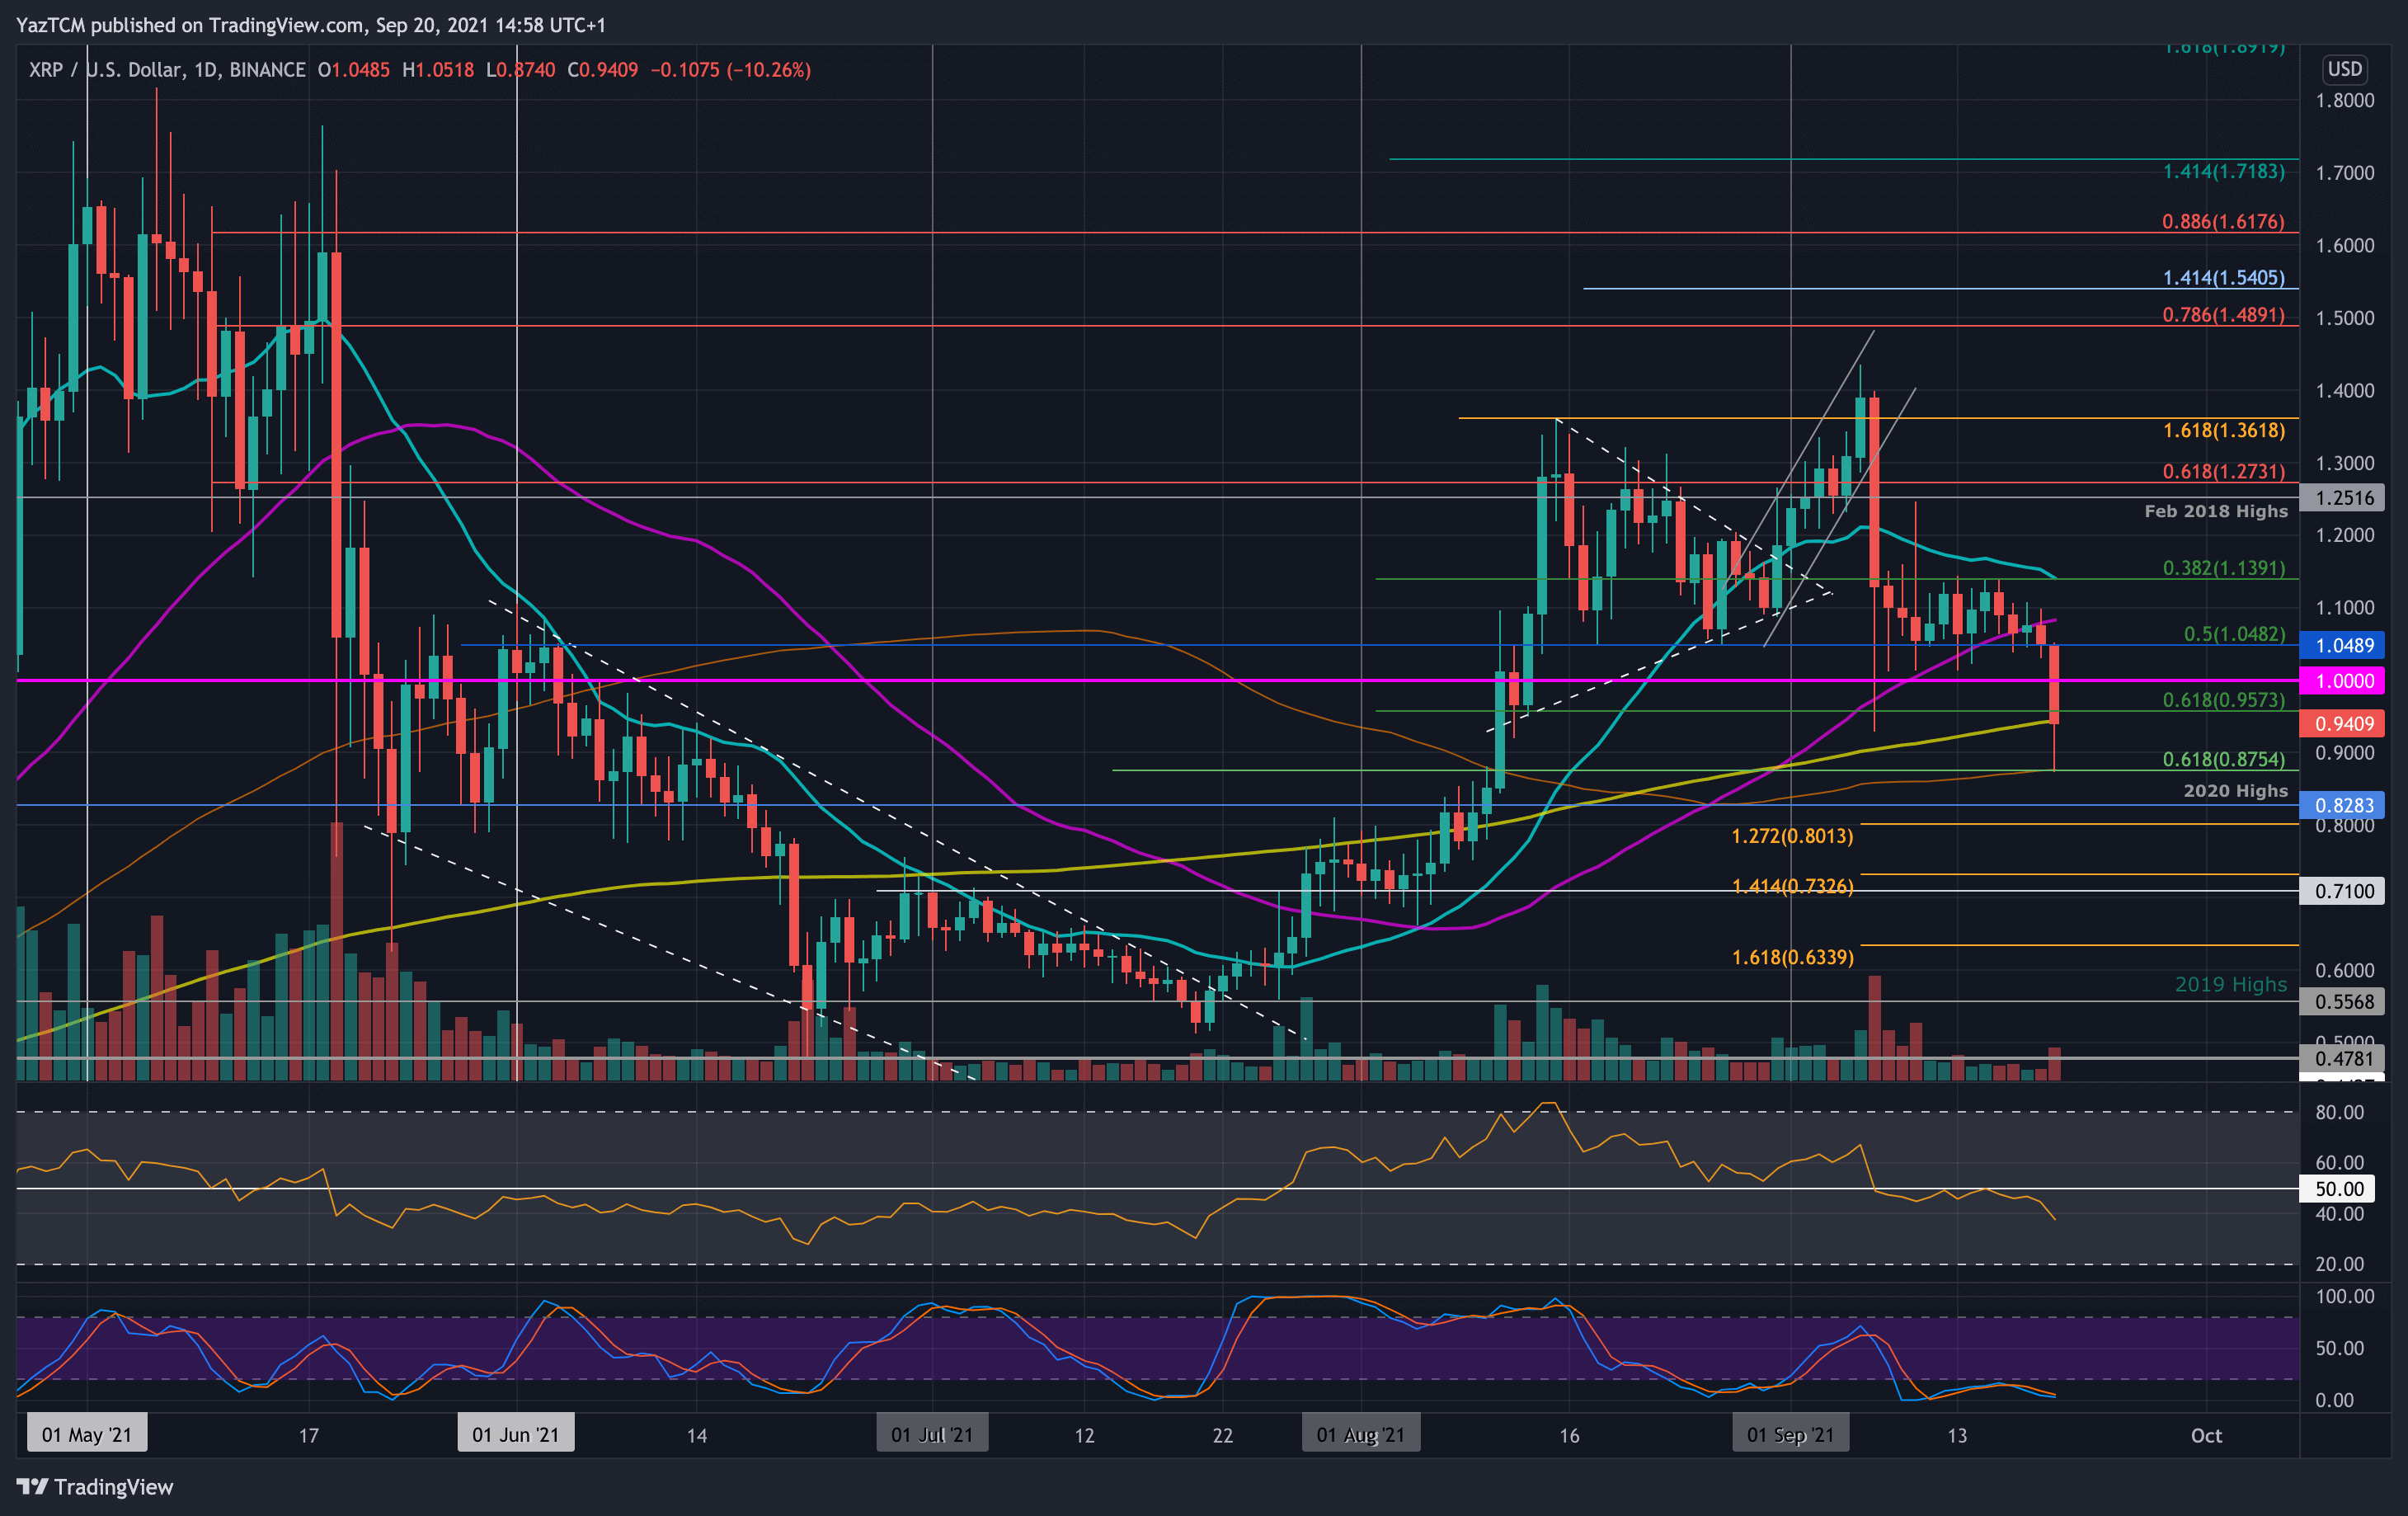
XRP/USD Daily Chart. Source: TradingView.
Key Support Levels: $0.875, $0.8282, $0.8.
Key Resistance Levels: $1.00, $1.05, $1.14.
Since the early September flash crash, when XRP fell as low as $0.95 from a high of $1.40, XRP had established a solid range between $1.14 and support at $1.05 (.5 Fib Retracement).
Over the weekend, the cryptocurrency fell beneath the 50-day MA and tested the $1.05 support again. Today, the 12% price fall caused XRP to break support at $1.05 as it went on to crash beneath $1.00 and reach as low as $0.875 (.618 Fib & 100-day MA).
There, the combined support allowed XRP to bounce to the current $0.94 level as it sits above the 200-day MA.
Looking ahead, if the sellers break the 200-day MA, the first support lies at $0.875 (.618 Fib & 100-day MA). This is followed by $0.8282 (2020 high), $0.8 (downside 1.272 Fib Extension), and $0.732 (downside 1.414 Fib Extension).
On the other side, the first resistance lies at $1. This is followed by $1.05, $1.14 (upper boundary of previous range & 20-day MA), and $1.25 (Feb 2018 highs).
The RSI has now tumbled beneath the midline, indicating the bears are in complete control of the market momentum.
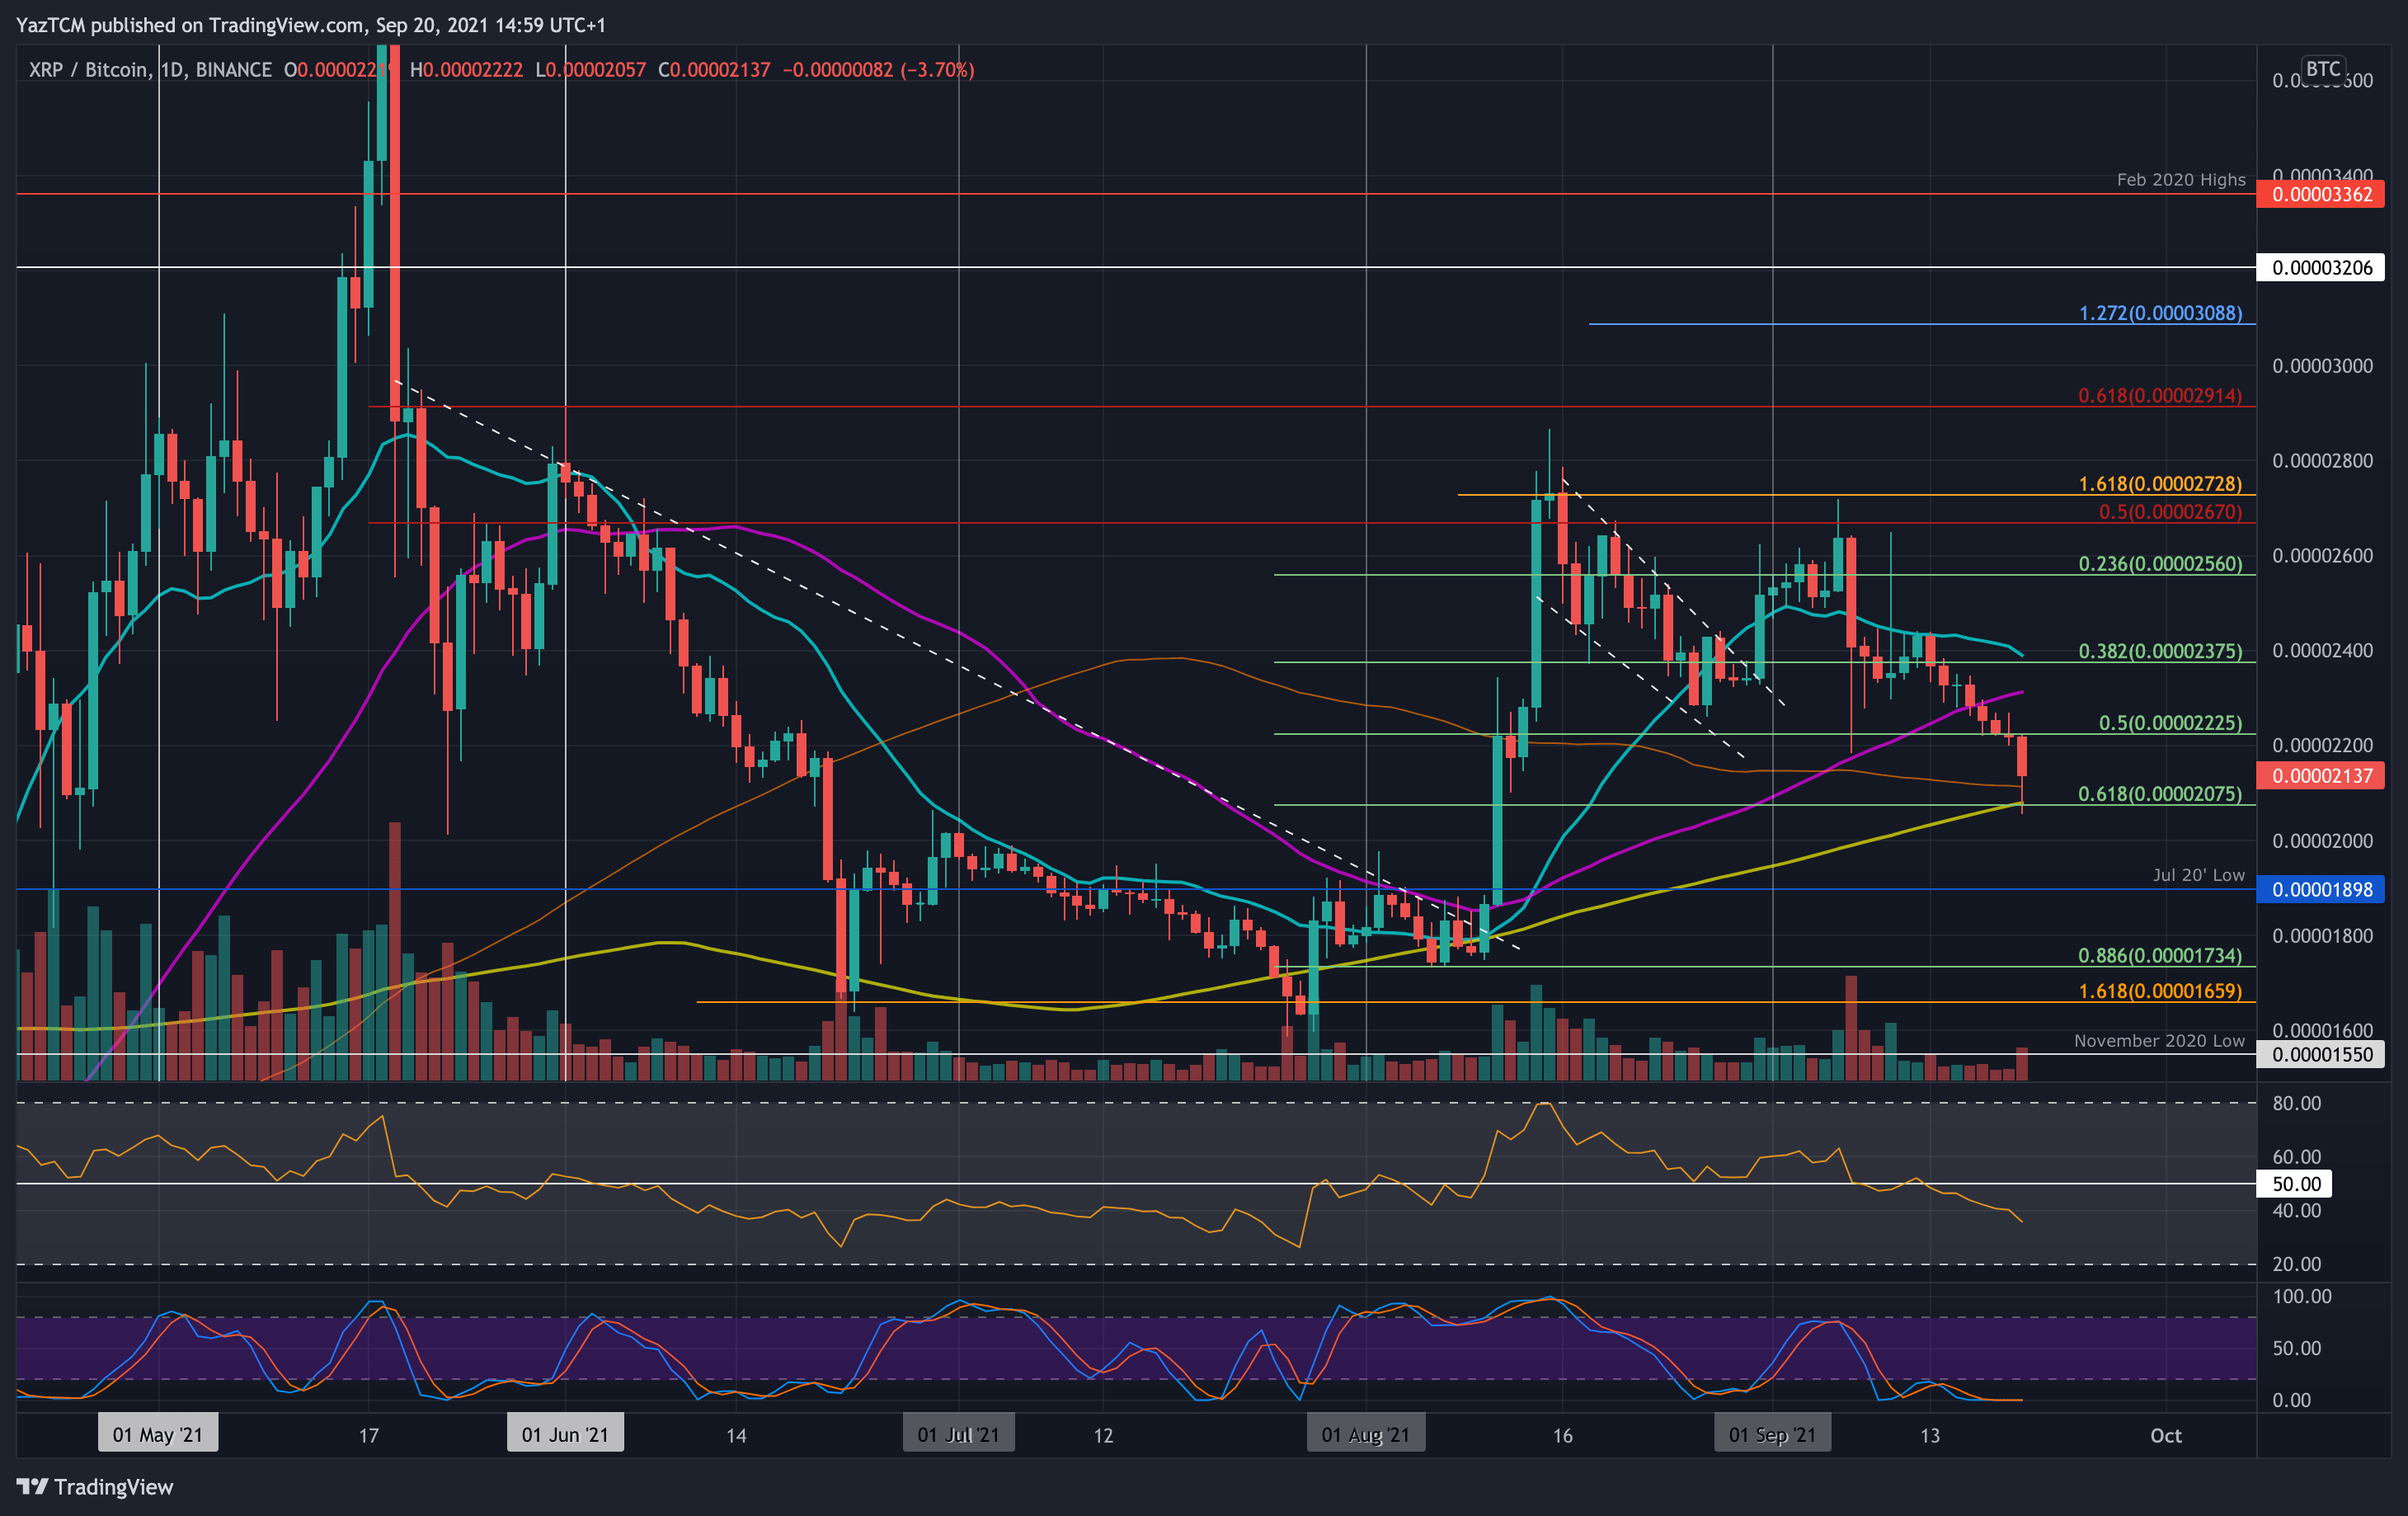
Key Support Levels: 2075 SAT, 2000 SAT, 1900 SAT.
Key Resistance Levels: 2225 SAT, 2320 SAT, 2400 SAT.
XRP is also struggling heavily against BTC. Last week, it fell beneath the 50-day MA at around 2300 SAT to find the support at 2225 SAT (.5 Fib Retracement) over the weekend.
The market held this support until today when XRP collapsed beneath 2200 SAT to reach as low as 2075 SAT (.618 Fib & 200-day MA). It has since bounced from there as it trades around 2140 SAT.
Looking ahead, the first support lies at 2075 SAT (.618 Fib & 200-day MA). This is followed by 2000 SAT, 1900 SAT (July 2020 low), and 1735 SAT (.886 Fib).
On the other side, the first resistance lies at 2225 SAT. This is followed by 2320 SAT (50-day MA), 2400 SAT (20-day MA), and 2600 SAT.
The RSI is also beneath the midline here, indicating that the sellers are controlling the momentum.