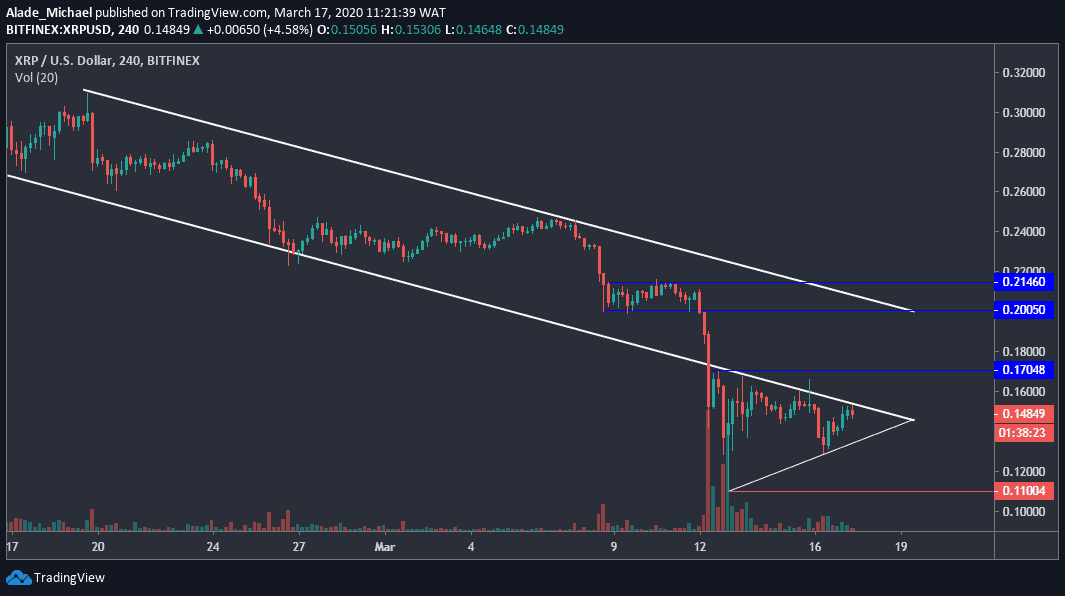
Key Resistance Levels: $0.17, $0.20
Key Support Levels: $0.128, $0.11
Over the past few days, the entire crypto market has seen a moderate recovery from last week’s drop which was caused by Bitcoin’s crash. While Ripple is undergoing consolidation, the price has increased by 8% over the past 24-hours, which reveals that buyers are beginning to show interest.
As of now, XRP is trading for $0.1485 per coin. Although, the buying pressure now appeared weak after touching the channel support-turned resistance (around $0.15) that got broken on March 12.
Looking at the previous lows, established at $0.11 (last week’s low) and $0.128 (yesterday’s low), we can see that Ripple has formed a symmetrical triangle on the 4-hours chart with the support of the channel’s lower boundary.
A break at both sides would determine the next actual direction of the market.
If we consider a break-up, Ripple’s next target would be $0.17 resistance, which is the first blue line inside the falling channel.
The next resistance above here is $0.20, around the upper boundary of the channel. If buyers push further to reclaim the $0.215 resistance, a fresh increase may start for Ripple.
In case of a triangle break-down, the first level of support to watch is $0.128 – yesterday’s low, followed by last week’s low of $.11, which is marked red on the price chart. Ripple may witness severe loss if this support breaks.
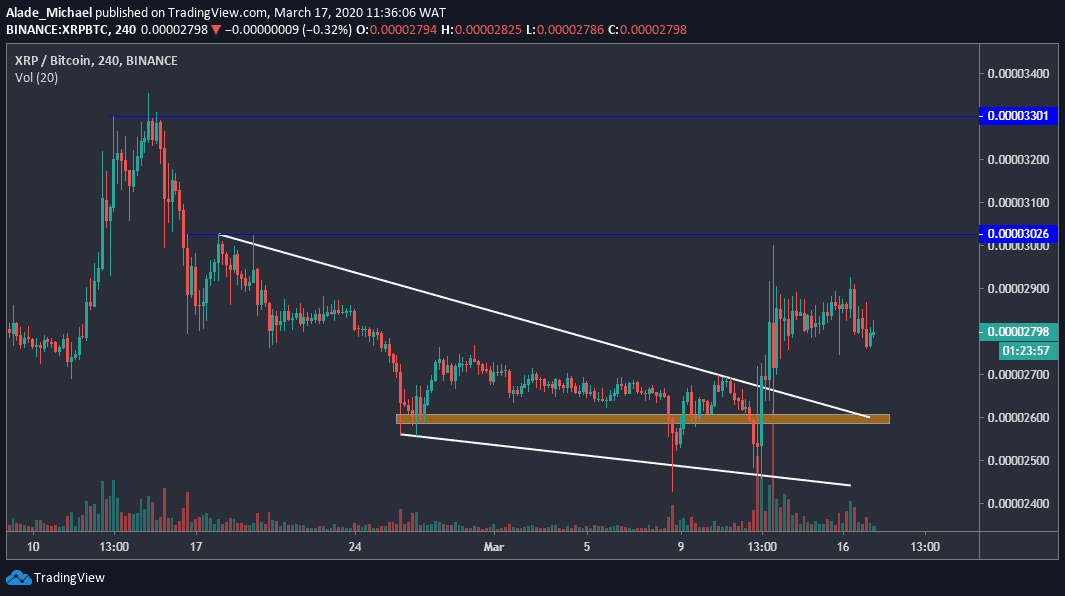
Key Resistance Levels: 2900 SAT, 3000 SAT, 3300 SAT
Key Support Levels: 2600 SAT, 2500 SAT, $2400 SAT
A few days ago, Ripple broke out from a wedge pattern after subjecting price actions in a 3-week bearish trend. After reaching 3000 SAT level, the price dropped and remained in a consolidation mode.
Following further rejection at 2900 SAT level yesterday, Ripple is now trading around 2798 SAT level against the Bitcoin. Though, the price is currently pulling towards the 2700 SAT level. Still, the market is subdued with choppy price actions.
Apart from the minor resistance around 2900 SAT level, Ripple’s major resistance lies at 3000 SAT – which is the initial blue line on the 4-hours chart. A successful breach above this could initiate a move to 3300 SAT resistance in the next rally.
On the downside, there are lots of supports for Ripple, but the first important level for the bears is the 2600 SAT level – marked orange. Support below this level is 2500 SAT and 2400 SAT support area. The trading volume is still pretty down on the price chart.