Ripple’s XRP has seen a small 2% price increase over the past 24 hours of trading, bringing the current price for the coin up to around $0.4247 at press time. The cryptocurrency has now seen a 72% price increase over the past 30 trading days, allowing XRP to rise up out of its previous 2019 sideways trading range. Additionally, the asset even has seen a further 92% price rise over the past 90 trading days.
Ripple’s XRP remains ranked in 3rd place amongst the top coins by market cap value, as it currently holds a market cap of $17.84 billion, according to CoinMarketCap at the time of publication.
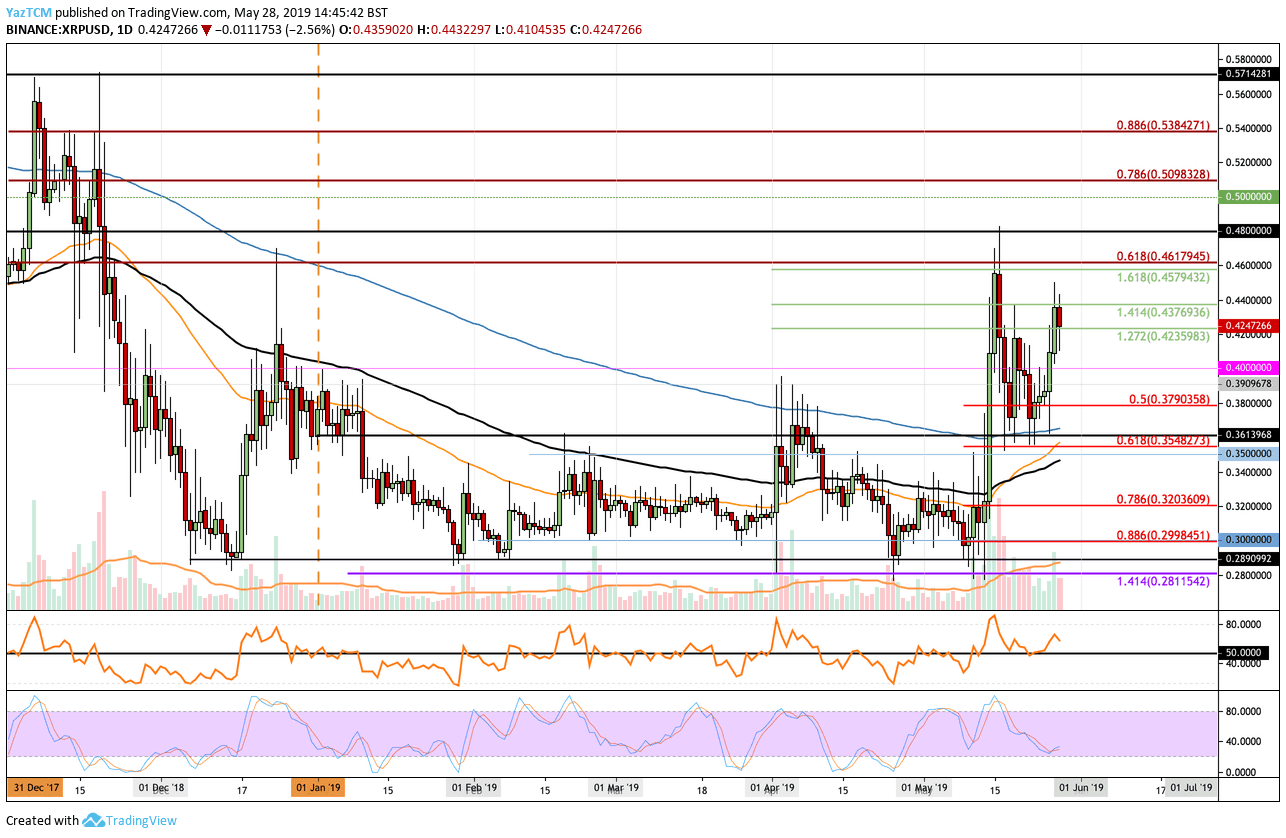
Looking at the XRP/USD 1-Day Chart:
- Since our previous XRP/USD analysis, we can see the market rebounded from our previously highlighted support at around $0.36, provided by the 200-day moving average. Ripple reached resistance at $0.4376, where the market fell slightly.
- From above: The nearest level of resistance now lies at $0.4337. If the bulls can break above this level, the next zone of resistance exists between $0.4580 and $0.4617. The resistance at $0.4617 is provided by a long-term bearish .618 Fibonacci Retracement level (marked in red) and therefore will require significant momentum to overcome. Above $0.47, further resistance sits at $0.48 and $0.50.
- From below: The nearest level of support now lies at $0.4235 and $0.42. Beneath $0.42, further support exists at $0.40, $0.39 and $0.379.
- Trading volume has remained consistently high during May 2019.
- The Stochastic RSI recently has reached oversold territory and is poised for a bullish crossover signal. Furthermore, the RSI recently rebounded from the 50 level which shows that the bulls still control market momentum.
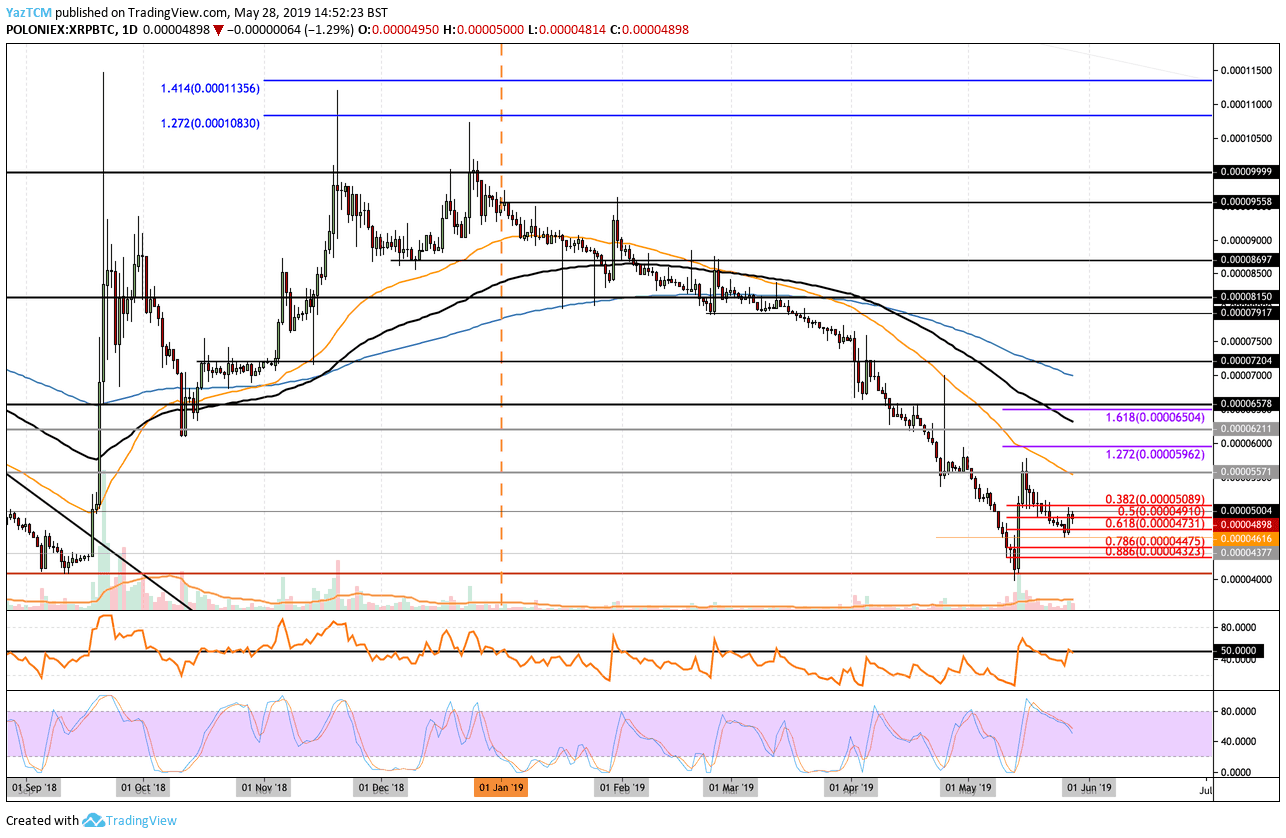
Looking at the XRP/BTC 1-Day Chart:
- Against Bitcoin, we can see XRP has continued to fall lower into the 4616 SAT region. The asset has been consistently falling all year until a rebound in mid-May 2019 which saw XRP climb back above 5000 SAT.
- From above: The nearest level of resistance now lies at 5000 SAT. Above this, further resistance can be found at 5100 SAT, 5571 SAT and 5962 SAT. If buyers continue above 6000 SAT, further resistance above can be found at 6211 SAT and 6500 SAT.
- From below: The nearest level of support now exists at 4731 SAT, 4616 SAT and 4475 SAT. If selling continues, we can expect further support at 4323 SAT, 4200 SAT and 4000 SAT.
- Trading volume has remained above the 2019 average during May 2019.
- The RSI recently returned toward the 50 level, indicating indecision within the market.
SPECIAL OFFER (Sponsored)
LIMITED OFFER 2024 for CryptoPotato readers at Bybit: Use this link to register and open a $500 BTC-USDT position on Bybit Exchange for free!
Disclaimer: Information found on CryptoPotato is those of writers quoted. It does not represent the opinions of CryptoPotato on whether to buy, sell, or hold any investments. You are advised to conduct your own research before making any investment decisions. Use provided information at your own risk. See Disclaimer for more information.
Cryptocurrency charts by TradingView.