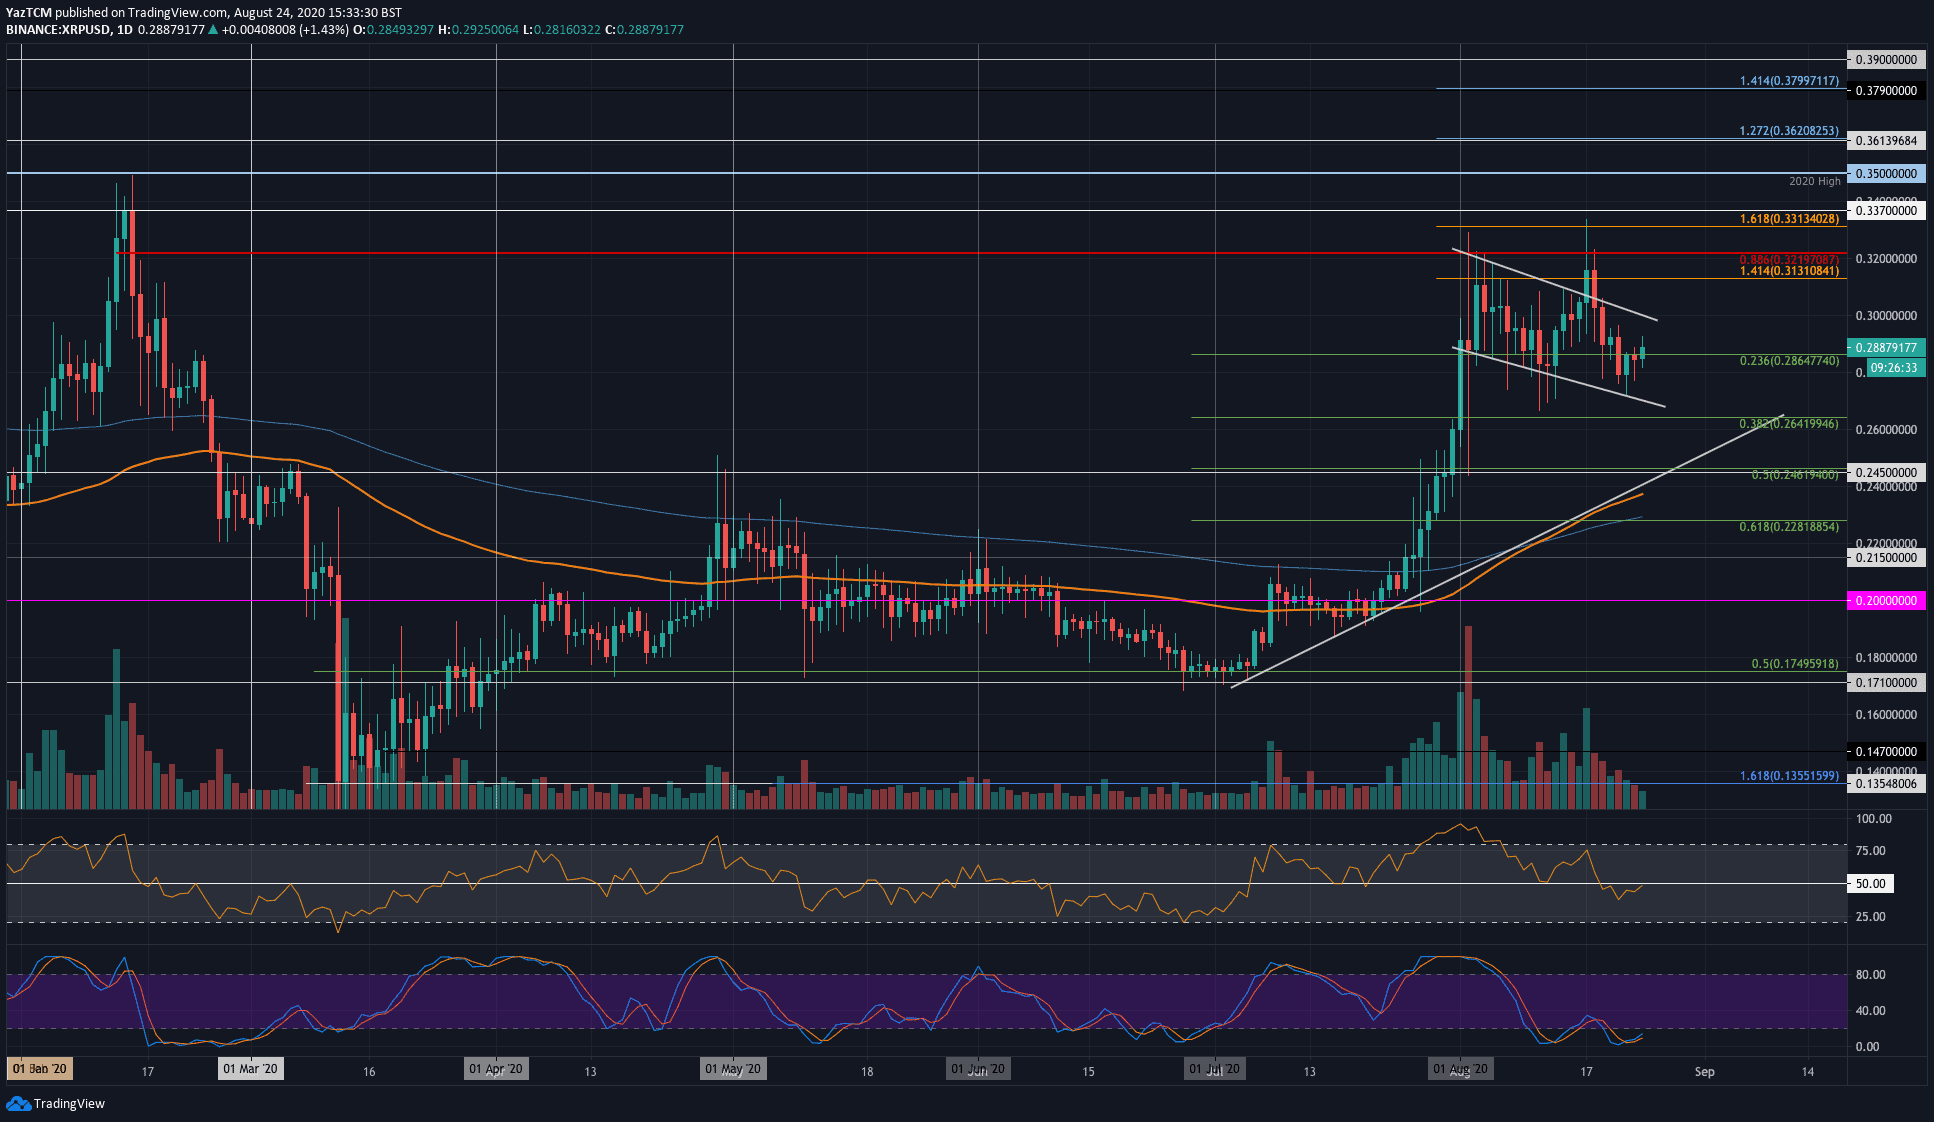
XRP/USD. Source: TradingView
Key Support Levels: $0.28, $0.264, $0.25.
Key Resistance Levels: $0.3, $0.313, $0.321.
Last week, XRP spiked into resistance at around $0.335 to a fresh 6-month high. This could have been a short term bullish move; however, the sellers quickly pushed the price lower to close the daily candle beneath $0.32, which turned into a red flag. From there, XRP headed lower throughout last week as it re-entered the descending price channel, as shown in the chart below.
On Saturday, XRP bounced from the lower boundary of this falling price channel after it spiked as low as $0.271. Over the past hours, the bulls pushed it to the current level at $0.287 as they start to eyeball the $0.30 resistance once again.
From above, the first resistance lies at $0.3. This is further bolstered by the upper boundary of the mentioned descending price channel. Beyond $0.3, resistance is located at $0.313 (1.414 Fib Extension), $0.321 (bearish .886 Fib Retracement), and $0.331 (1.618 Fib Extension).
Alternatively, the first level of support lies at $0.28. This is followed by support at the lower boundary of the descending price channel and $0.264 (.382 Fib Retracement). Beneath $0.26, added support lies at $0.246 (.5 Fib Retracement).
The RSI is beneath the mid-line; however, it looks like the bulls are attempting to take control of the momentum and push it back above 50. Additionally, the Stochastic RSI recently went through a bullish crossover signal, which is a promising bullish signal.
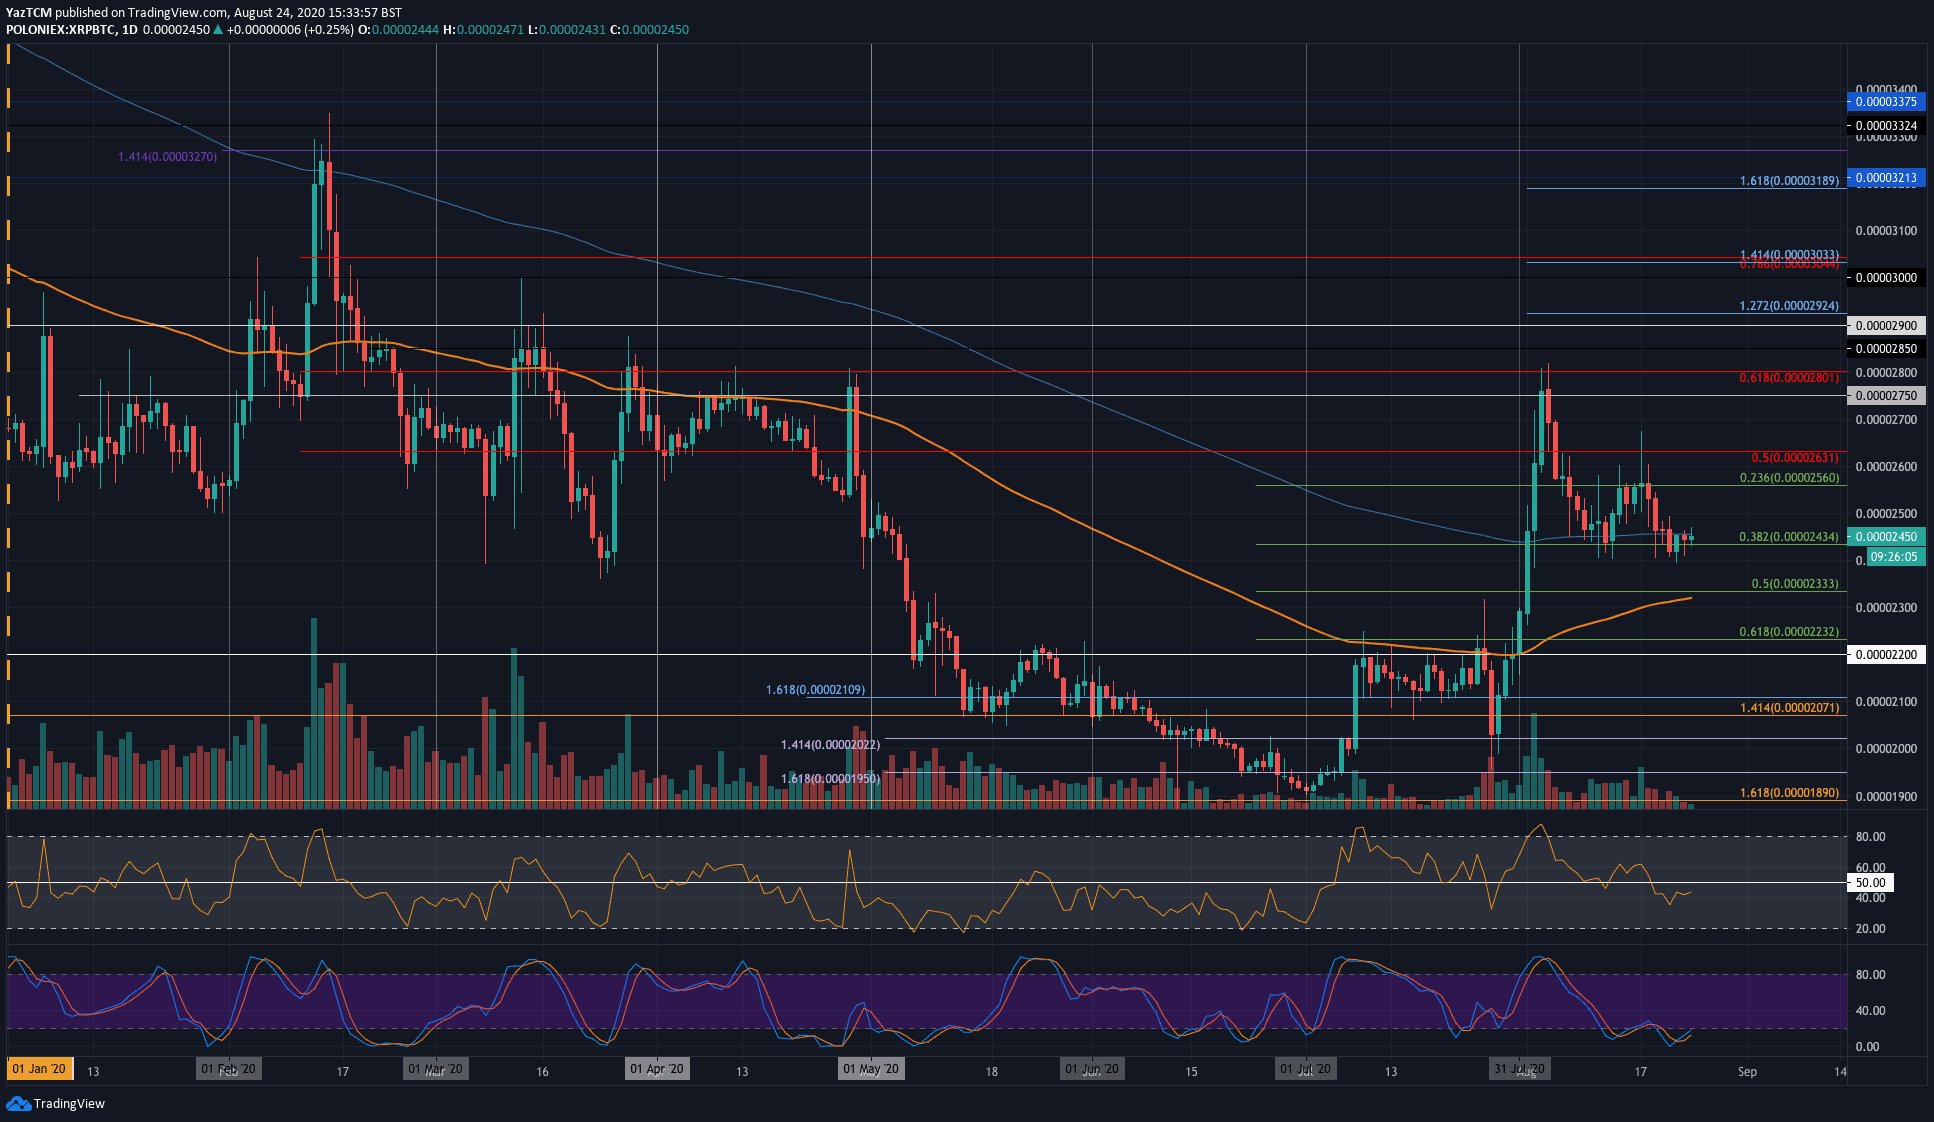
Key Support Levels: 2434 SAT, 2333 SAT, 2232 SAT.
Key Resistance Levels: 2455 SAT, 2560 SAT, 2800 SAT
Against Bitcoin, XRP dropped beneath the support at the 200-days EMA last week as it fell below added support at 2435 SAT (.382 Fib Retracement) to reach as low as 2400 SAT. Luckily, the buyers regrouped over the weekend to push XRP back above the 2435 SAT support as they attempt to break the 200-days EMA next.
Looking ahead, if the bulls can break the 200-days EMA at 2455 SAT, the next resistance is located at 2560 SAT, followed by 2630 SAT (bearish .5 Fib Retracement), and 2800 SAT (bearish .618 Fib Retracement).
From below, beyond the 2334 SAT support level (.382 Fib Retracement), the next level of support lies at 2400 SAT. This is followed by additional support at 2333 SAT (.5 FIb Retracement & 100-days EMA), and 2230 SAT (.618 Fib Retracement).