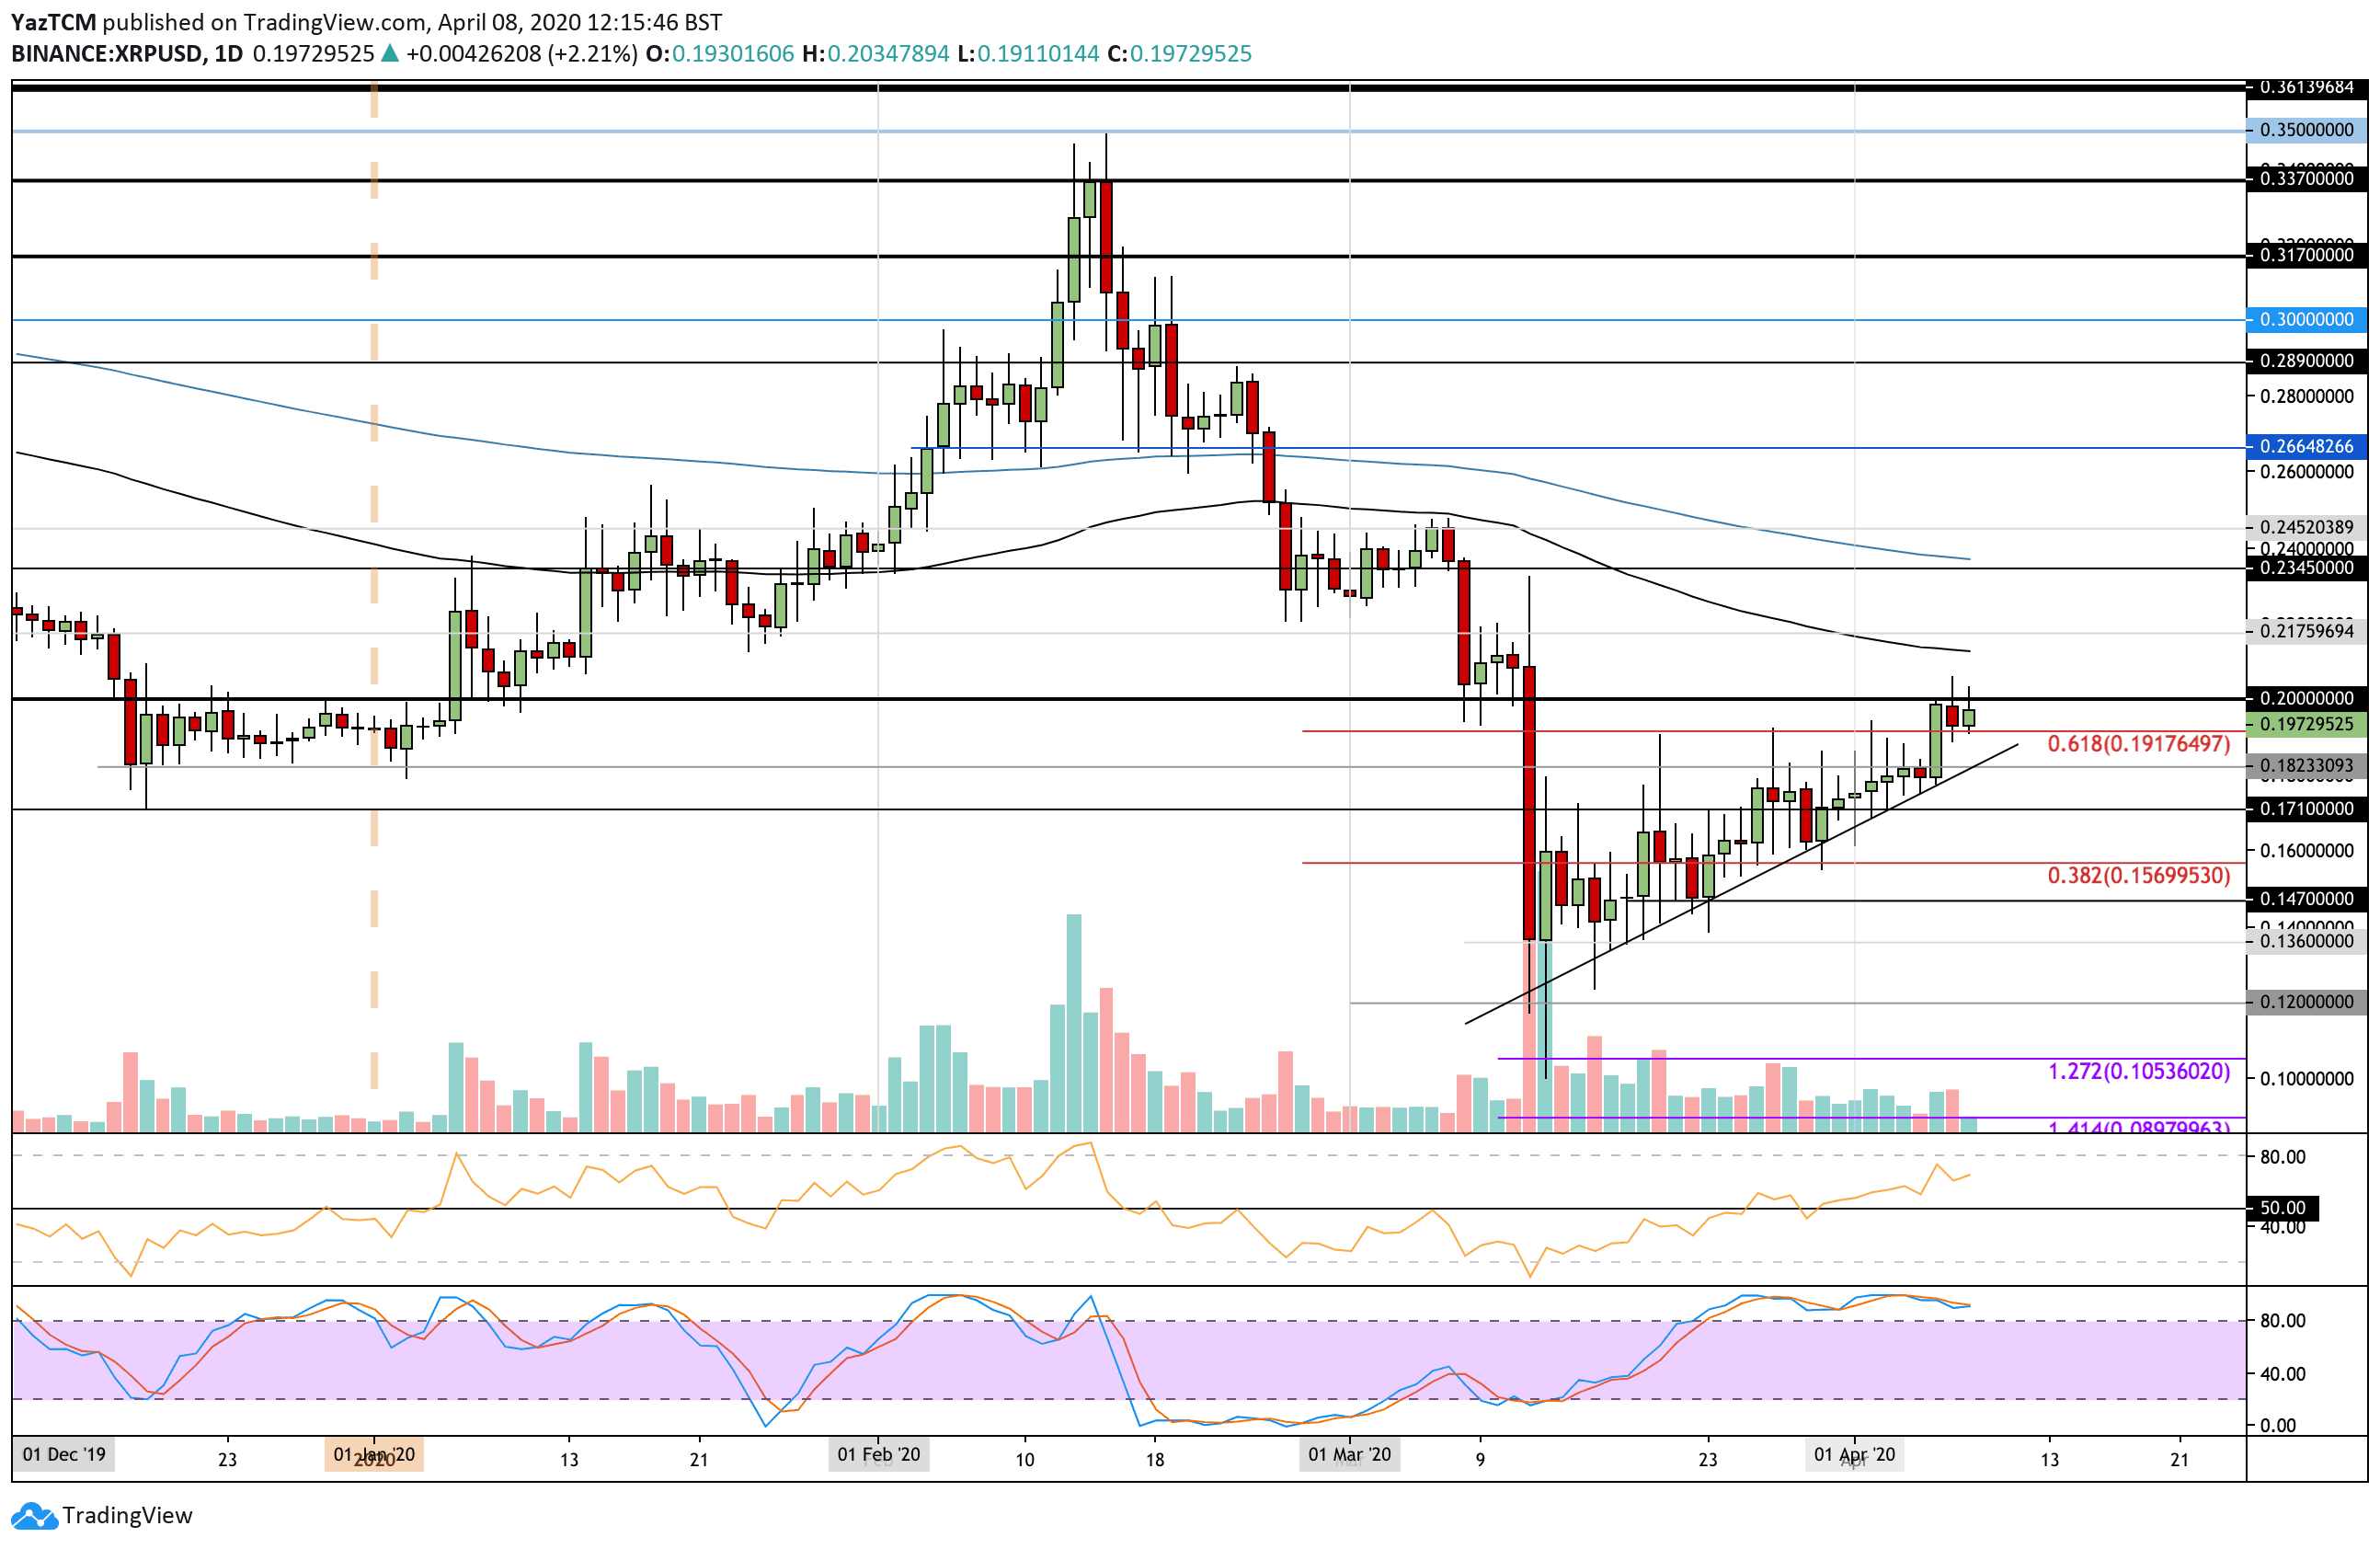
XRP/USD:
Support: $0.191, $0.182, $0.171.
Resistance: $0.2, $0.215, $0.22..
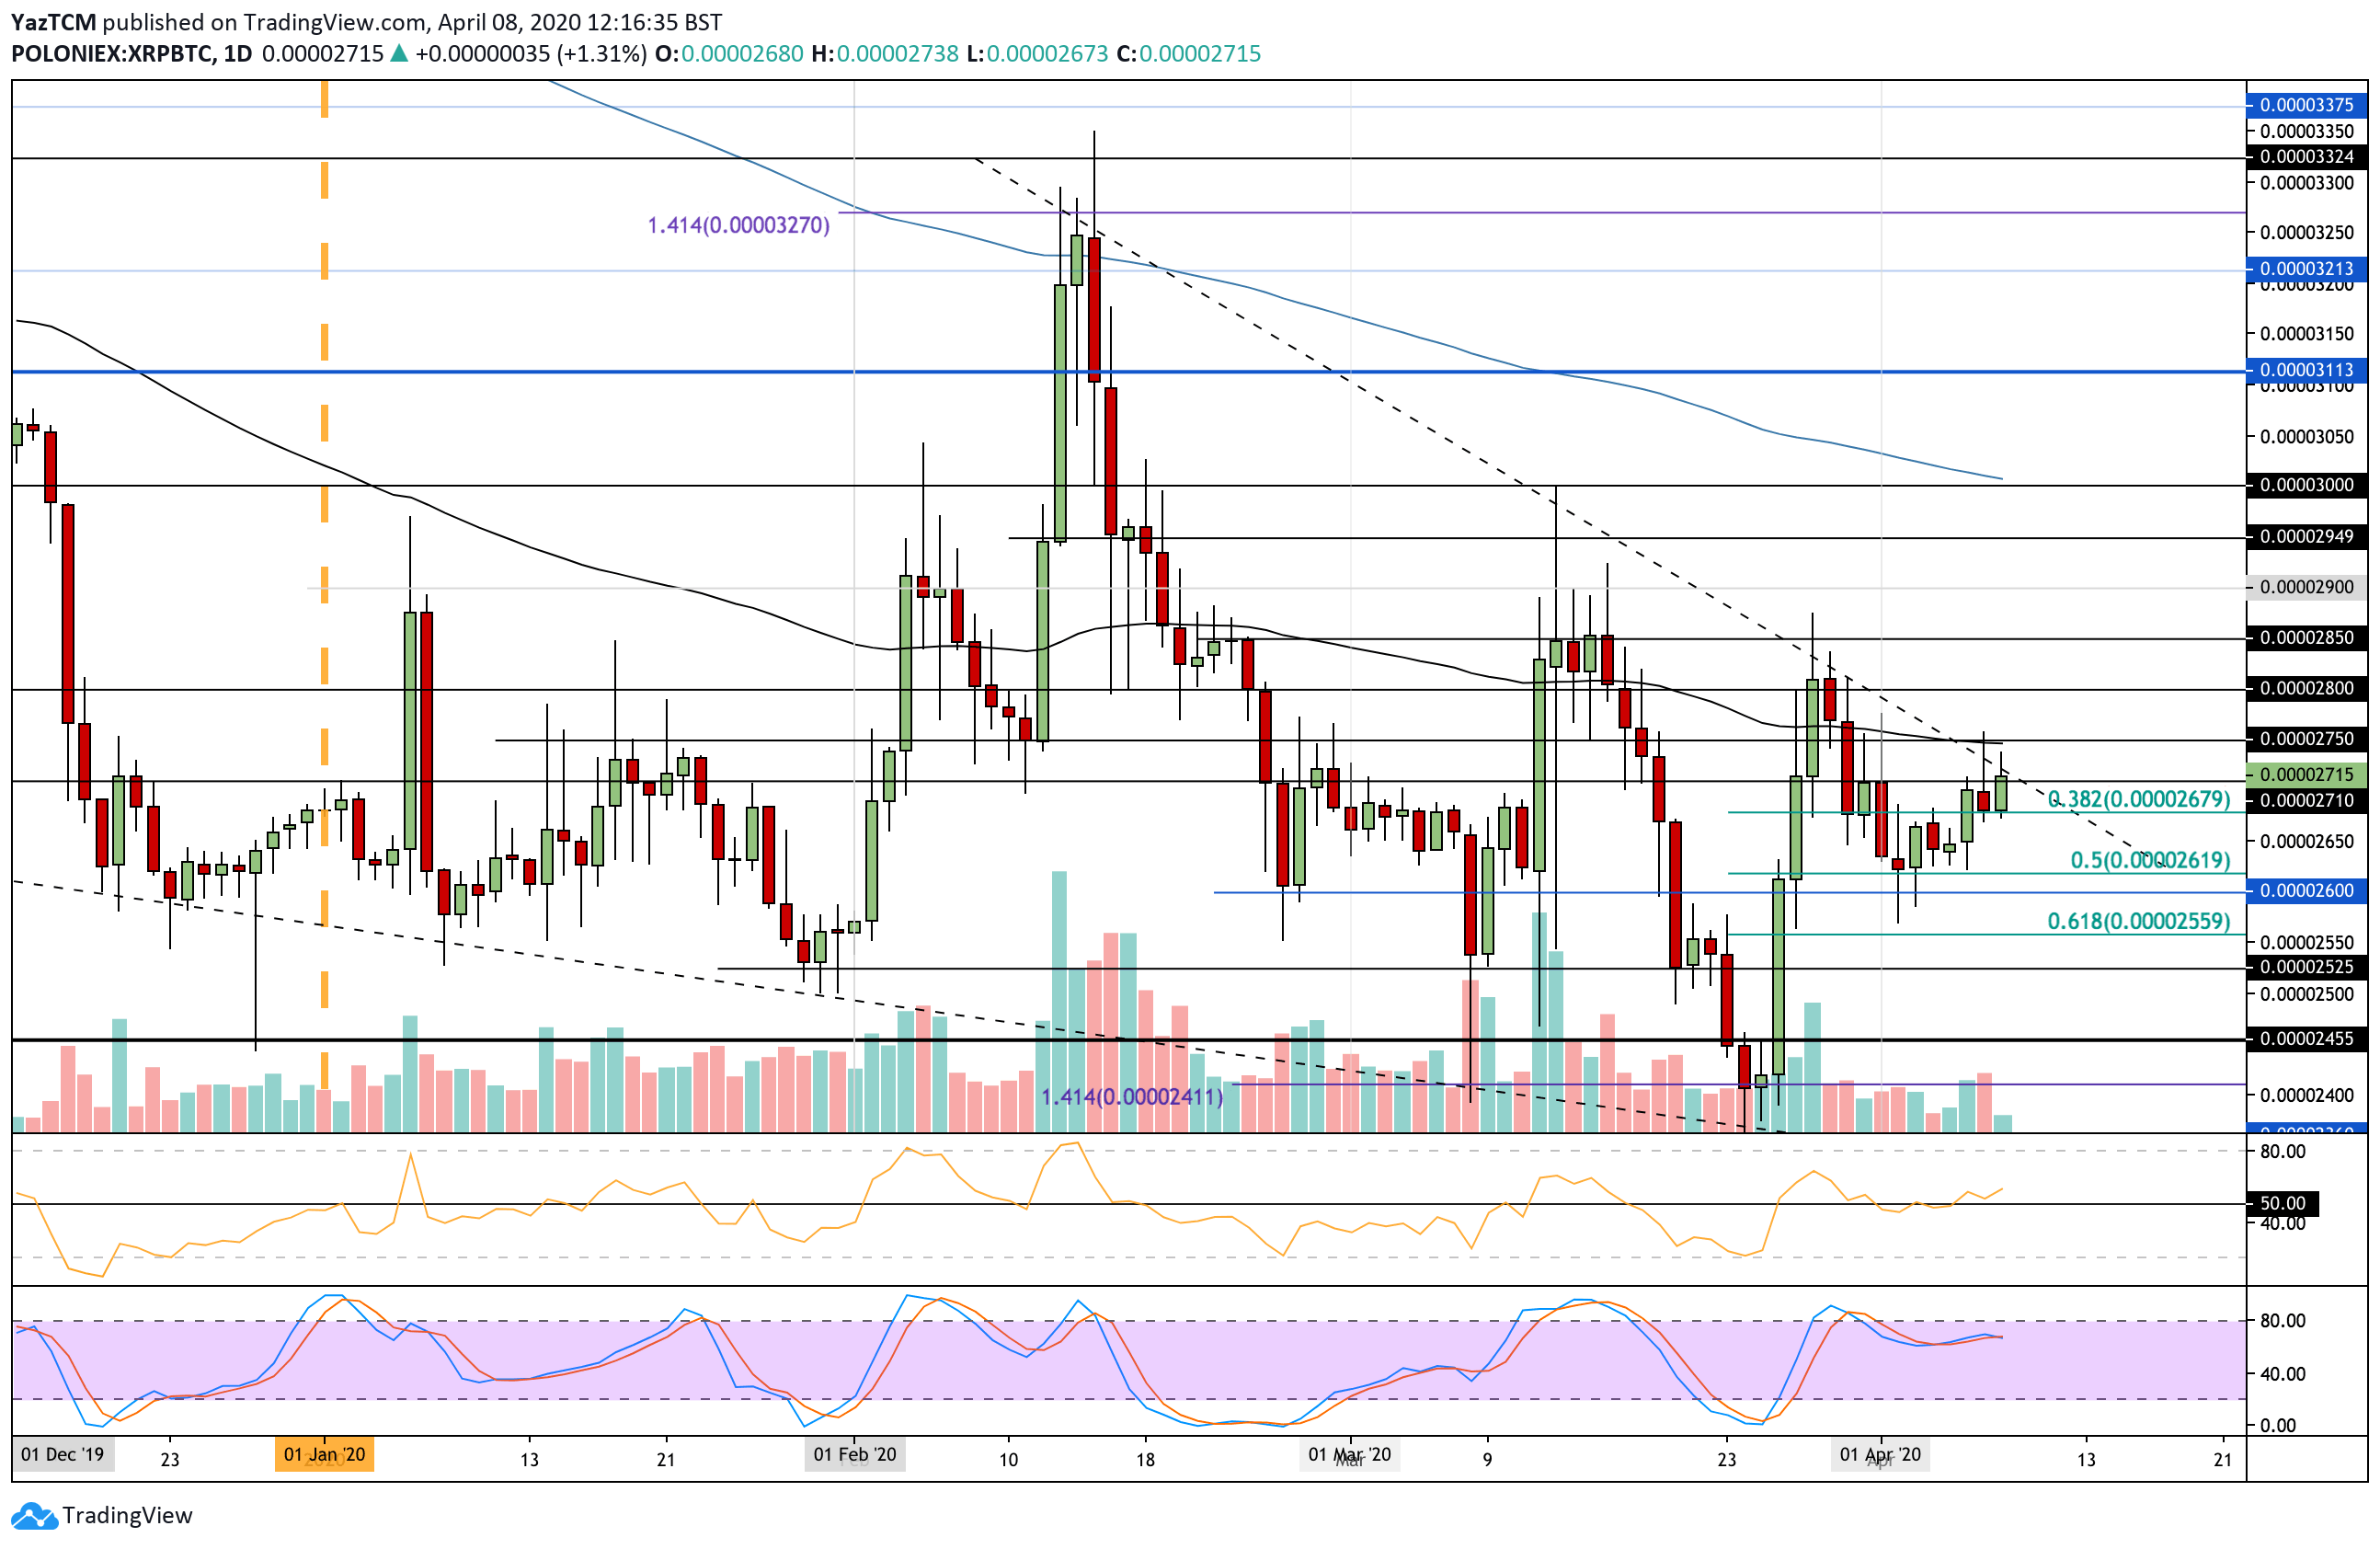
XRP/BTC:
Support: 2680 SAT, 2650 SAT, 2620 SAT.
Resistance: 2750 SAT, 2800 SAT, 2850 SAT.
This week, XRP bounced from the support at the rising trend line which allowed the cryptocurrency to surge above resistance at $0.191 (bearish .618 Fib Retracement) and reach $0.2.
A break above $0.2 would push the sentiment into a bullish direction and should allow XRP to reach $0.24 to recover all of March 2020 losses.
Above $0.2, the first level of resistance lies at $0.215 which is provided by the 100-days EMA. Following this, resistance lies at $0.22, $0.23, and $0.24 (200-days EMA).
On the other side, the first level of support is located at $0.191. Beneath this, support lies at $0.182, the rising support trend line, and $0.171.
The RSI continues to remain above the 50 level as the buyers dominate market momentum. It has room to travel higher which should allow XRP to breach the $0.20 level this week.
Against Bitcoin, XRP also surged this week as it bounced from support at 2620 (.5 Fib Retracement) to reach the current trading level at 2710 SAT.
The cryptocurrency is now attempting to break above resistance provided by a 2-month-old falling trend line. A break above this should allow XRP to begin the move toward 2850 SAT.
Once XRP climbs above the falling trend line, resistance is located at 2750 SAT (100-days EMA). Above this, resistance lies at 2800 SAT and 2850 SAT.
From below, the first level of support lies at 2670 SAT (.382 Fib Retracement). Additional support is located at 2650 SAT and 2620 SAT (.5 Fib Retracement).
The RSI has risen slightly from the 50 level as the buyers attempt to take control of the momentum. It will need to continue to rise for XRP to be able to breach this rising trend line.