Ripple has seen a significant price increase over the past seven days, which total over 43% dollar-wise, bringing the price for the cryptocurrency up to the $0.43 price area.
The remarkable recent growth has now pushed Ripple out of its previous stagnant price movement and into a bullish setting after creating a fresh 2019 price high.
Ripple is ranked in the 3rd place amongst the top cryptocurrency coins by market cap value as it presently holds an $18.16 billion market cap.
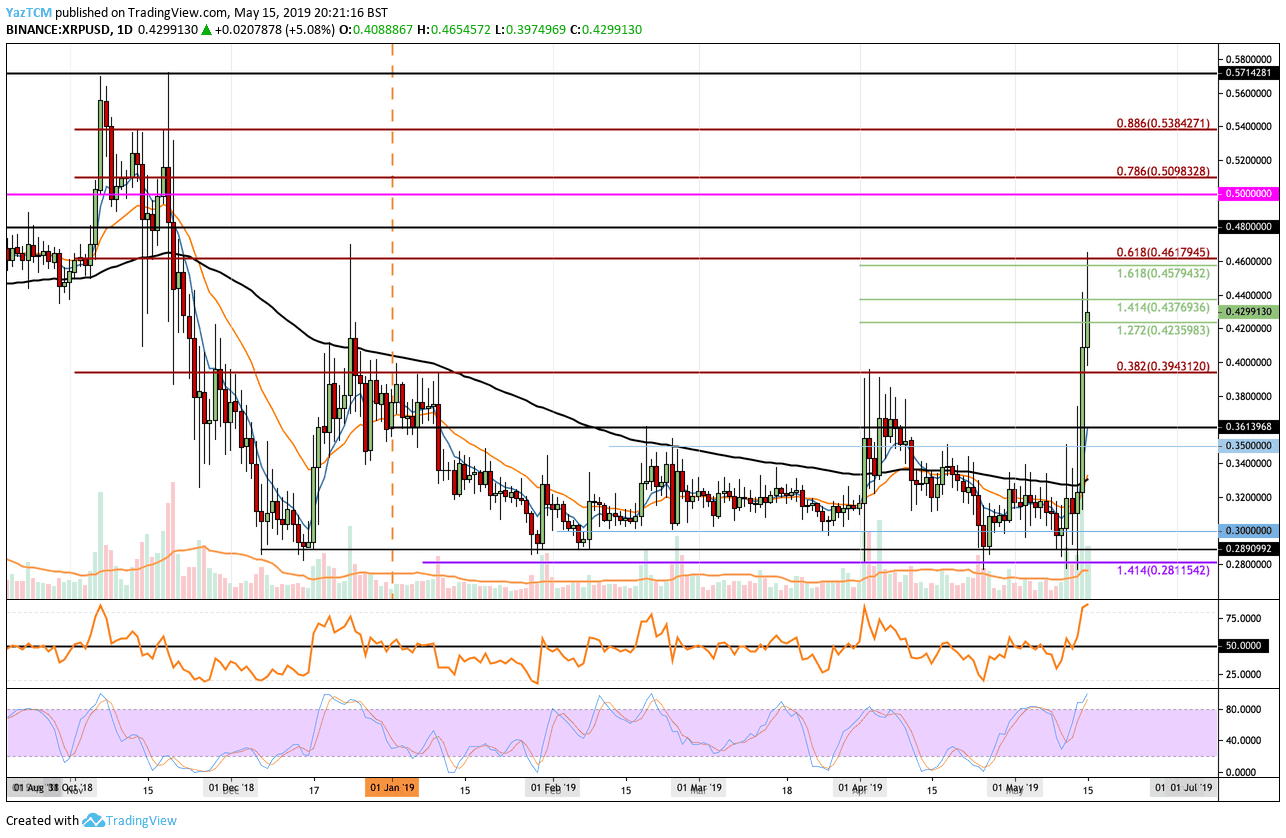
Looking at the XRP/USD 1-Day Chart:
- Against the US Dollar, we can see the stationary sideways movement that XRP/USD was trading between January 2019 and May 2019. However, the recent price surge marked a break-up above the 100-day moving average and head significantly higher to where it is currently trading at resistance around $0.43.
- From above: The closest resistance lies at $0.44 and then $0.46, along with a long term bearish .618 Fibonacci Retracement level. Further resistance lies at $0.48, $0.50, and $0.5384.
- From below: Initial support lies at $0.42 and $0.40. Beneath $0.40, further support lies at $0.3943, $0.38, $0.3615 and $0.35.
- The trading volume has seen a significant increase over the past two days during following the recent surge.
- The RSI has now reached the overbought territory, which could indicate that the bulls may be exhausted at this moment and a healthy correction might be coming soon.
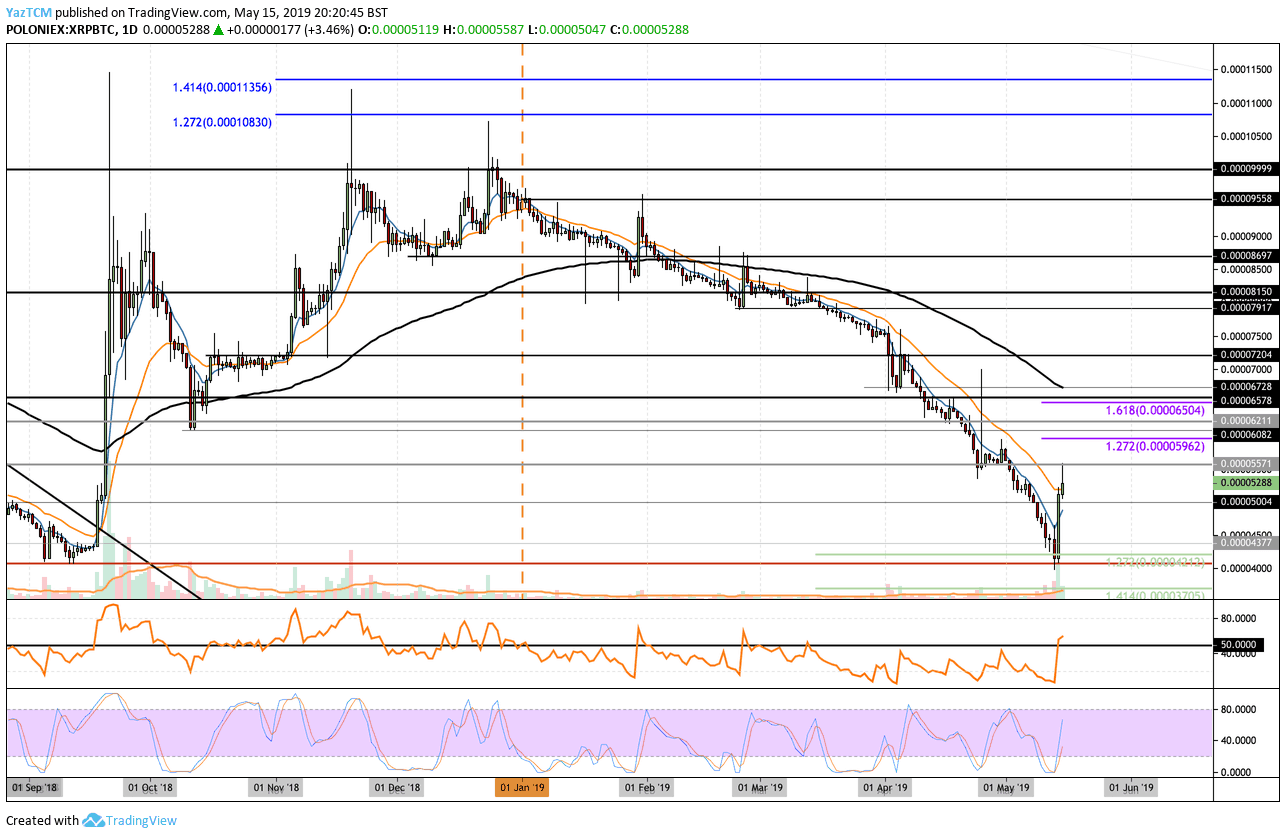
Looking at the XRP/BTC 1-Day Chart:
- Against Bitcoin, we can see XRP/BTC had continued to fall further lower until finding long-term support around the 4000 SAT price level. This price level had provided strong support for the market during December 2018. XRP/BTC is now trading close to the 5300 SAT resistance mark.
- From above: The nearest level of resistance lies at 5570 SAT and 6000 SAT. Further resistance lies at 6211 SAT, 6578 SAT, 6728 SAT (also the 100-day moving average line) and 7000 SAT.
- From below: The nearest level of support lies at 5000 SAT. Beneath lie 4500 SAT, 4377 SAT and 4000 SAT support levels.
- The RSI has recently managed to penetrate above the 50 levels for the first time since late February 2019, which is a strong bullish signal. Furthermore, the Stochastic RSI has recently initiated a crossover signal in the oversold territory, which is a robust bullish signal.
SPECIAL OFFER (Sponsored)
LIMITED OFFER 2024 for CryptoPotato readers at Bybit: Use this link to register and open a $500 BTC-USDT position on Bybit Exchange for free!
Disclaimer: Information found on CryptoPotato is those of writers quoted. It does not represent the opinions of CryptoPotato on whether to buy, sell, or hold any investments. You are advised to conduct your own research before making any investment decisions. Use provided information at your own risk. See Disclaimer for more information.
Cryptocurrency charts by TradingView.