XRP has seen a sharp decline of 10.49% over the previous week, bringing its price to $0.2566. The cryptocurrency’s price has fallen 21% over the past 30 days and 37% over the past 3 months.
XRP remains the third-largest cryptocurrency by market value with a market cap of $11.07 billion.
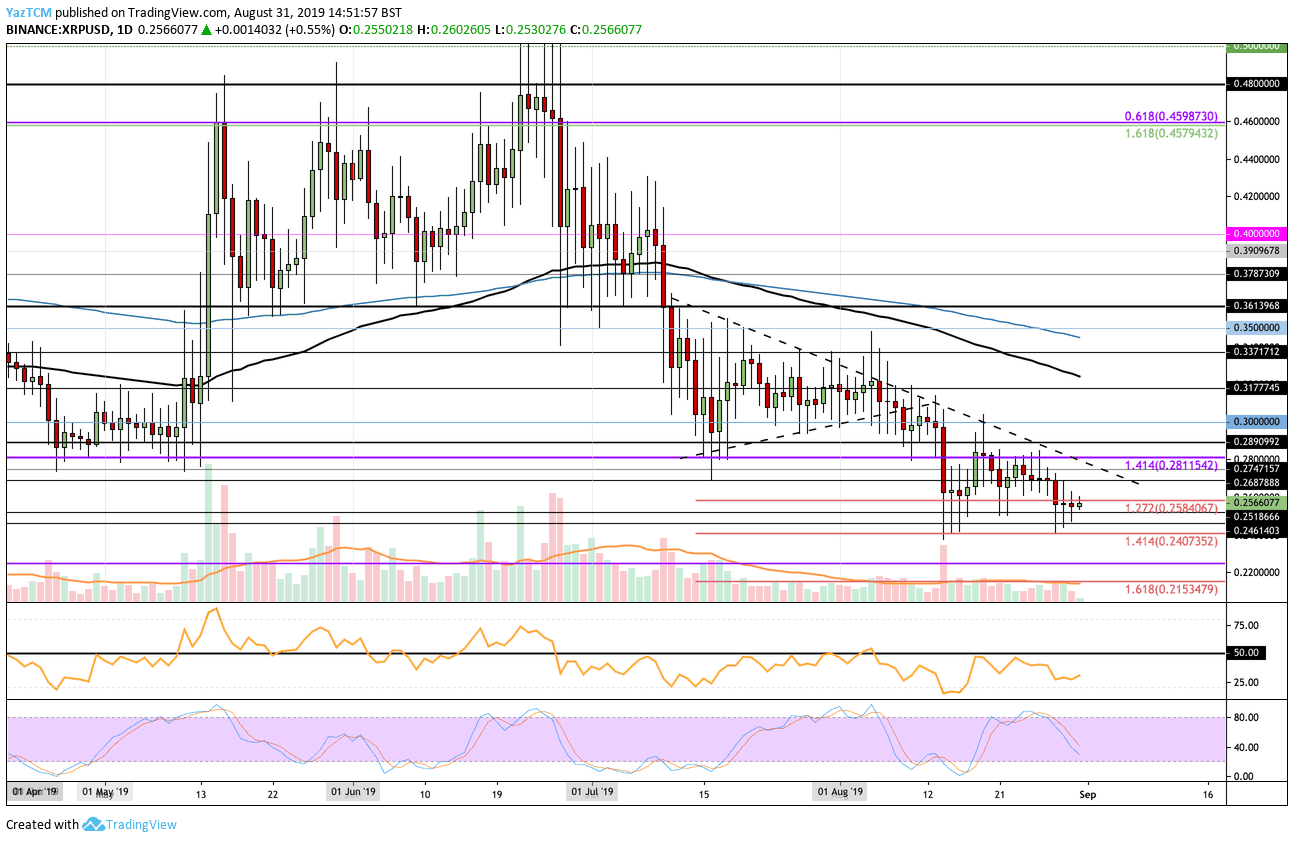
Looking at the XRP/USD 1-day chart:
- Since our previous XRP/USD analysis, XRP has continued to trade above $0.24. However, it started to create fresh lows beneath the support at $0.2584 which could be a sign that the market is ready to head lower.
- From above: The nearest level of resistance is $0.2584. Above this, resistance is located at $0.26, $0.2687, $0.2747, and $0.2811. For XRP to turn bullish in the short term, we will need to see it climb above $0.30. After that, resistance is found at $0.32 (the 100-day EMA) and $0.33.
- From below: The nearest levels of support are $0.2518 and $0.25. Beneath this, support is located at $0.2461 and $0.2402. If the selling continues, further support is expected at $0.23, $0.225, and $0.2153.
- The trading volume remains low and below average.
- The RSI is in favor of the bears as they continue to dominate the market.
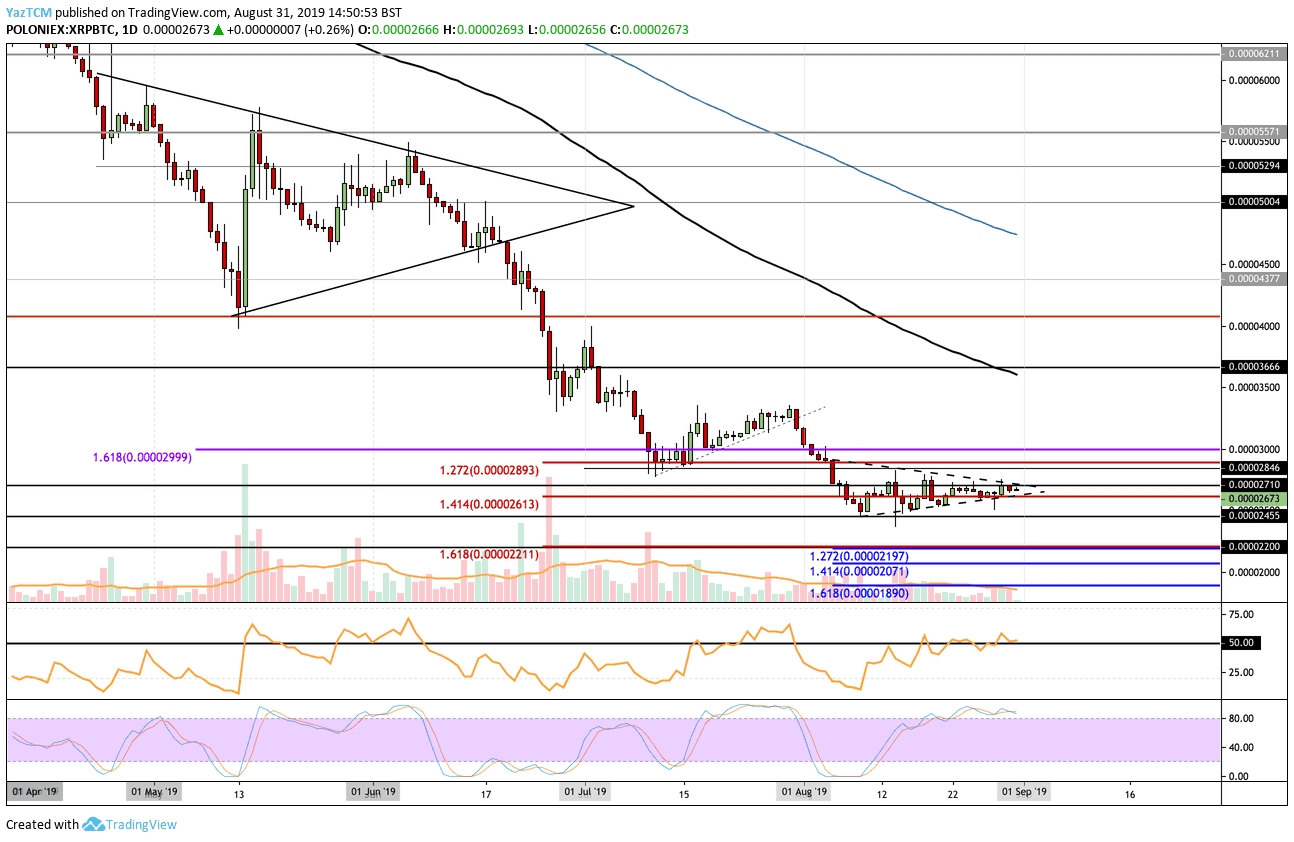
Looking at the XRP/BTC 1-day chart:
- Trading against Bitcoin, XRP has held up remarkably well between 2,455 satoshi and 2,800 sat. The chart has created a very acute symmetrical triangle as the market continues to consolidate.
- From above: The nearest levels of resistance are 2,710 sat and 2,800 sat. Above this, resistance is expected at 2,846 sat, 3,000 sat, and 3,200 sat. The 100-day EMA is located at 3,600 sat.
- From below: The nearest level of support is 2,613 sat followed by 2,455 sat which is the lower boundary of the trading range. Beneath this, potential support is found at 2,400 sat, 2,300 sat, 2,211 sat, and 2,071 sat.
- The trading volume remains low but has showed signs of increasing over the past few days.
- The RSI recently rose above 50 which shows that the bulls are attempting to gain control. However, the Stochastic RSI is currently at extreme overbought levels as we await a bearish crossover that could push the market lower.
SPECIAL OFFER (Sponsored)
LIMITED OFFER 2024 for CryptoPotato readers at Bybit: Use this link to register and open a $500 BTC-USDT position on Bybit Exchange for free!
Disclaimer: Information found on CryptoPotato is those of writers quoted. It does not represent the opinions of CryptoPotato on whether to buy, sell, or hold any investments. You are advised to conduct your own research before making any investment decisions. Use provided information at your own risk. See Disclaimer for more information.
Cryptocurrency charts by TradingView.