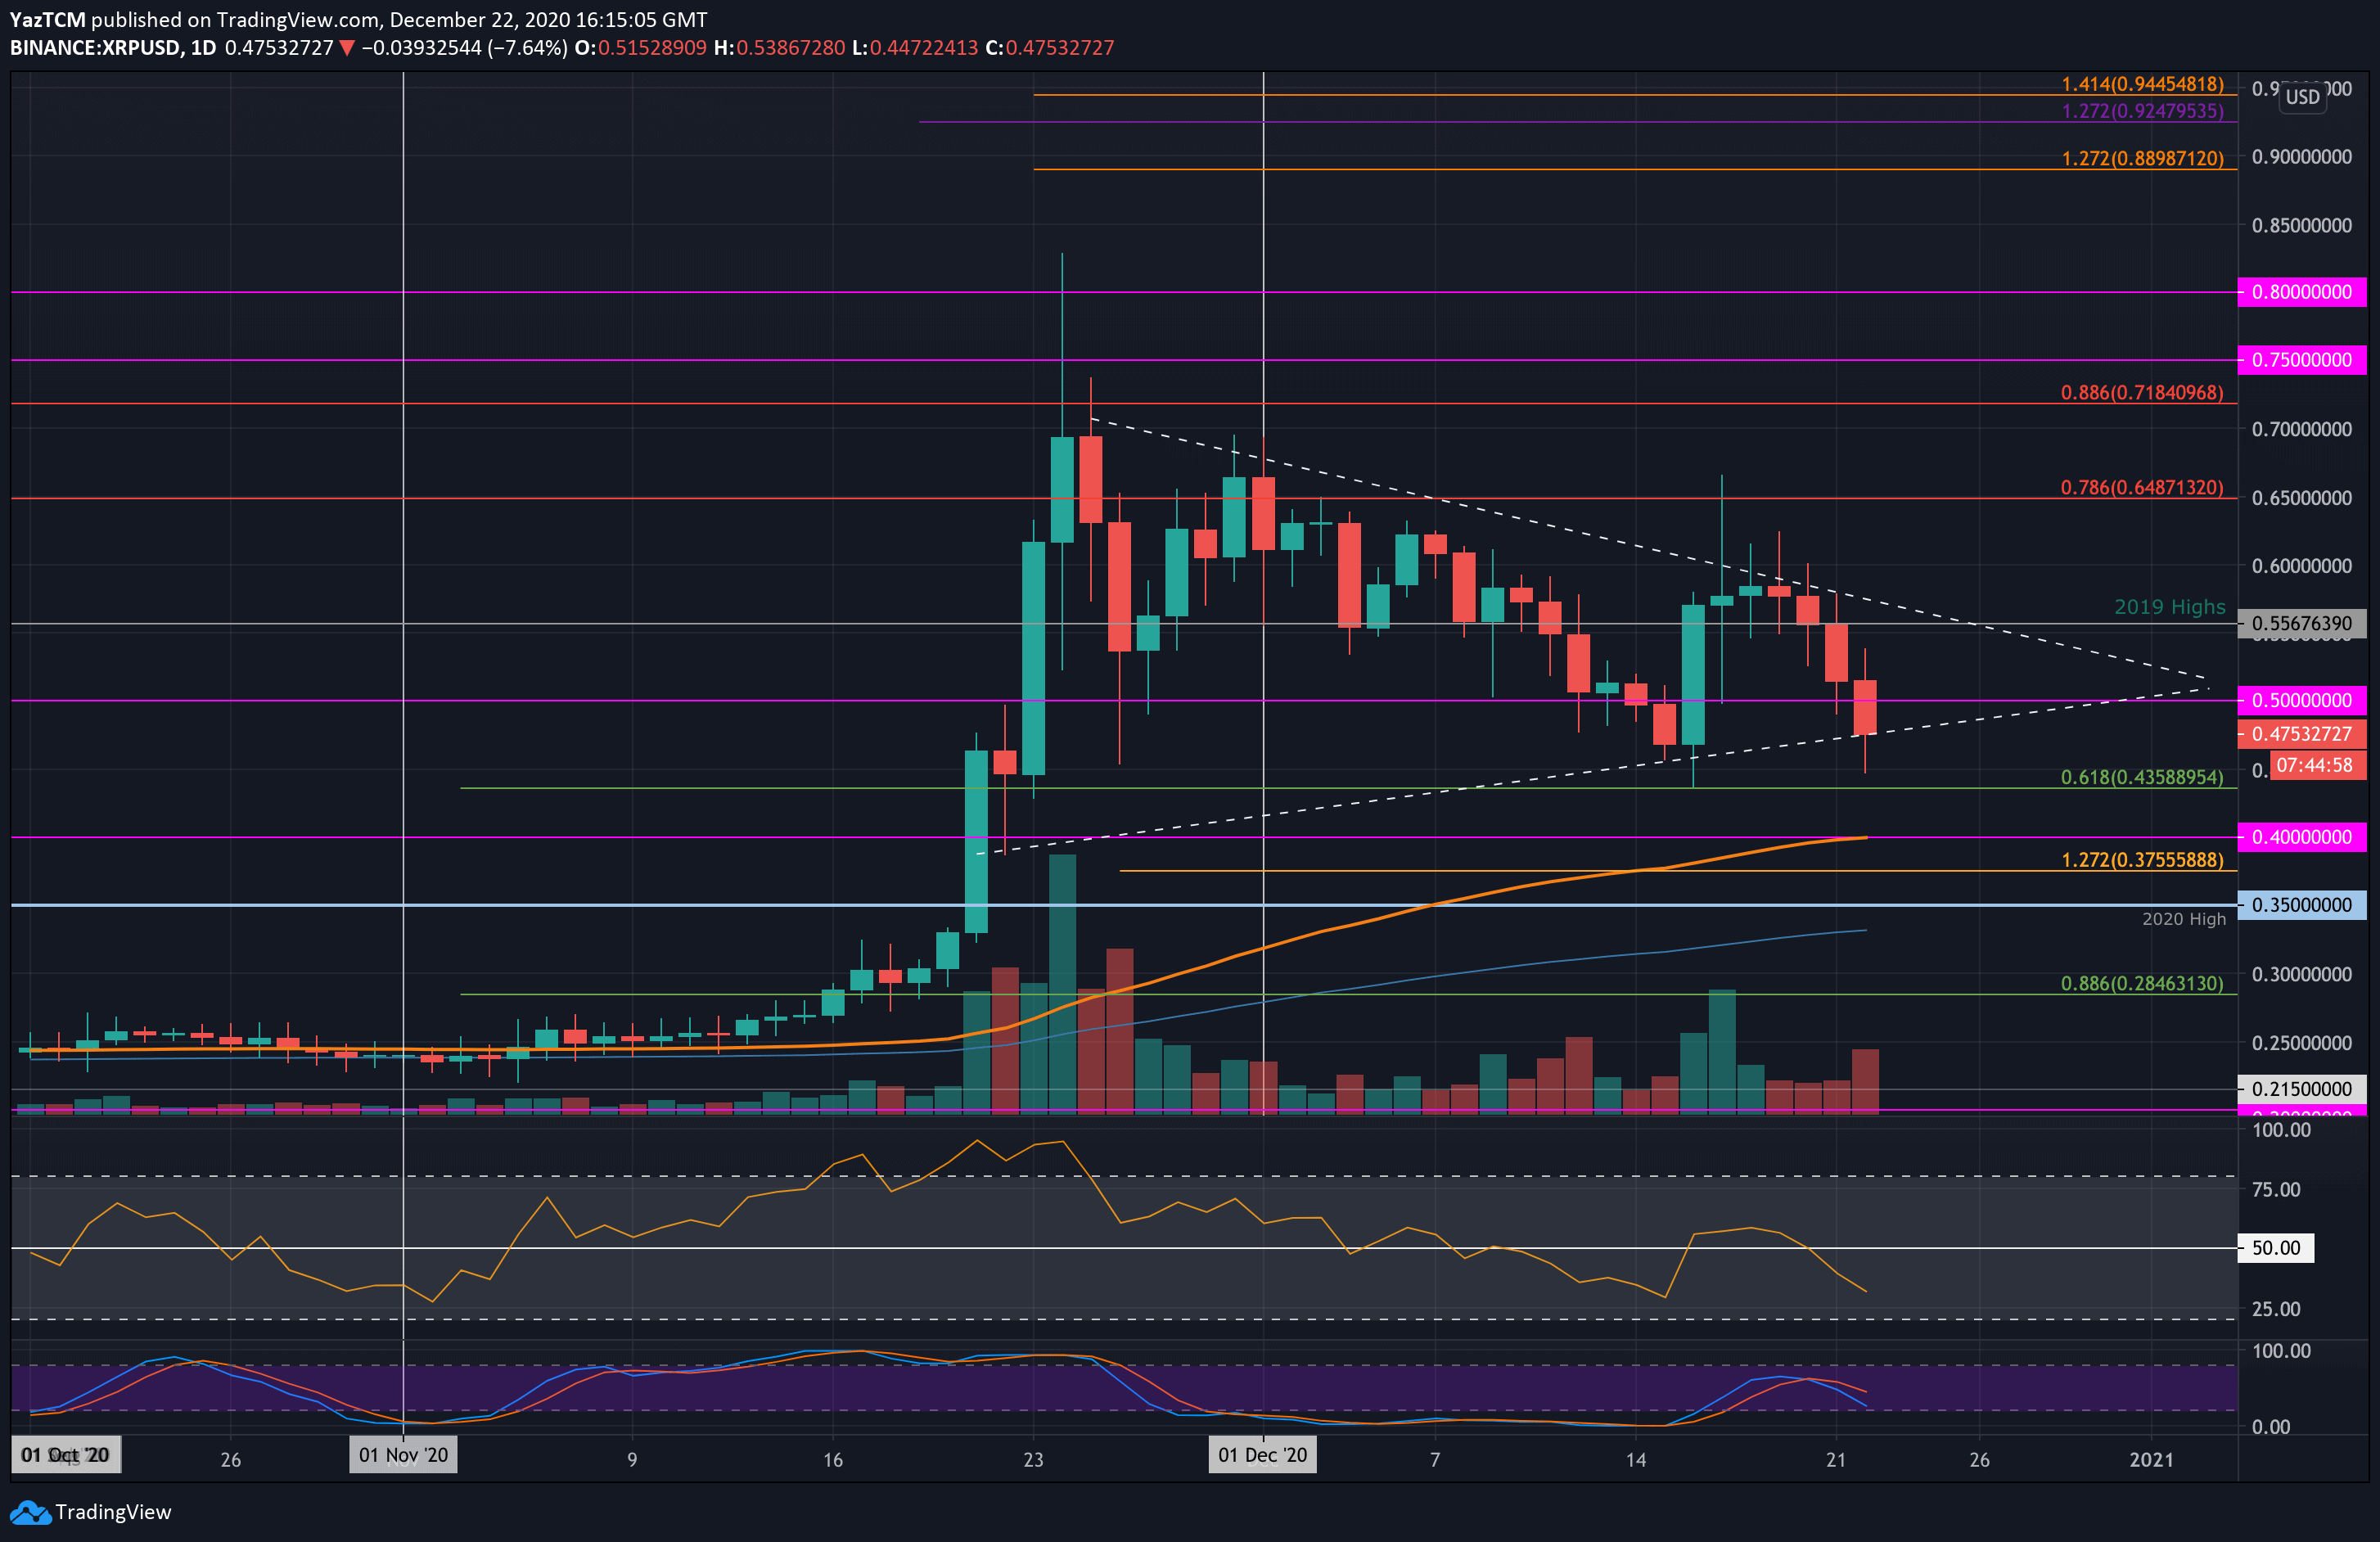
XRP/USD Daily Chart. Source: TradingView
Key Support Levels: $0.45, $0.43, $0.4.
Key Resistance Levels: $0.556, $0.6, $0.648.
Throughout the December period, XRP has been trapped between $0.65 and $0.43. It reached the lower boundary of this range last week and proceeded to bounce from the support provided by a .618 Fib Retracement.
After rebounding, XRP started to climb higher but could not close a daily candle above $0.58. As a result, XRP rolled over during the weekend and fell beneath the 2019 highs at $0.556 yesterday.
Today, XRP continued to drop as it fell beneath $0.6 and went as low as $0.45. It has since recovered slightly as it trades at $0.475.
Additionally, XRP is also trading within a short term symmetrical triangle pattern and is battling to defend the lower boundary.
Looking ahead, if the buyers can reclaim $0.5, the first level of resistance lies at $0.556 (2019 Highs). This is followed by $0.6, $0.648 (bearish .786 Fib), and $0.7.
On the other side, if the sellers push lower, the first level of support lies at $0.45. This is followed by $0.435 (.618 Fib), $0.4 (100-day EMA), and $0.375 (downside 1.272 Fib Extension).
Both the RSI and Stochastic RSI are printing bearish readings as they head lower. The RSI is beneath the mid-line and is falling, which suggests the bearish momentum is increasing.
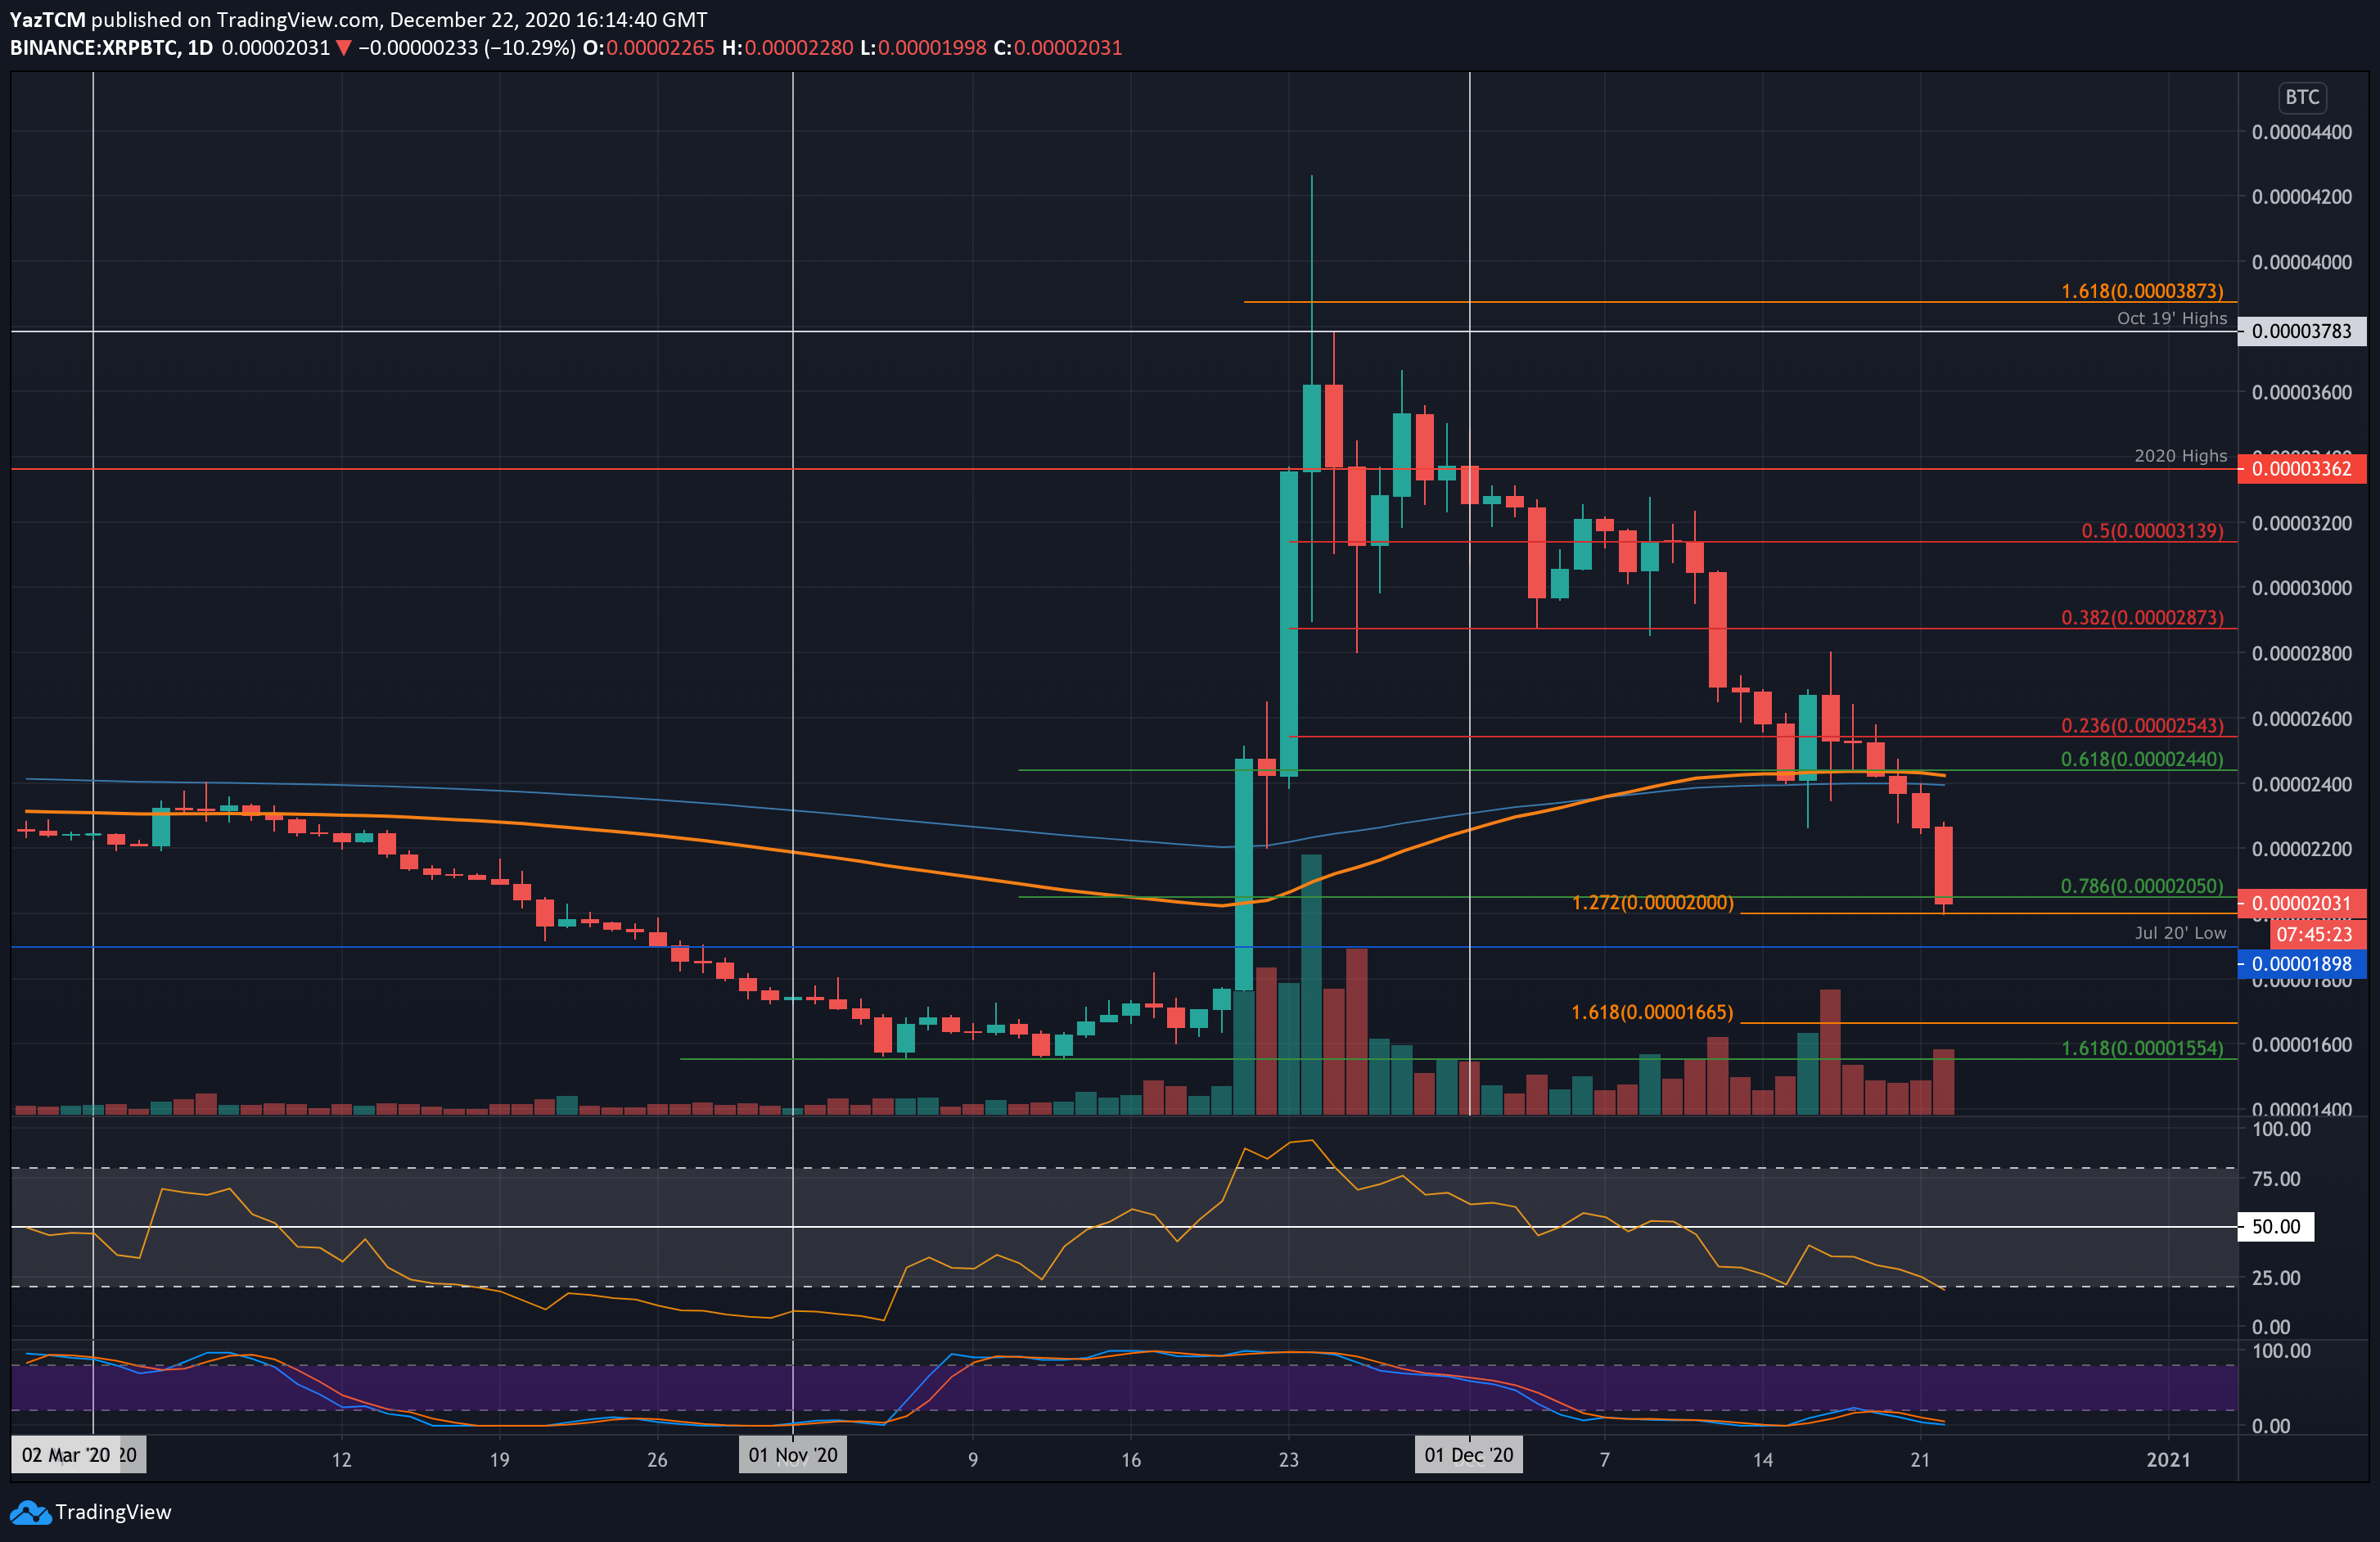
Key Support Levels: 2000 SAT, 1900 SAT, 1800 SAT.
Key Resistance Levels: 2200 SAT, 2400 SAT, 2545 SAT.
Against Bitcoin, XRP dropped by a steep 38% from the December high of 3400 SAT. It reached support at the 200-days EMA last week as the bulls battled to try and defend this level. However, on Sunday, XRP fell beneath the 200-days EMA and continued lower over the last two days to reach as low as 2000 SAT today.
Looking ahead, if the sellers continue lower, the first level of support lies at 2000 SAT. This is followed by 1900 SAT (July 2020 low), 1800 SAT, and 1665 SAT.
Alternatively, if the buyers can reverse the trend, the first level of resistance lies at 2200 SAT. This is followed by 2400 SAT (200-days EMA), 2545 SAT (bearish .236 Fib), and 2800 SAT.
Both the RSI and Stochastic RSI are extremely oversold for XRP/BTC. This could suggest that the buyers might be reaching exhaustion soon.