Ripple’s XRP token has been suffering in the face of a falling Bitcoin price this week, dropping by a total of 17.44% to beneath $0.40. At the time of writing, XRP was trading at $0.3989. The cryptocurrency has done very well at holding above support at both the 100 and 200-day EMA. However, it continues to struggle to make any movement above the $0.40 level.
XRP remains the #3 cryptocurrency project by market valuation, with a market cap of around $17 billion. Despite the majority of cryptocurrencies having surged over the past 3 months, XRP has only increased by 20% – nowhere near Ethereum’s 82% or BNB’s 70% gains.
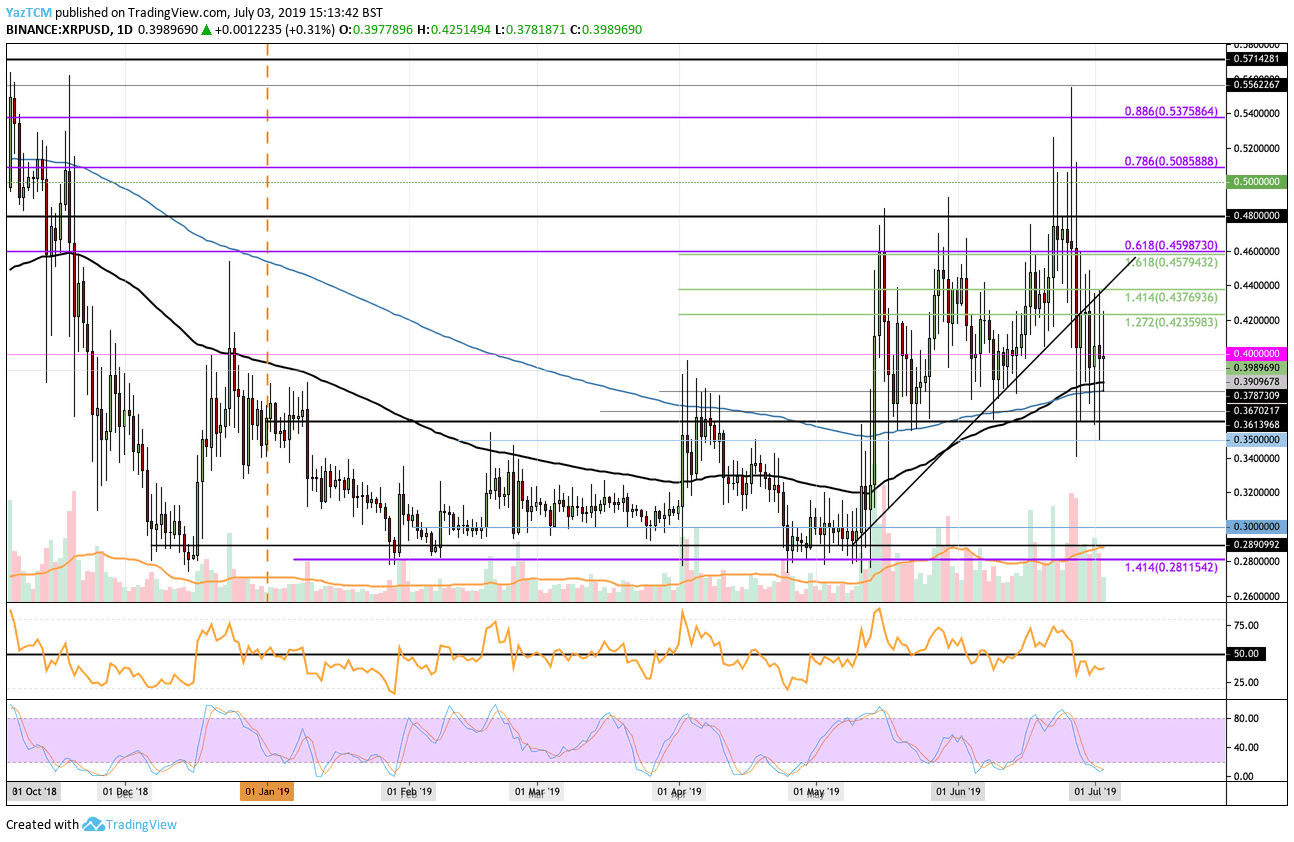
Looking at the XRP/USD 1-day chart:
- Since our last XRP/USD analysis, the token’s price has dropped beneath the previous support at the rising trend line. XRP has managed to remain near the $0.40 level as the 100-day EMA and 200-day EMA have continued to provide support.
- From above: The nearest level of resistance lies at $0.40. Above this, resistance is at $0.4235, $0.4380, and $0.46. If the bulls can break above $0.46, higher resistance is located at $0.48 and $0.50. Above $0.50, the next resistance levels are located at $0.5085, $0.52, and $0.5375.
- From below: The nearest level of support now lies between $0.39 and $0.38. The support in this area is further bolstered by both the 100-day and 200-day EMAs. Beneath $0.38, support lies at $0.36, $0.35, and $0.34.
- The trading volume remains high but has shown signs of diminishing in July.
- The Stochastic RSI is currently in oversold territory as we wait for a bullish crossover signal to push the market higher.
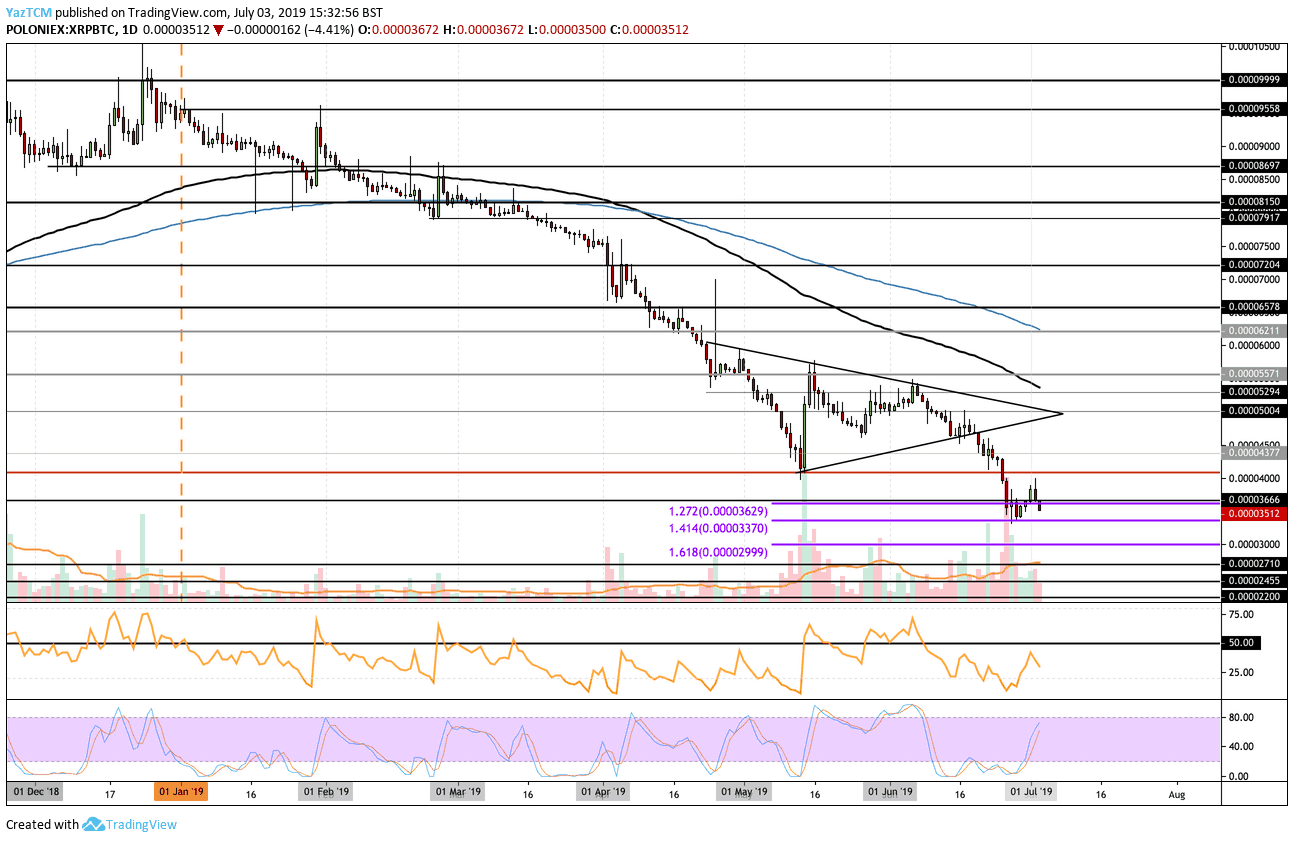
Looking at the XRP/BTC 1-day chart:
- Against Bitcoin, the XRP price has fallen beneath the 3,600 satoshi support level to find support at 3,370 sat and the downside 1.414 Fibonacci extension level. The price managed to rebound here but failed to approach 4000 sat.
- From above: The nearest level of resistance lies at 3,630 sat and 4,000 sat. If buyers can break above 4,000 sat, the next levels of resistance lie at 4,300 sat, 4,500 sat, 4,800 sat, and 5,000 sat.
- From below: The nearest level of support lies at 3,370 sat. Beneath this, additional support is found at 3,000 sat and the downside 1.618 Fib extension. If the selling continues beneath 3,000 sat, lower support lies at 2,710 sat, 2,500 sat, and 2,200 sat.
- The trading volume remains high but just slightly below the average.
- The RSI is well below the 50 level which indicates that the bears are in complete control of the market. For the XRP/BTC market to recover, we would need to see the RSI climb back above 50.
SPECIAL OFFER (Sponsored)
LIMITED OFFER 2024 for CryptoPotato readers at Bybit: Use this link to register and open a $500 BTC-USDT position on Bybit Exchange for free!
Disclaimer: Information found on CryptoPotato is those of writers quoted. It does not represent the opinions of CryptoPotato on whether to buy, sell, or hold any investments. You are advised to conduct your own research before making any investment decisions. Use provided information at your own risk. See Disclaimer for more information.
Cryptocurrency charts by TradingView.