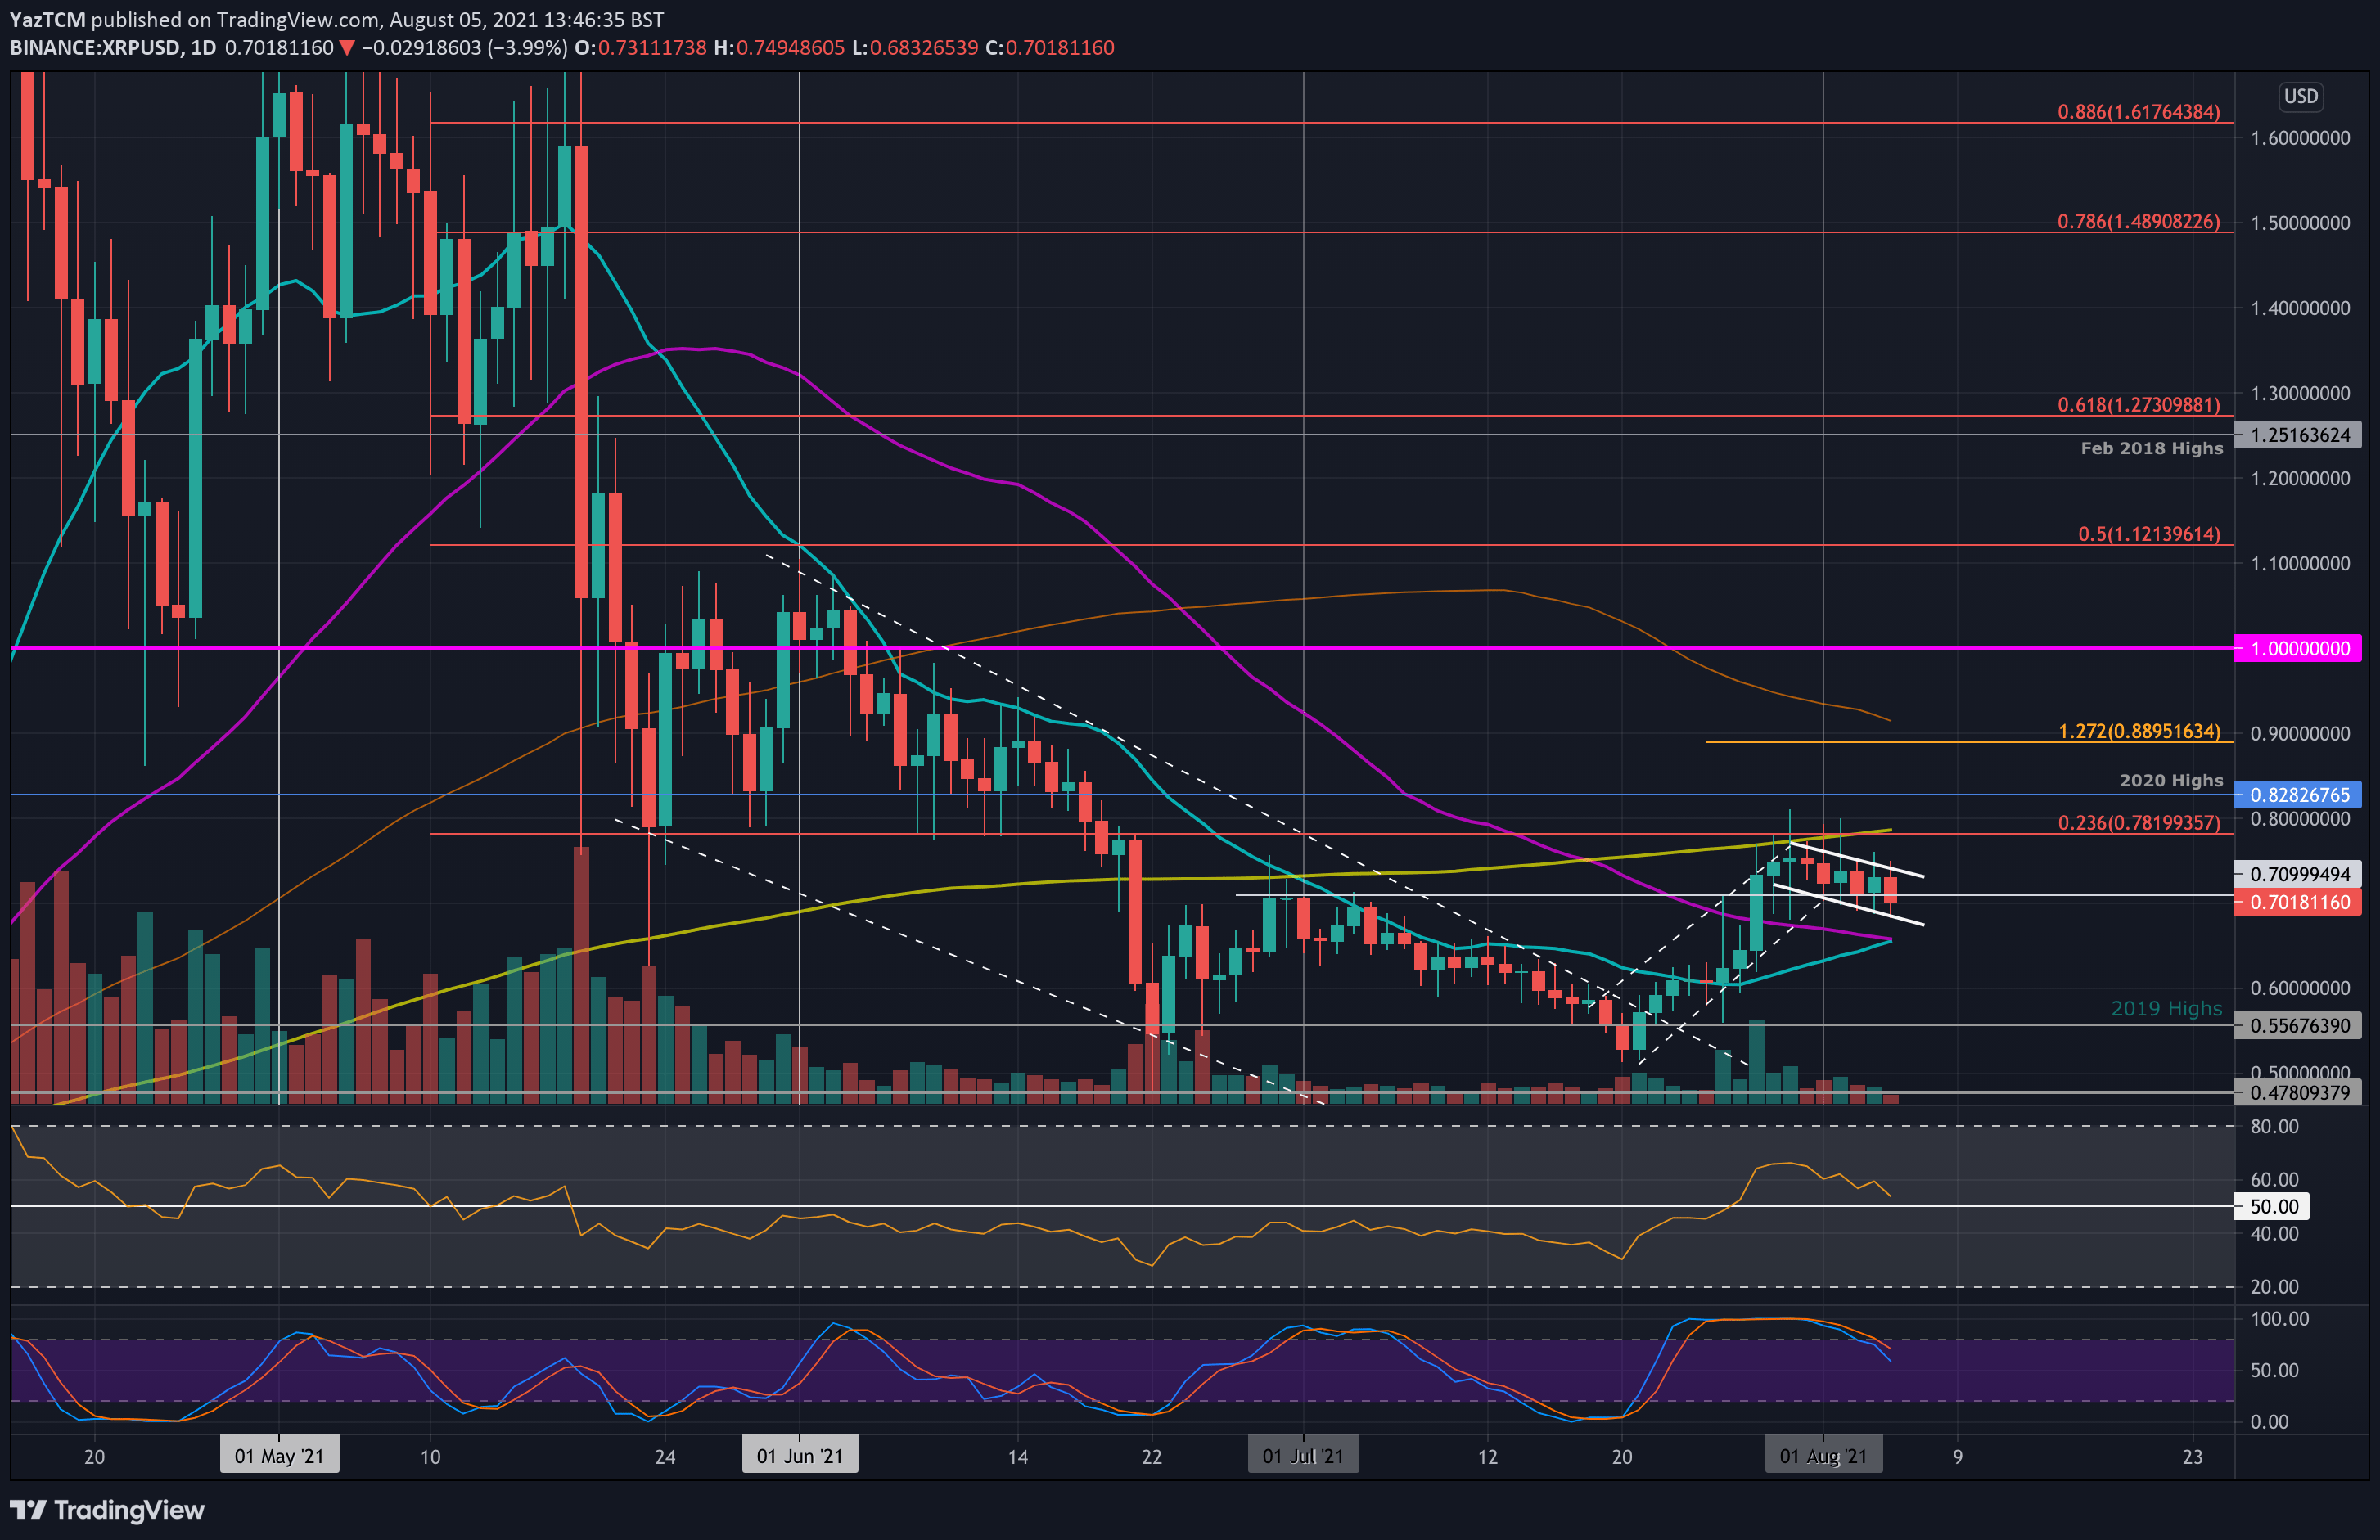
XRP/USD Daily Chart. Source: TradingView.
Key Support Levels: $0.7, $0.658, $0.6.
Key Resistance Levels: $0.72, $0.828, $0.9.
XRP performed well in the final weeks of July as it surged inside an ascending price channel, allowing it to reach the 200-day MA at $0.78. Unfortunately, it has since been unable to overcome the 200-day MA in August and has since started to retrace to $0.7.
The market has now formed a bullish flag pattern as the buyers attempt to defend the lower angle of the flag. Typically, bullish flags break out toward the upside so long as the RSI momentum does not turn bearish on the daily chart.
Looking ahead, the first resistance lies at around $0.72 (the upper angle of the flag). This is followed by $0.78 (200-day EMA & bearish .236 Fib), $0.8282 (2020 highs), and $0.9 (1.272 Fib Extension).
On the other side, the first solid support beneath $0.7 lies at $0.658 (50-day MA). This is followed by $0.6, $0.556 (2019 high), and $0.51 (July low).
The RSI is coming down, indicating the bullish momentum established toward the end of July is fading.
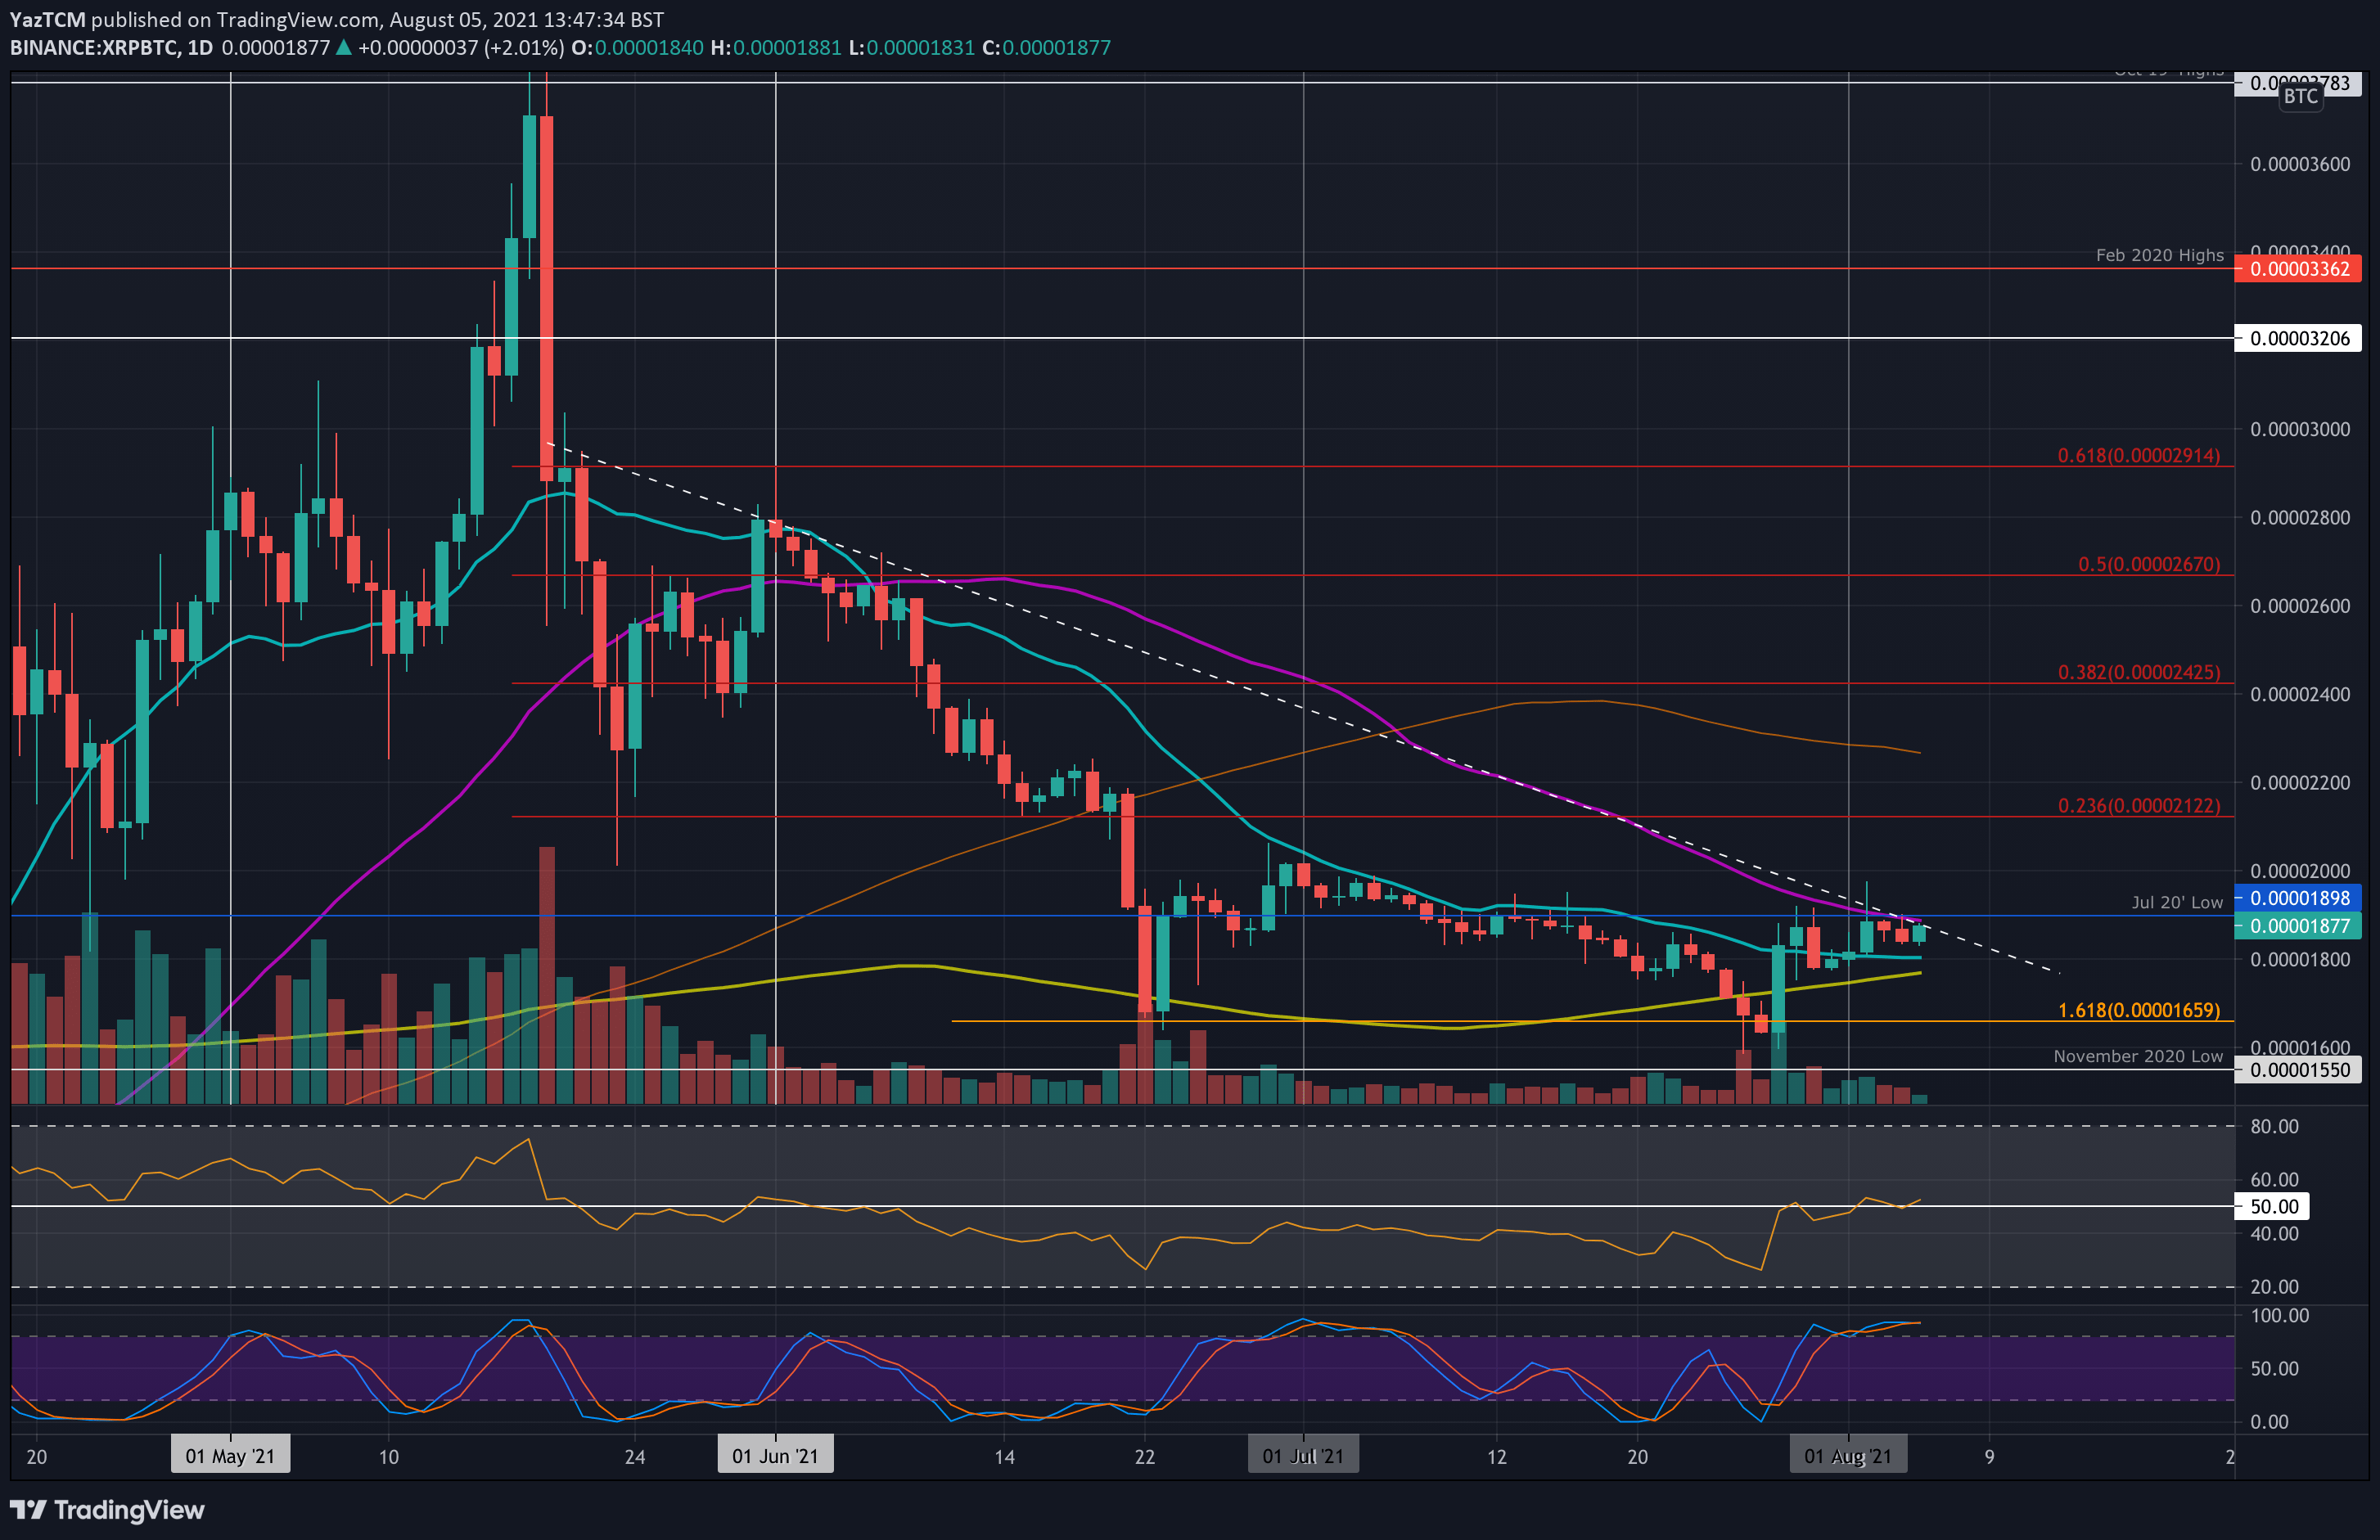
Key Support Levels: 1800 SAT, 1750 SAT, 1660 SAT.
Key Resistance Levels: 1900 SAT, 2000 SAT, 2120 SAT.
Against BTC, XRP continues to struggle to break the resistance at the 50-day MA around 1900 SAT, which is also the July 2020 low.
The coin bounced from the 20-day MA at 1800 SAT at the start of August but is still yet to produce a daily closing candle beyond the 50-day MA. A long-term descending trend line is also bolstering the resistance at 1900 SAT.
Looking ahead, the first resistance lies at 1900 SAT (July 2020 low, 50-day MA, & falling trend line). This is followed by 2000 SAT, 2120 SAT (bearish .236 Fib), and 2290 SAT (100-day MA).
On the other side, the first support lies at 1800 SAT (20-day MA). This is followed by 1750 SAT (200-day MA), 1660 SAT (June support), and 1550 SAT (Nov 2020 low).
The RSI continues to battle to break above the midline as the bulls attempt to establish momentum. It would need to remain above the midline for XRP to be able to break the 1900 SAT resistance.