XRP/USD:
Support: $0.27, $0.265, $0.26.
Resistance: $0.289, $0.3, $0.31.
XRP/BTC:
Support: 2800 SAT, 2710 SAT, 2650 SAT.
Resistance: 2900 SAT, 3000 SAT, 3115 SAT.
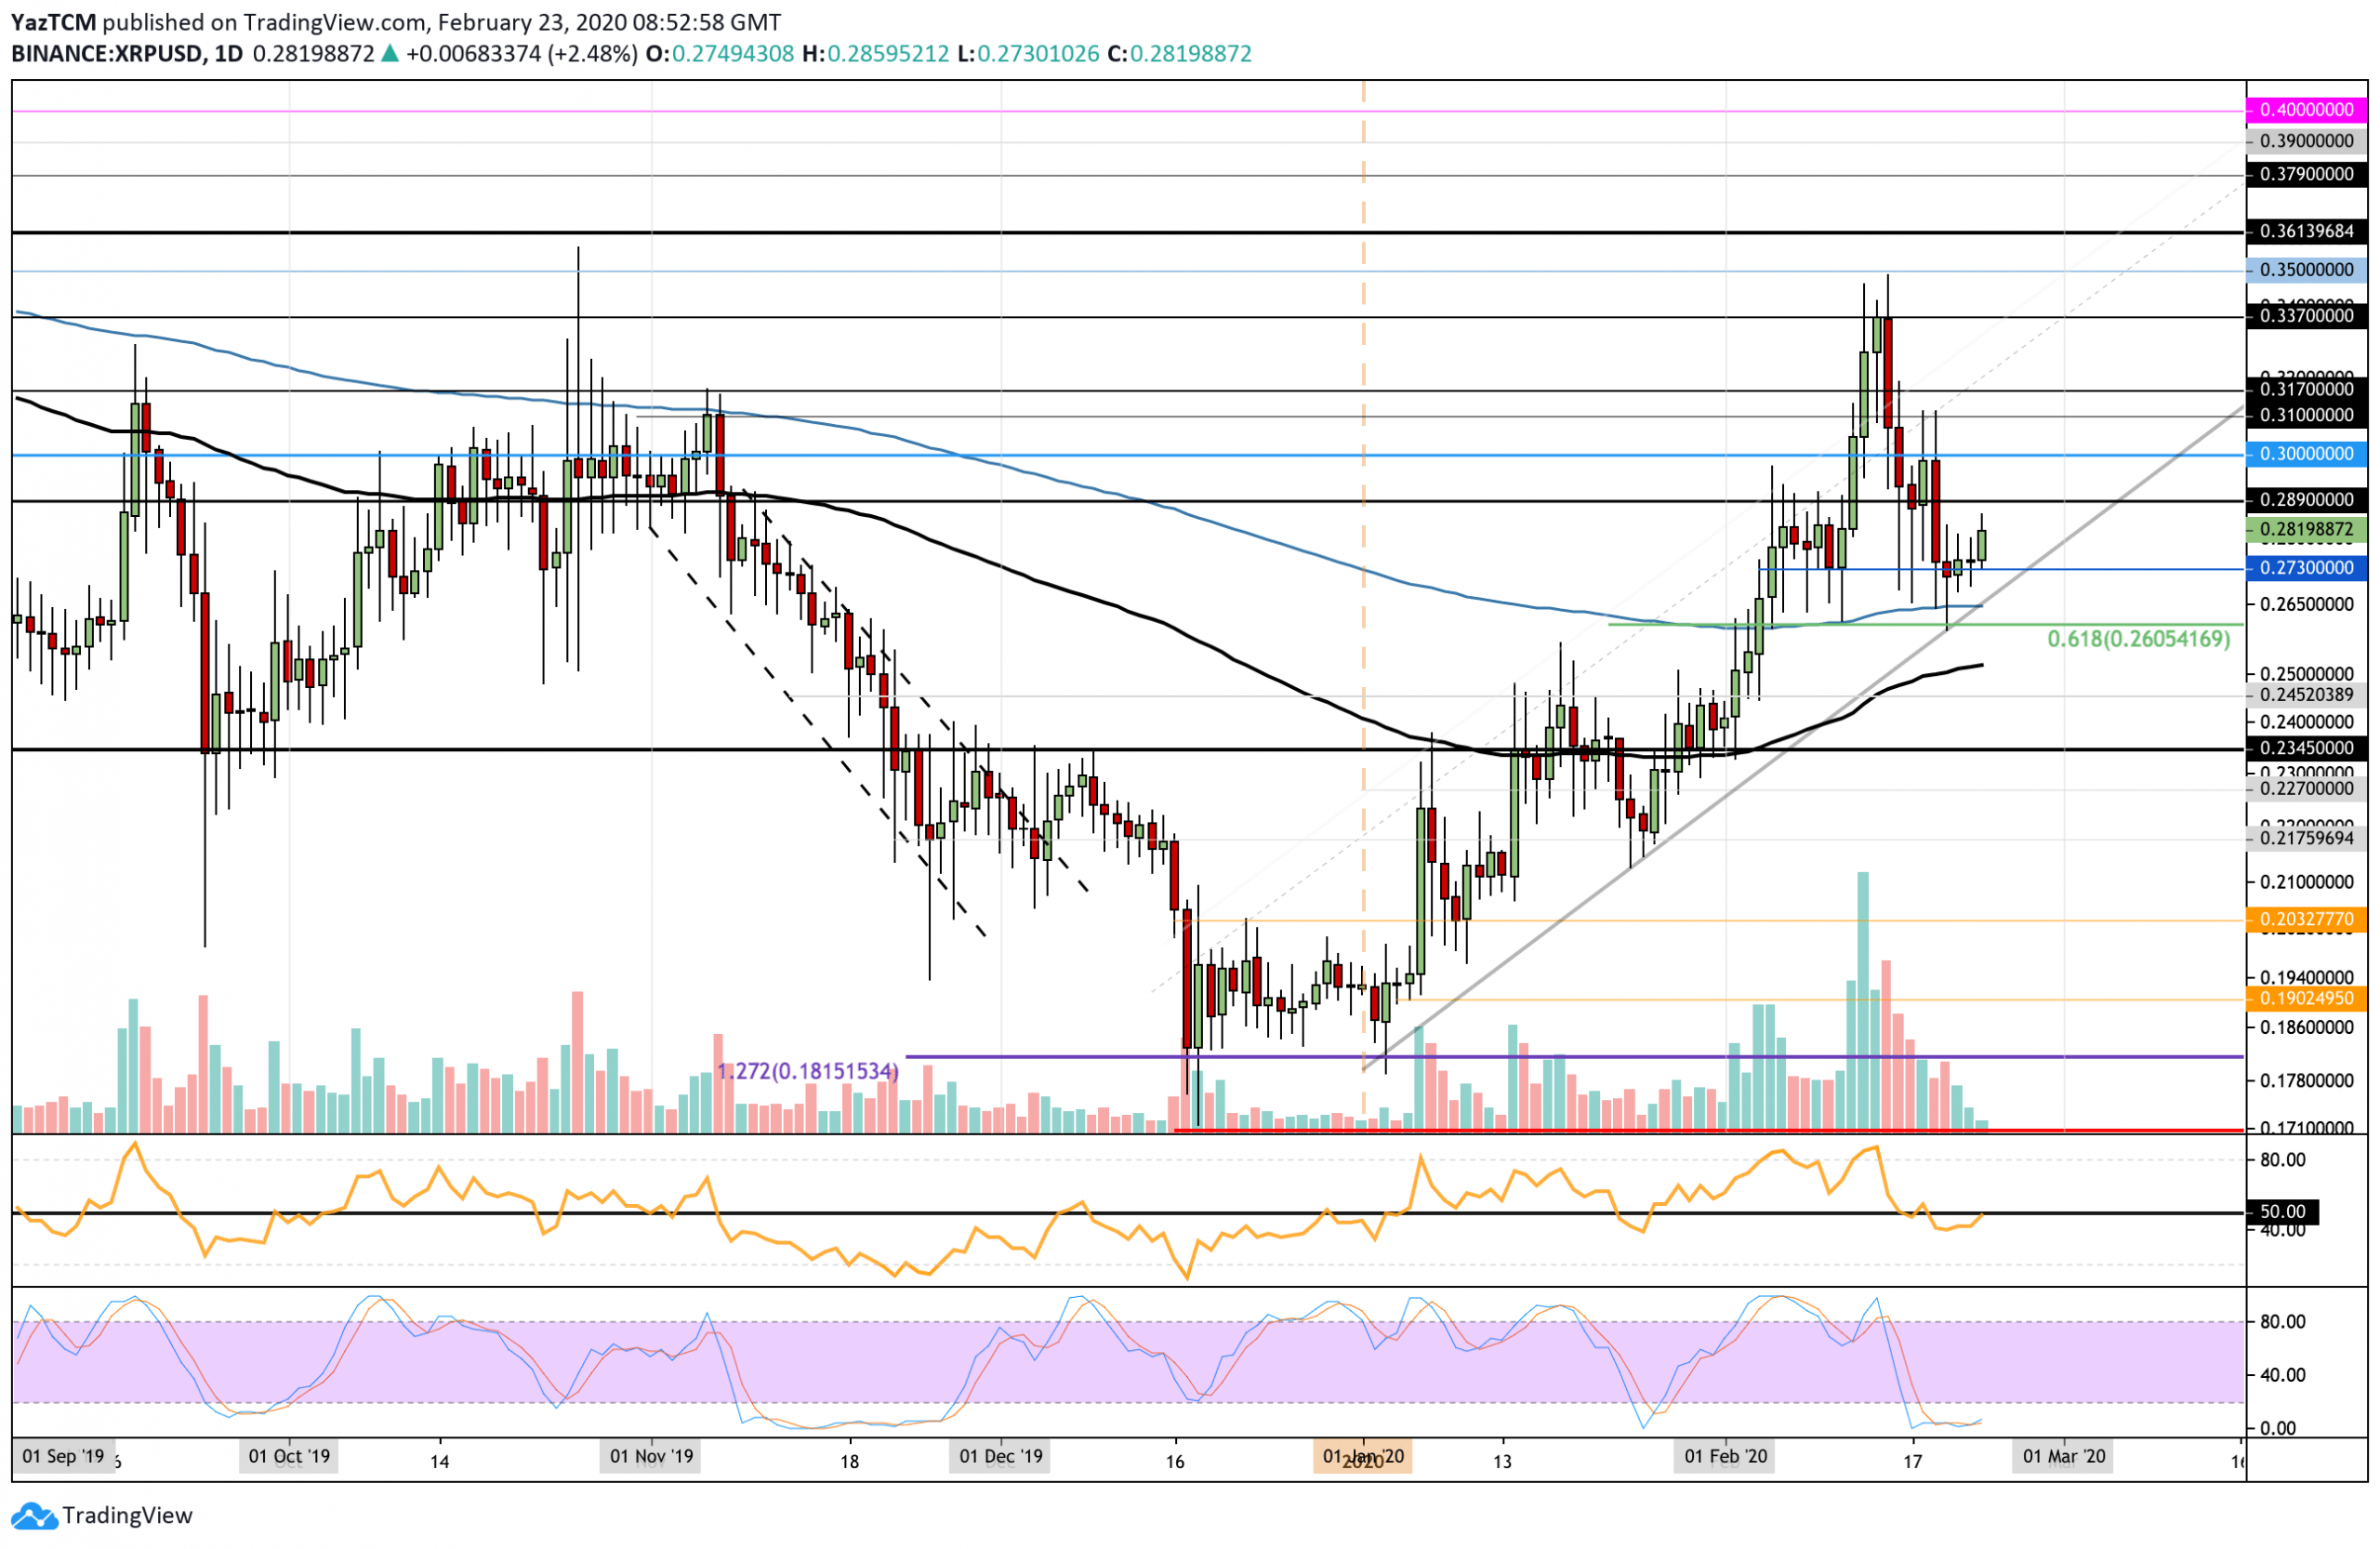
Since our last analysis, XRP continued to trade sideways along with the support at $0.27. It briefly dipped beneath to find additional support at the .618 Fib Retracement at $0.26 before quickly bouncing higher.
The cryptocurrency looks to be back on the positive track but will need to overcome $0.30 before any strong bullish momentum can be confirmed. A drop beneath $0.245 would put this in danger of turning bearish.
If the buyers continue higher, the first levels of resistance lie at $0.289 and $0.30. Beyond this, additional resistance lies at $0.31, $0.337, and $0.35.
Toward the downside, support lies at $0.27, $0.265 (200-days EMA), and $0.26. This is followed by added support at $0.25 (100-days EMA).
The RSI has returned to the 50 level as the buyers attempt to regain control of the market momentum. It would need to break above 50 before this is confirmed. The Stochastic RSI is also battling for a bullish crossover signal that will help XRP head toward $0.30.
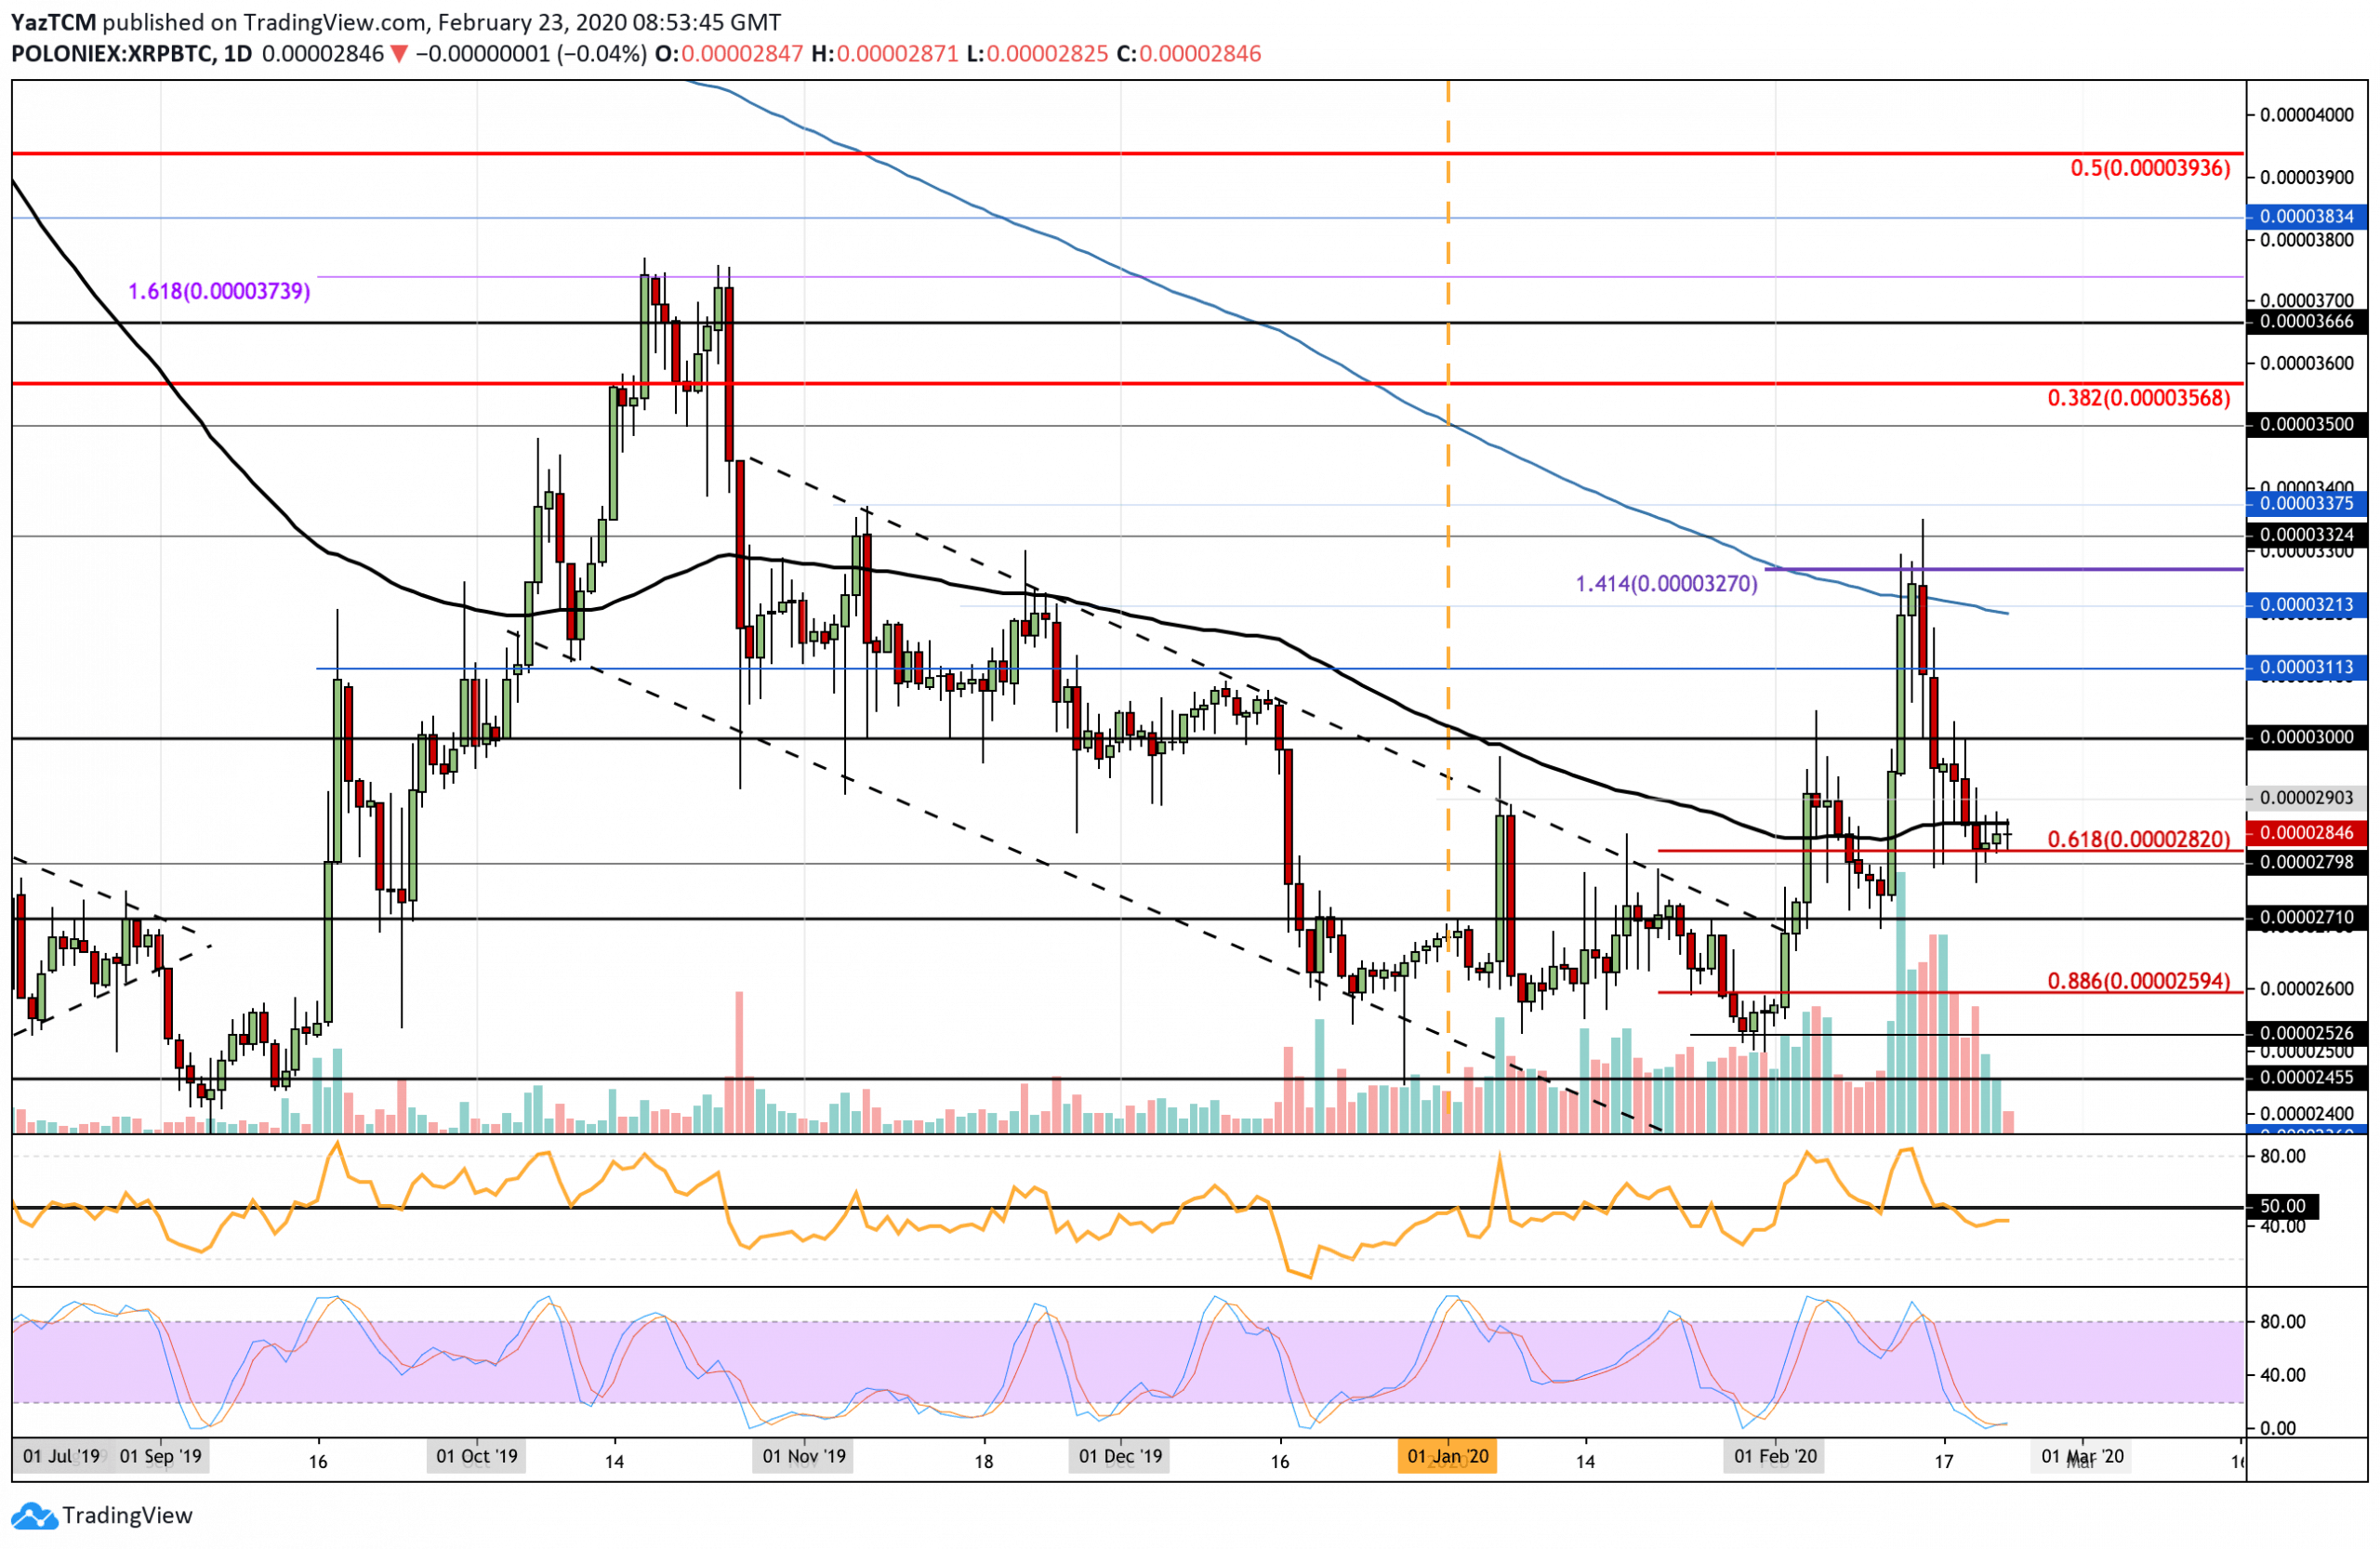
XRP continued to drop beneath the 100-days EMA against Bitcoin. However, it found solid support at the .618 Fib Retracement at 2820 SAT, which has allowed the market to reverse.
It remains beneath the 100-days EMA and would need to break this for the bullish momentum to start to kick in.
If XRP were to drop further beneath 2700 SAT, it would be in danger of turning bearish.
Once the bulls break the 100-days EMA, resistance is expected at 2900 SAT and 3000 SAT. Beyond this, resistance lies at 3115 SAT and 3215 SAT.
Alternatively, if the sellers push beneath 2820 SAT, support lies at 2800 SAT, 2710 SAT, and 2600 SAT.
The RSI remains beneath 50 to show that the bulls still have work to do before gaining control. However, the Stochastic RSI is also producing a bullish crossover signal that certainly should help XRP/BTC break above the 100-days EMA.