Ripple has corrected about 80% since touching the 2021 ATH at $1.97. The downtrend, which has lasted more than 400 days, has left many XRP holders frustrated and exhausted.
Technical Analysis By Grizzly
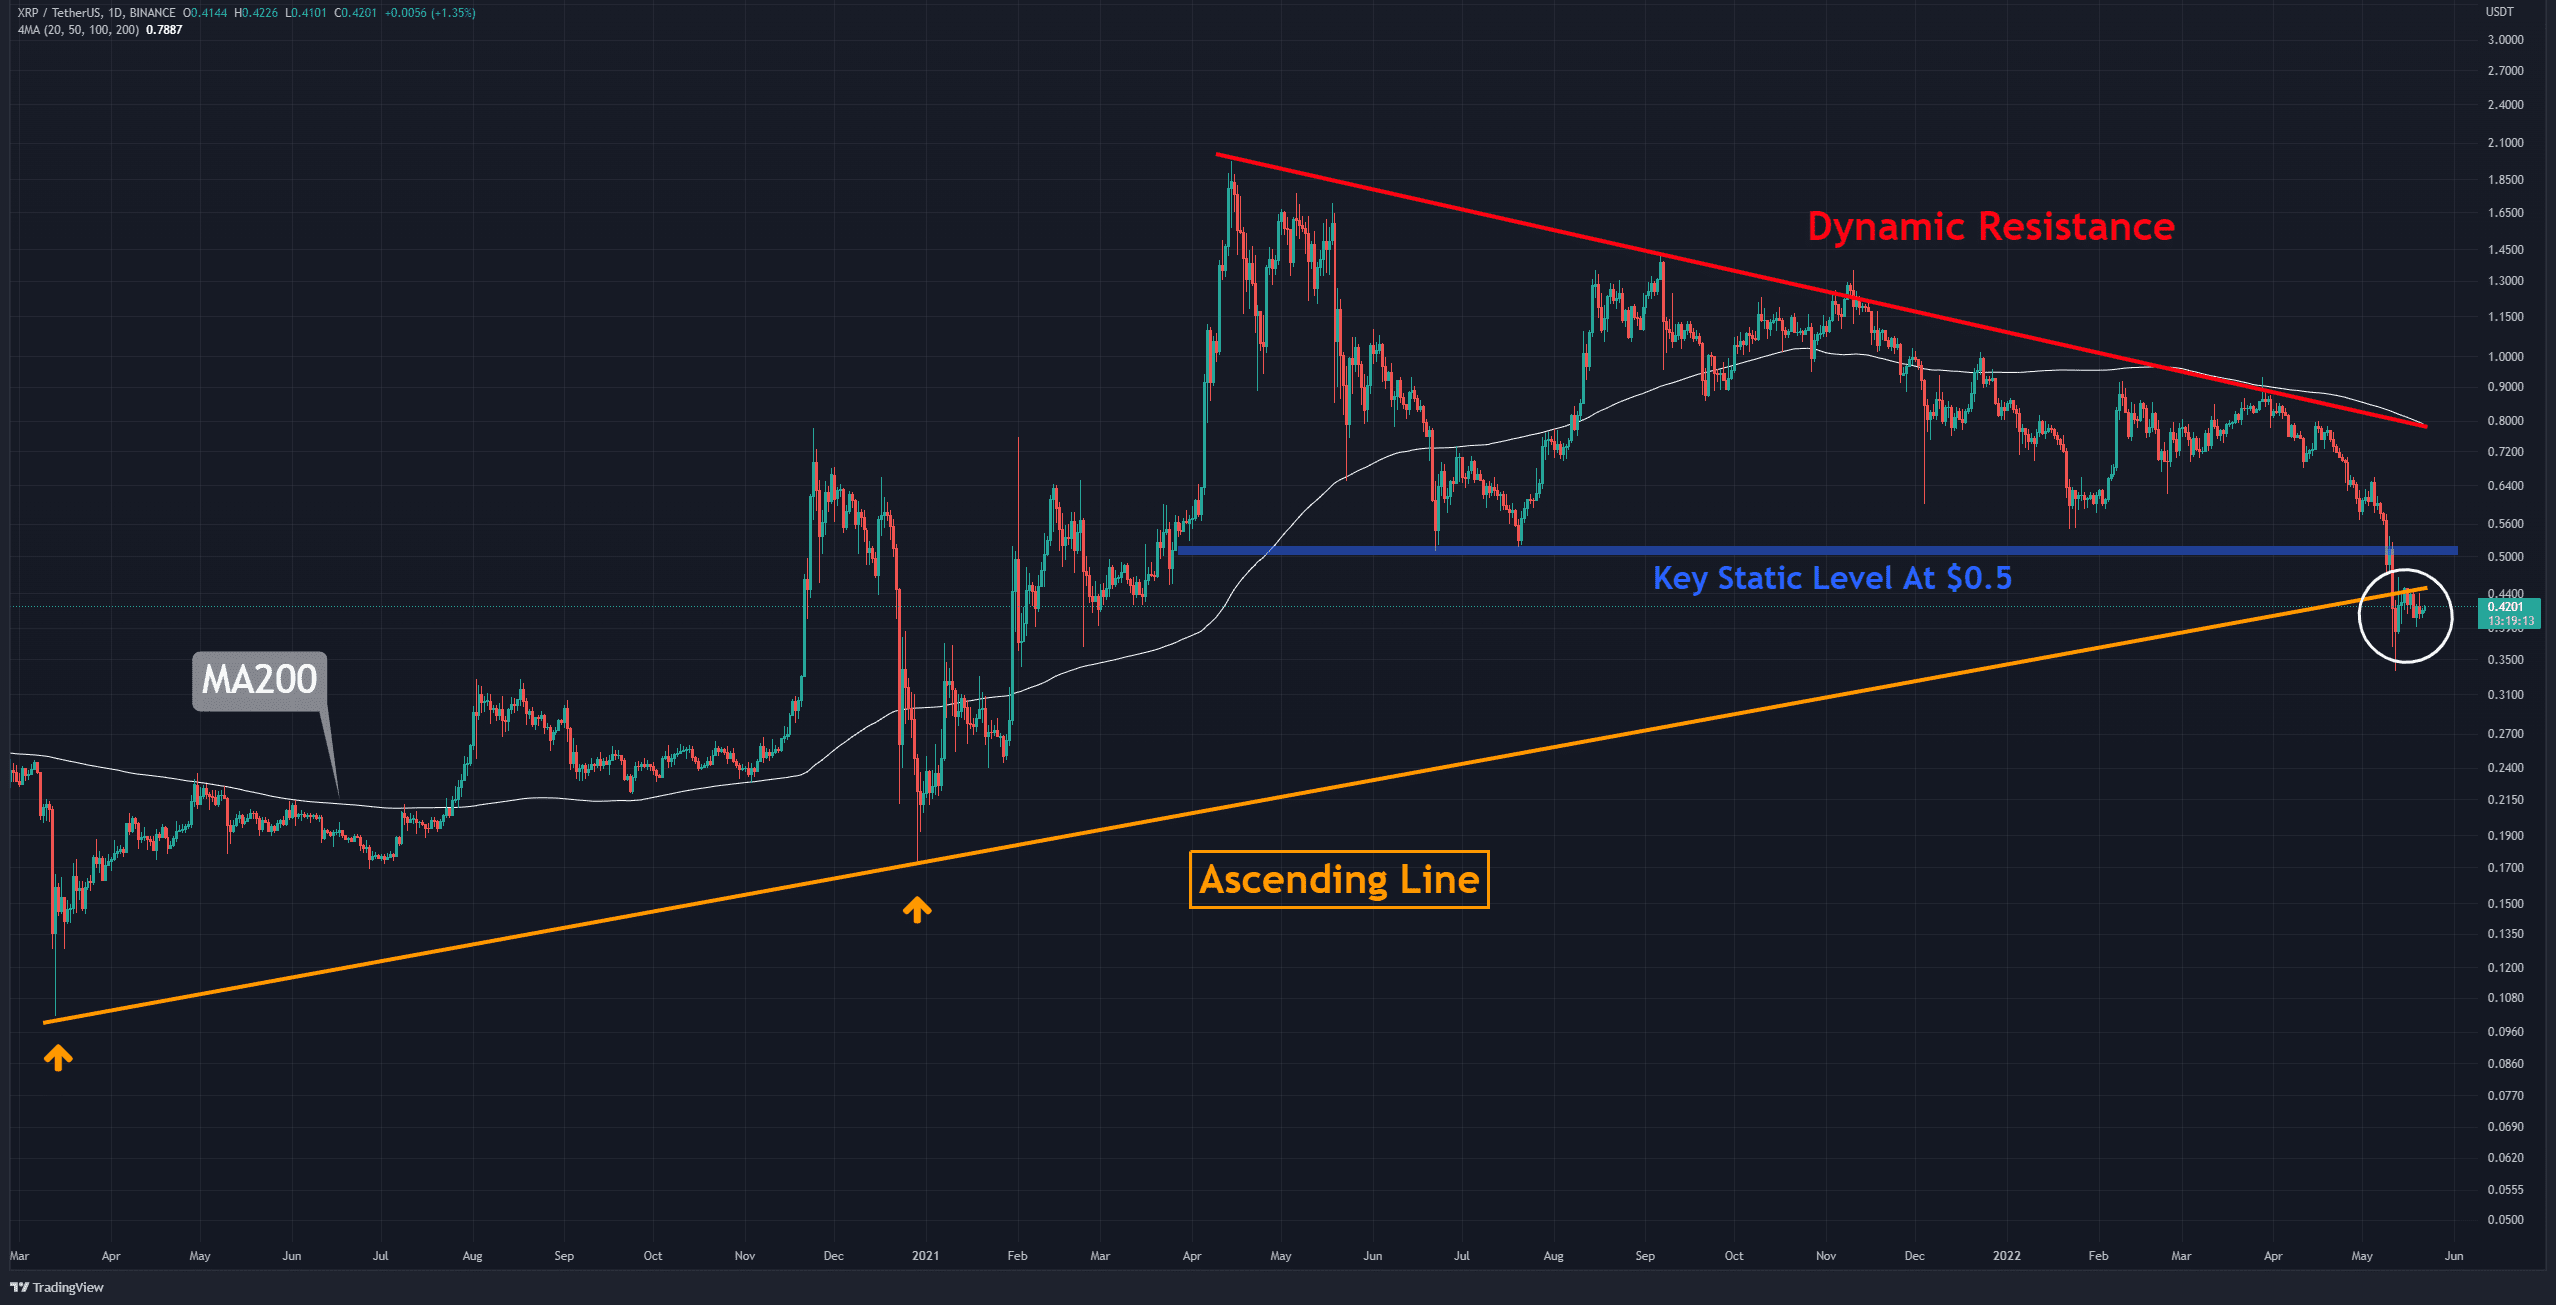
As seen below, the orange ascending line broke after successfully providing support for the price since the COVID crash of March 2020.
For a possible reversal, the bulls must first reclaim this trendline and then break above the critical static level at $0.50 (marked blue).
The bull’s mission will not end there: further above lies the dynamic resistance (marked red), which intersects with the daily MA200 (in white) — a challenging scenario for bulls at this point. There is no doubt that the bears now have complete control of the market.
Key Support Levels: $0.33 & $0.17
Key Resistance Levels: $0.50 & $0.68
Moving Averages:
MA20: $0.48
MA50: $0.62
MA100: $0.70
MA200: $0.78
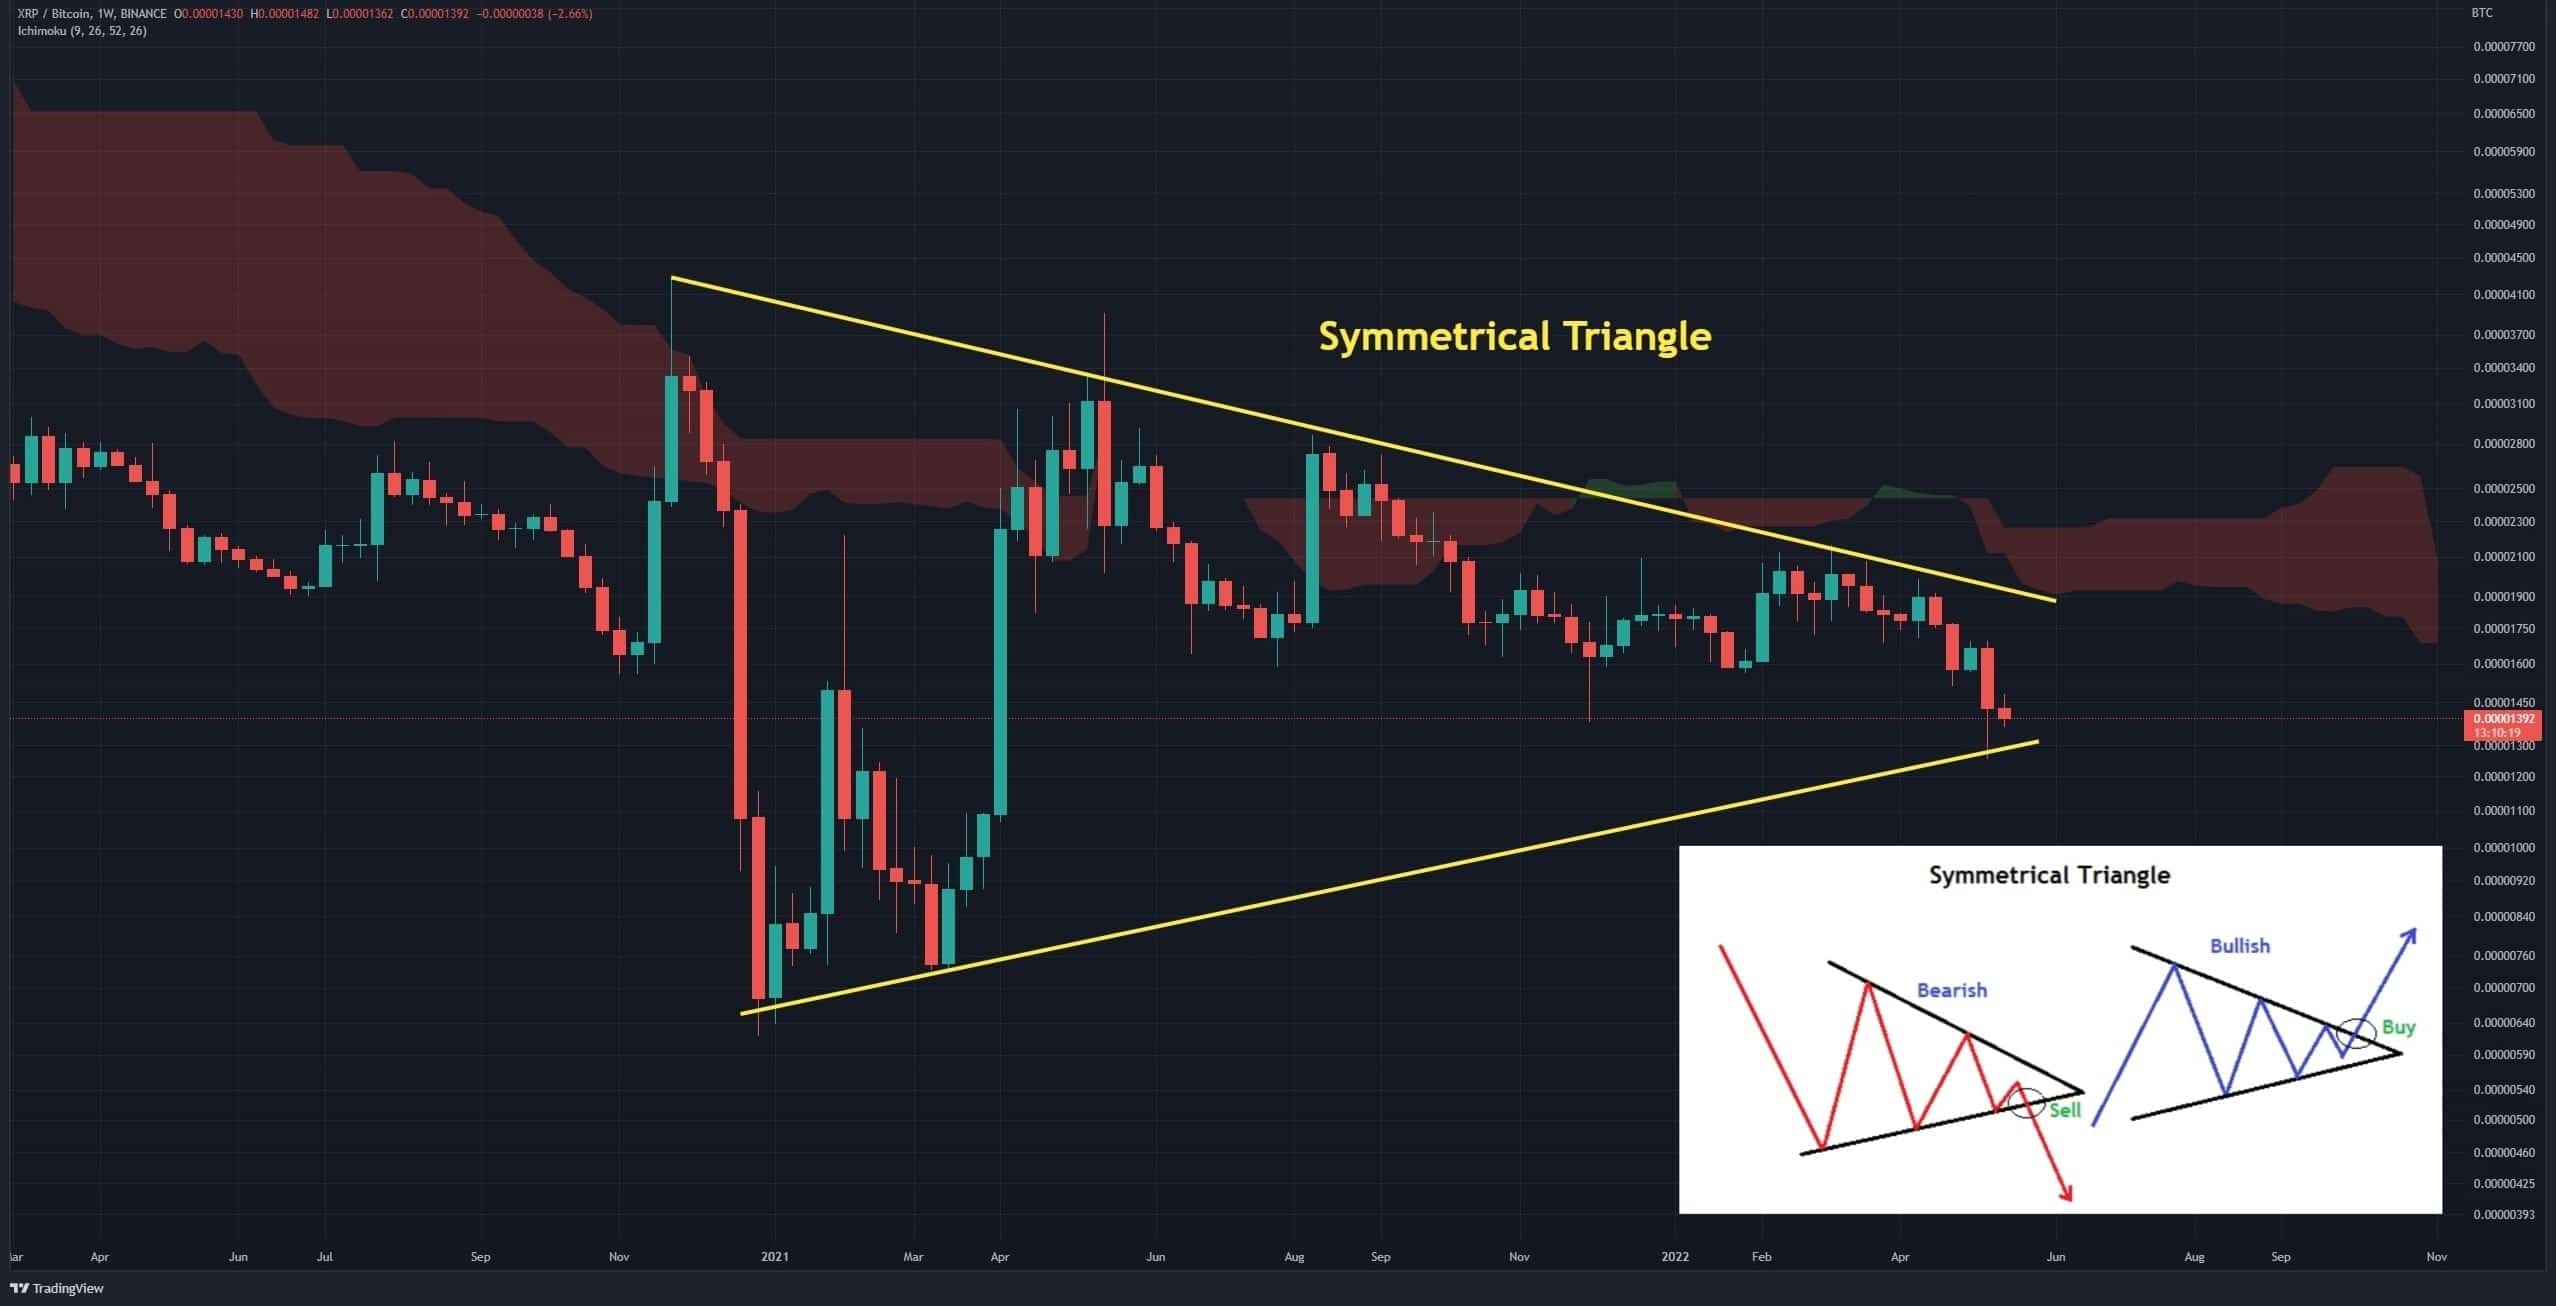
Against the BTC pair on the weekly chart, Ripple’s price fluctuates within a symmetrical triangle (in yellow). Since the price entered the triangle from the upper side, this pattern is technically bearish.
The thick Ichimoku cloud covers the upper side of the triangle, which contributes to its bearish strength. As long as the price can not break out from the lower side of the Ichimoku cloud, reaching the target of 700 Sats will be possible. This will likely lead to a significant drop in the USD pair chart.